It looks like you're using an Ad Blocker.
Please white-list or disable AboveTopSecret.com in your ad-blocking tool.
Thank you.
Some features of ATS will be disabled while you continue to use an ad-blocker.

Santorini: Is this volcanic activity?
page: 4share:
Here's some live video from this gorgeous place this morning. I don't know why the camera keeps zooming in on the water like that....certainly is a
beautiful place!
edit on 5/29/2012 by StealthyKat because: (no reason given)
reply to post by StealthyKat
It shows you also just how big that caldera is!
He was zooming in on the houses to see if anyone was nude sunbathing. The water maybe because of dolphins?
I saw the Yellowstone one on your thread. Yes looks normal as you say.
The Santorinin seismos all look about the same with wind currently at 22 km/hr. I still shake my head as to how those can be any use to them unless they are not seeing what we are seeing, which they probably are not.
I must get those location pics up. Too much to do and not enough time.
edit on 30/5/2012 by PuterMan because: (no reason given)
reply to post by PuterMan
Nude sunbathers huh? Once when it zoomed in, it was very early morning and there was a lady sitting out at a table wearing her night gown, drinking coffee and reading.....it looked so serene...I was major jealous! Well, it's a good cam to know about if there is ever an eruption, I'll probably catch it.....*crosses fingers*
Nude sunbathers huh? Once when it zoomed in, it was very early morning and there was a lady sitting out at a table wearing her night gown, drinking coffee and reading.....it looked so serene...I was major jealous! Well, it's a good cam to know about if there is ever an eruption, I'll probably catch it.....*crosses fingers*
Quite a lot of subduction zone activity around
Crete in the past 48 hours
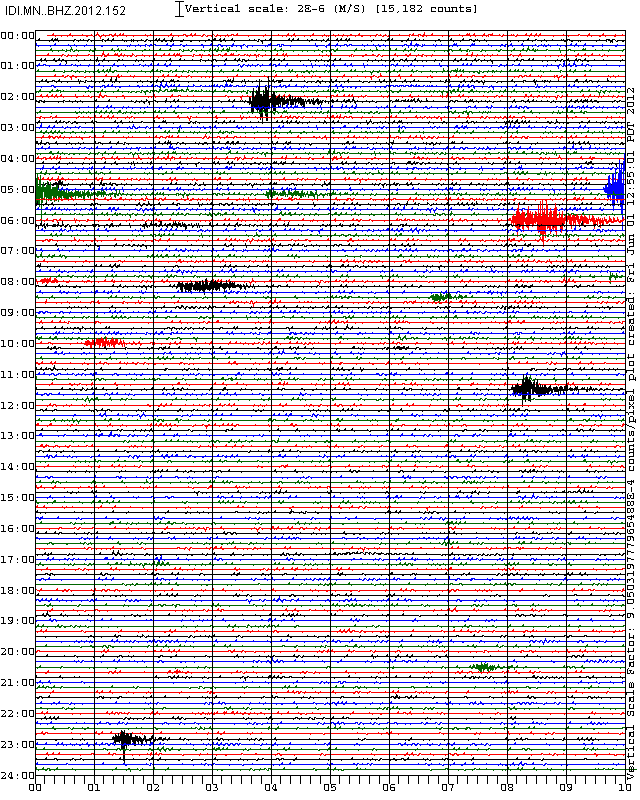
The seismos seem to be the usual mess but on the bottom three BUD plots there are some larger signals.
The green signal currently showing on MN.IDI Anogia, Greece (Crete) ~132km from Santorini is the Mag 2.5 in Crete.
The larger blue signal on HL.ARG Archaggelos, Rhodes, Greece ~245km from Santorini is almost certainly the 3.5 in the Dodecanese Islands at 06:27
The green signal on HL.ITM Ithomi, Messinia, Greece ~322km from Santorini I can't identify but it looks like a small local quake.
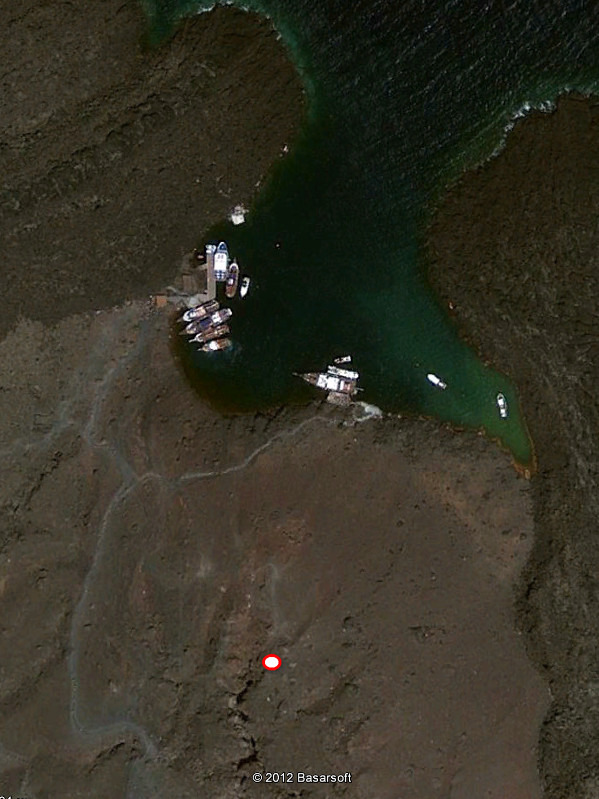
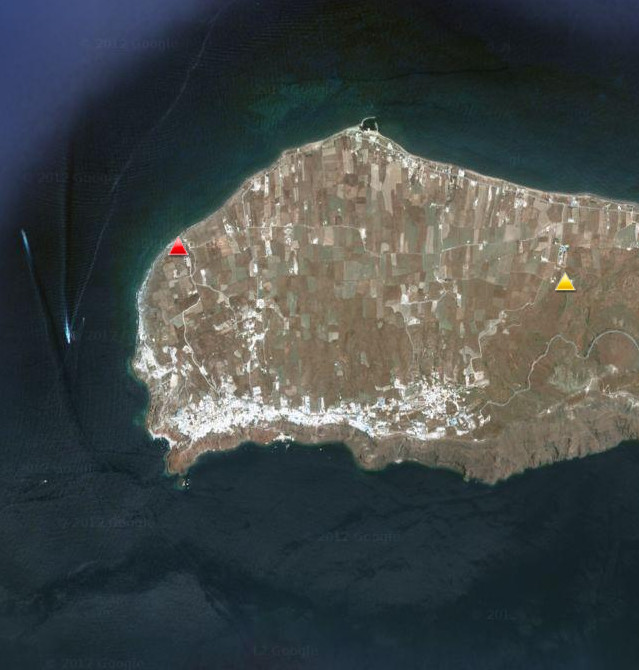
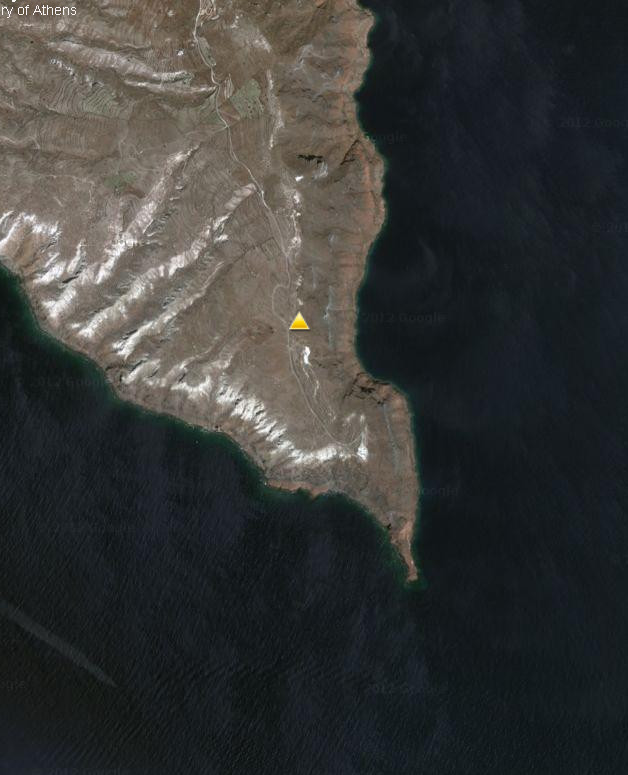
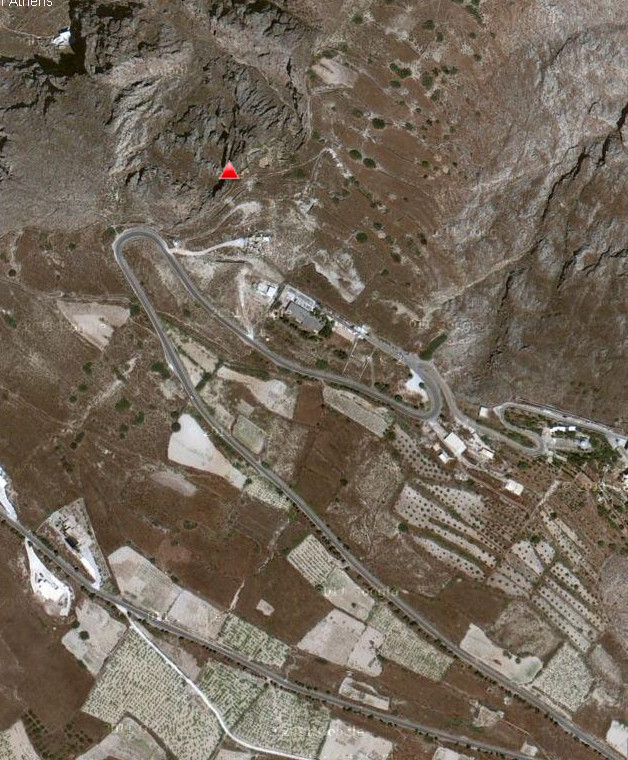
Of the Santorini seismos THR3 (On the central island) is showing definite signals that look like heavy diesel engines (or trains which it can't be) which I would attribute to fishing boats possibly. You can see the location of the seismo in relation to the small harbour there.
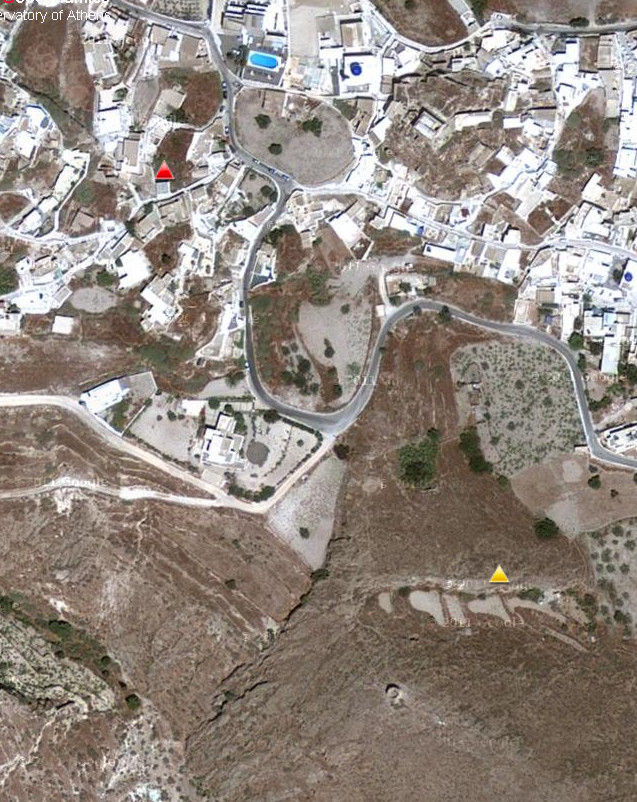
THR6 and SAP1. THR6 seems to be picking up passing boats and SAP1 in the middle of habitatiion is pointless, but having said that it has one of the better traces. (Scroll down to find it)
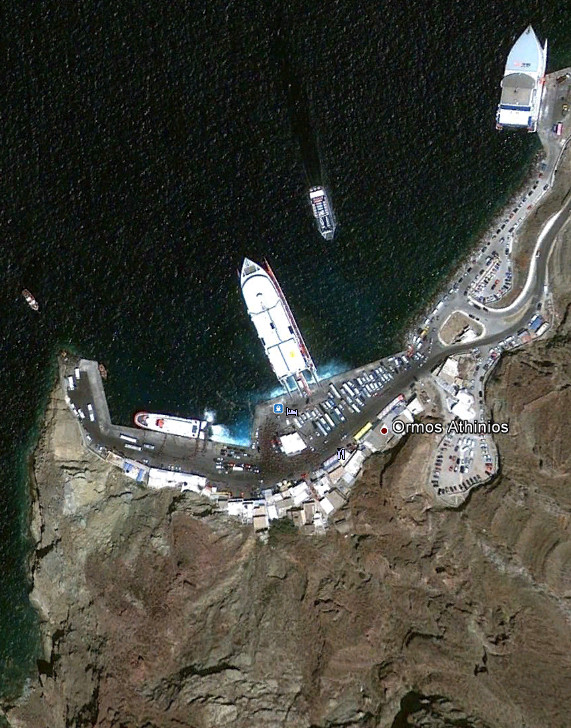
THT1 I have already covered. Not sure of the exact location but it is right by the harbour
CMBO
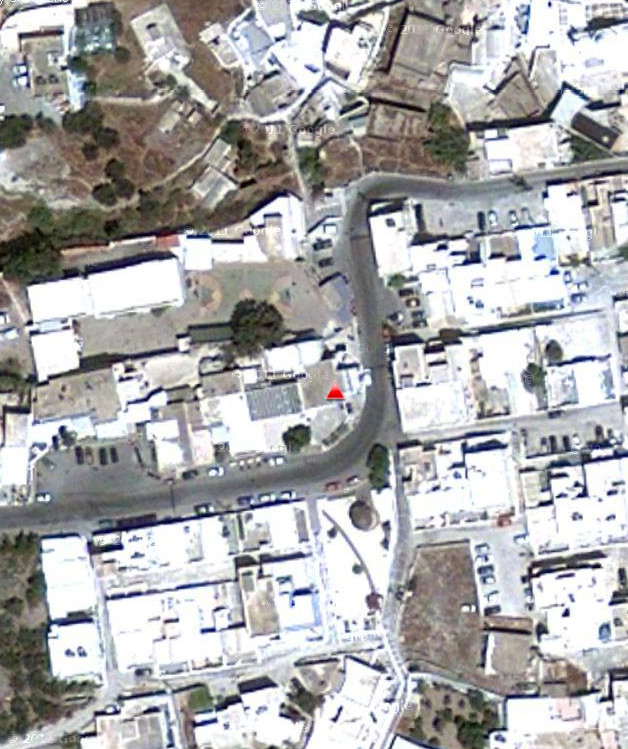
SAP4 - Right in the sewage works!

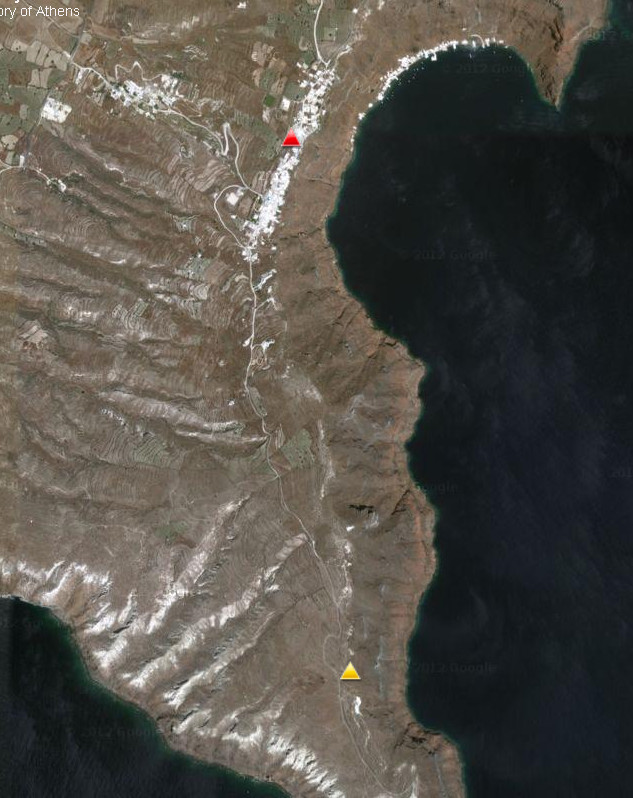
The relative positions of SAP4 and CMBO - boats as well
THR7
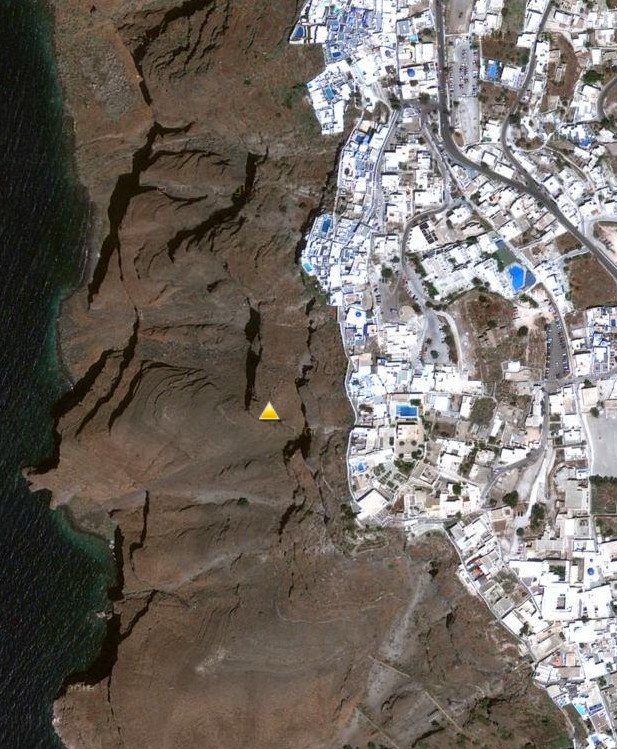
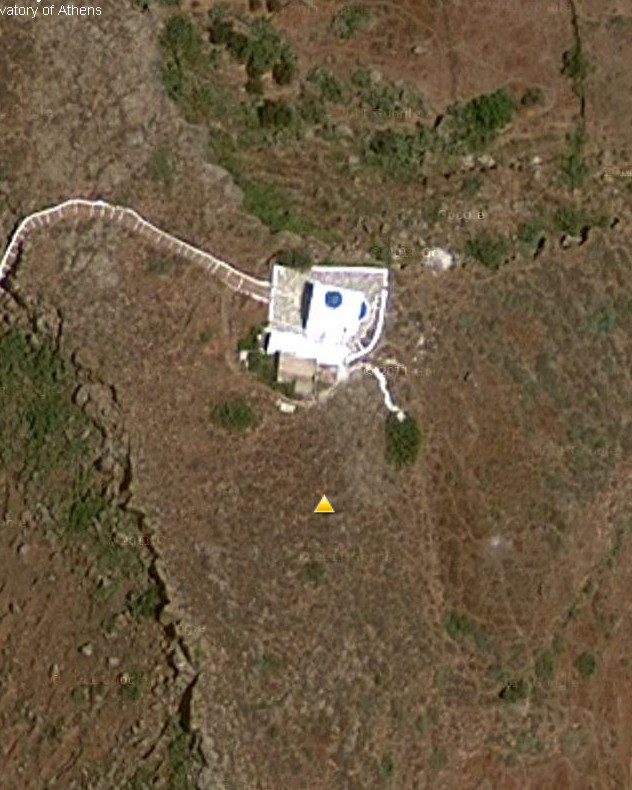
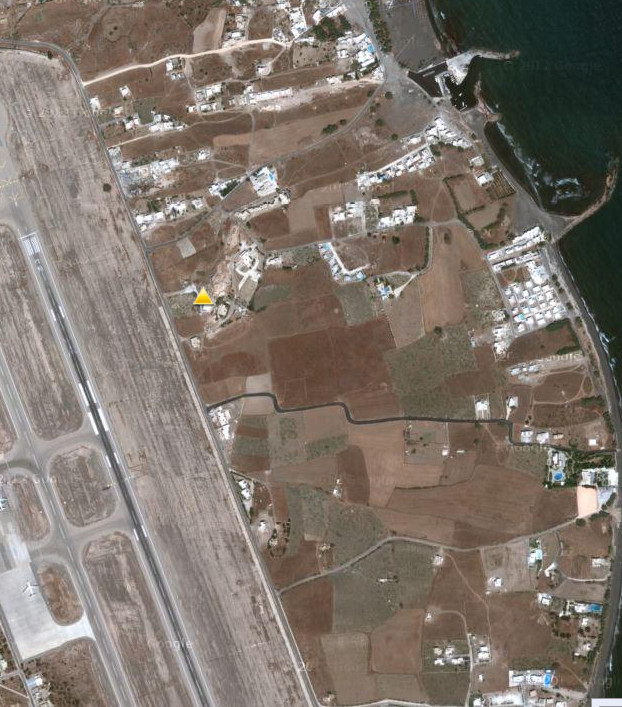
SAP2 - The perfect location
Relative position of THR7 and SAP2
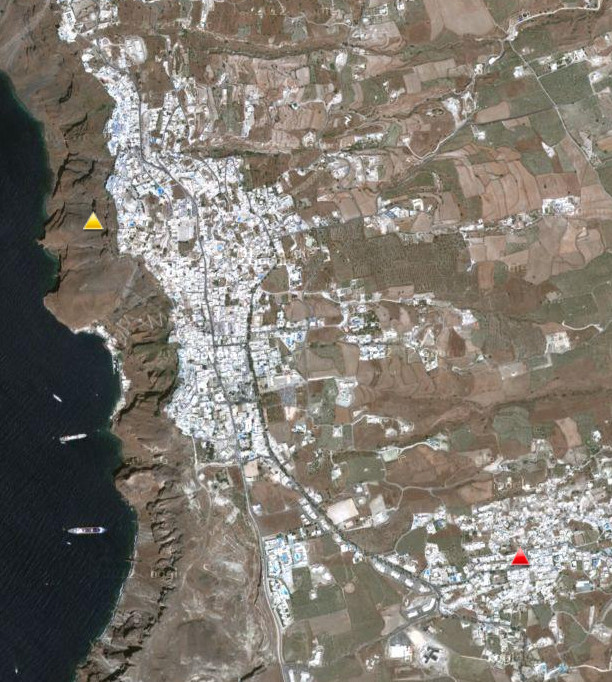
THR5
Relative positions of SAP3 and THR5
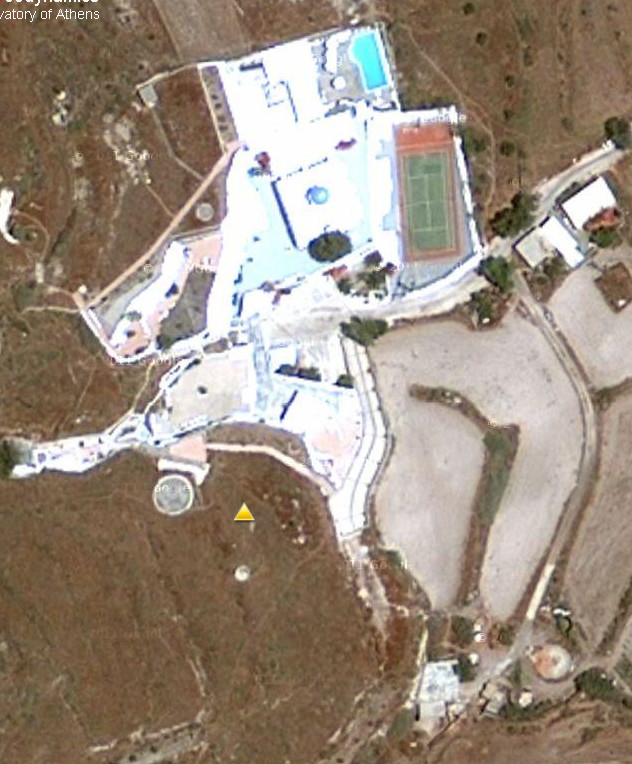
THR8 - Monlithos. This one you have to love!
THR2 - ? what is that?
That will have to do - oh, no one last one SANT
The seismos seem to be the usual mess but on the bottom three BUD plots there are some larger signals.
The green signal currently showing on MN.IDI Anogia, Greece (Crete) ~132km from Santorini is the Mag 2.5 in Crete.
The larger blue signal on HL.ARG Archaggelos, Rhodes, Greece ~245km from Santorini is almost certainly the 3.5 in the Dodecanese Islands at 06:27
The green signal on HL.ITM Ithomi, Messinia, Greece ~322km from Santorini I can't identify but it looks like a small local quake.
Of the Santorini seismos THR3 (On the central island) is showing definite signals that look like heavy diesel engines (or trains which it can't be) which I would attribute to fishing boats possibly. You can see the location of the seismo in relation to the small harbour there.
THR6 and SAP1. THR6 seems to be picking up passing boats and SAP1 in the middle of habitatiion is pointless, but having said that it has one of the better traces. (Scroll down to find it)
THT1 I have already covered. Not sure of the exact location but it is right by the harbour
CMBO
SAP4 - Right in the sewage works!
The relative positions of SAP4 and CMBO - boats as well
THR7
SAP2 - The perfect location
Relative position of THR7 and SAP2
THR5
Relative positions of SAP3 and THR5
THR8 - Monlithos. This one you have to love!
THR2 - ? what is that?
That will have to do - oh, no one last one SANT
edit on 1/6/2012 by PuterMan because: (no reason given)
reply to post by StealthyKat
Which cam was it you were watching again? I found it!
www.villailias.gr...
Never stays still does it.
I quite like this one with the houses on the other side of the caldera looking like snow on the hills.

I really must try and go there. It looks beautiful.
www.villailias.gr...
Never stays still does it.
I quite like this one with the houses on the other side of the caldera looking like snow on the hills.
I really must try and go there. It looks beautiful.
edit on 1/6/2012 by PuterMan because: (no reason given)
reply to post by PuterMan
Recently, exactly from the 28th May, we have in Crete - particularly Agios Nikolaos - on-going tremblings and earthquakes. We had around 10 within 24hours (that day/night) and it's going on up to yesterday. Today (1st June) it's quiet so far.
First 2 days the earthquakes were very shallow - we're checking all the time the website:
bbnet.gein.noa.gr...
Please, visit to get better info.
We are living here since few years and nth like this happened before, If there was an earthquake it mainly occurred somewhere on the sea and maybe once or twice per year. What is happening here since the 28th May (Thursday) is pretty frightening and definitely alerting.
Sometimes we can clearly feel just vibrations - the feeling is exactly the same like You can read in some posts or websites where the scientists explain the foreshocks - like the magma is moving.
The last earthquake we had, the one we could feel, was yesterday night at 23.37 local time (GMT +3). Earthquakes and tremors, I'm writing here about, happen every time in approximately the same area around and in the city of Agios Nikolaos (not farther than 10km from the centre of the town).
The photo shows the last 24 hours "Revised Locations" (all of the quake points on the map are from the 31May) So far today, we didn't feel any earthquake but sometimes tremblings can be felt.
The other thing is, that people here seem to not put any attention to it, they don't seem alerted AT ALL. We know, that recently all Mediterranean Area is shaking pretty much, together with the deadly earthquakes in Italy. Dodecanese Islands in this area are shaking too. Almost ALL of the quakes are around 3.0 Magnitude, sometimes more. At the begging they occurred in the depth not more than 15km but since 2 days they are deeper - You can see the colours and the meaning on the map legend.
Another website we're checking:
www.emsc-csem.org...
What is very interesting in this point, especially when looking at the whole situation of recent growing seismic activity from "our" (Agios Nikolaos) point of view is - we have a lake here called "Voulismeni" - it has a volcanic rocky formations around. It's said that the lake is somehow connected with the Santorini volcano - when there was an eruption, here in the lake, the water with it's power was "throwing" dead fish out. Generally, when You observe the water level in the lake there are moments when the water is rising and than after a while is dropping again - with "perfect timing" like in a clock. There is sth going on here for sure.
We're afraid now, that all those tremblings and seismic activity, that is clearly around the lake, might lead to sth bigger.
All those tremors, tremblings and earthquakes are definitely building up and it's visible to everyone, You don't have to be a scientist to see what is happening.
It might also have to do with the Polar Shift, so widely discussed all over different blogs and websites. For example today (1st June) there was a 5.6 earthquake in Antarctica.
Please, keep posting all the news!!!
reply to post by AgiR83
At last somebody local!
Thank you so very much for your input.
I am very concerned about what you are saying about "Voulismeni" Lake....that does not sound good at all.
You obviously have a very good understanding about volcanoes. I am very sure PuterMan will be doing an Irish Jigg (dance) when he sees your post.
Please keep us updated...and more importantly stay safe...Greece is trembling in more ways than one!
Rainbows
Jane
Originally posted by PuterMan
Quite a lot of subduction zone activity around Crete in the past 48 hours
Imo, that's all that's been going on in Greece....subduction zone quakes...
After looking carefully at all the instruments placed around Santorini, their locations, instrument types, and comparing signatures between them, imo you've got a great recipe for a lot of man made noise. And that's about it. I don't see much if any seismic activity at all coming directly from Santorini. The SAP instruments are high gain broadbands, while the THR instruments are shortbands. I know from talking to..a certain person...that volcanic tremor will easily register out to 120 km's or more, so if it was tremor, all those instruments on and around Santorini would probably be pegged out.
A lot of those instruments are also portables, probably similar to what the TA network uses, and imply that they are not boreholes, and sitting just about above ground (shallow stations). That means they are a lot more susceptible to wind noise and other close surface vibrations- and there is a lot of it there. I also question the locations of most of those instruments- more remote spots would be better, away from all that man activity.
So to directly answer the question posed in the thread title: no, imo, it's not volcanic activity. To be absolutely sure it would be nice to have access to the raw data for frequency content analysis, but in the absence of it, all the other factors you point out in thread, and my own investigation suggest it's all just noise.
edit on Fri Jun 1st 2012 by TrueAmerican because: (no reason given)
reply to post by TrueAmerican
Hi TA
The THR ones were all pegged out, and still are, which was why I was looking at this in the first place.
I have never seen such a badly placed set of seismo and, as I have been saying, these would be completely useless if there was VT as you would not see it. You might on some of the SAP instruments but they are in some really stupid places and every single one of them in in an urban, or inhabited, situation. Completely crazy.
In addition to be showing so much noise they must be on really sensitive settings. Pointless IMHO.
Hi TA
I know from talking to..a certain person...that volcanic tremor will easily register out to 120 km's or more, so if it was tremor, all those instruments on and around Santorini would probably be pegged out.
The THR ones were all pegged out, and still are, which was why I was looking at this in the first place.
I have never seen such a badly placed set of seismo and, as I have been saying, these would be completely useless if there was VT as you would not see it. You might on some of the SAP instruments but they are in some really stupid places and every single one of them in in an urban, or inhabited, situation. Completely crazy.
In addition to be showing so much noise they must be on really sensitive settings. Pointless IMHO.
reply to post by AgiR83
the part about the lake is very disturbing!! really interesting to hear from a local. thanks so much for the post.
the part about the lake is very disturbing!! really interesting to hear from a local. thanks so much for the post.
reply to post by AgiR83
Thanks for joining the thread. As AC said nice to have someone local on board.
Yes I noticed the mini-swarm pretty much all in the one line. Here are the counts using EMSC data

Definitely the one to use as USGS is completely useless for this. EMSC should be OK for quakes over Mag 2.0
Here is the seismo for the 28th. It does not show a lot which would suggest that these were quite local.
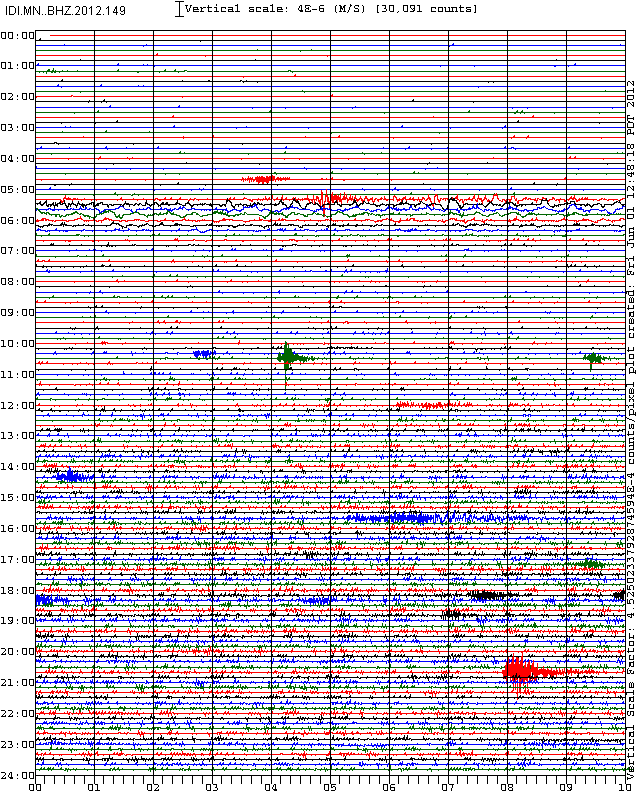
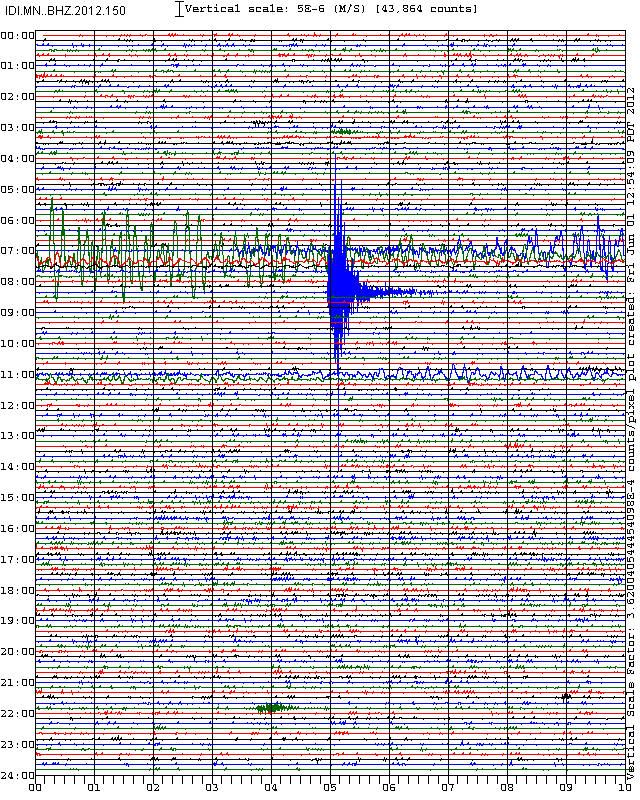
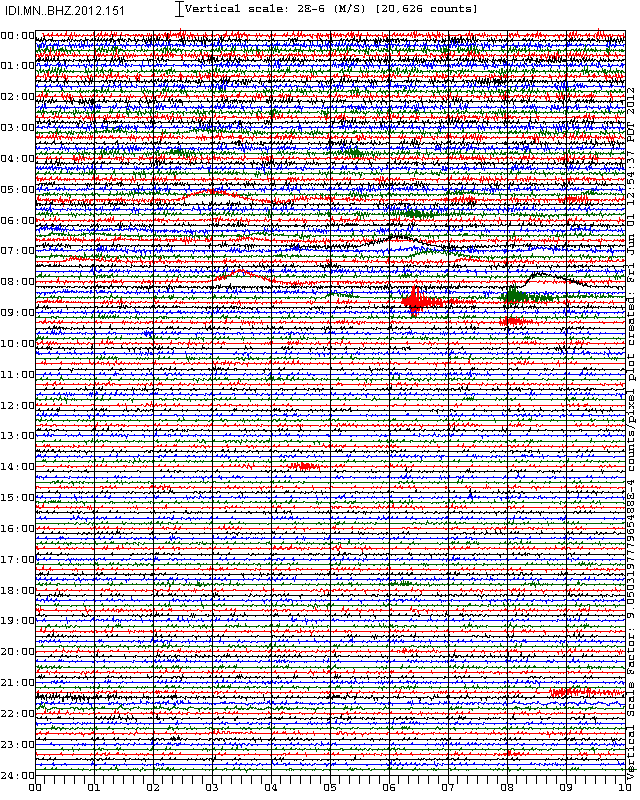
I am going to pull the SAC data for each day and take a better look. I am going to show all the seismograms from MN.IDI on Crete but I shall not comment on them until I have done some analysis.
I need to run an harmonic analysis so i will get back to you on that one.
You are correct there, in fact you might see more because you are not a scientist.
Please let me clear that one up for you. The Pole Shift is the shift of the magnetic field and not the whole of the crust as is suggested by some blogs that that little knowledge and even less common sense. The Pole Shift will have very little if any effect upon us when it happens. We will not be fried like in a microwave as is suggested as actually most of our protection comes from the atmosphere and not from the very weal magnetic field.
I will get back to you on this. It may not be tonight but as Arnie said I'll be back.
Just before I go..............
Lake Voulismeni (Source:Wikipedia)
Perhaps this explains the rhythmic rise and fall of the lake?
Thanks for joining the thread. As AC said nice to have someone local on board.
Recently, exactly from the 28th May, we have in Crete - particularly Agios Nikolaos - on-going tremblings and earthquakes. We had around 10 within 24hours (that day/night) and it's going on up to yesterday. Today (1st June) it's quiet so far.
Yes I noticed the mini-swarm pretty much all in the one line. Here are the counts using EMSC data
First 2 days the earthquakes were very shallow - we're checking all the time the website:
bbnet.gein.noa.gr...
Definitely the one to use as USGS is completely useless for this. EMSC should be OK for quakes over Mag 2.0
We are living here since few years and nth like this happened before, If there was an earthquake it mainly occurred somewhere on the sea and maybe once or twice per year. What is happening here since the 28th May (Thursday) is pretty frightening and definitely alerting.
Here is the seismo for the 28th. It does not show a lot which would suggest that these were quite local.
I am going to pull the SAC data for each day and take a better look. I am going to show all the seismograms from MN.IDI on Crete but I shall not comment on them until I have done some analysis.
Sometimes we can clearly feel just vibrations - the feeling is exactly the same like You can read in some posts or websites where the scientists explain the foreshocks - like the magma is moving.
I need to run an harmonic analysis so i will get back to you on that one.
The last earthquake we had, the one we could feel, was yesterday night at 23.37 local time (GMT +3). Earthquakes and tremors, I'm writing here about, happen every time in approximately the same area around and in the city of Agios Nikolaos (not farther than 10km from the centre of the town).........
....What is very interesting in this point, especially when looking at the whole situation of recent growing seismic activity from "our" (Agios Nikolaos) point of view is - we have a lake here called "Voulismeni" - it has a volcanic rocky formations around. It's said that the lake is somehow connected with the Santorini volcano - when there was an eruption, here in the lake, the water with it's power was "throwing" dead fish out. Generally, when You observe the water level in the lake there are moments when the water is rising and than after a while is dropping again - with "perfect timing" like in a clock. There is sth going on here for sure.
You don't have to be a scientist to see what is happening.
You are correct there, in fact you might see more because you are not a scientist.
It might also have to do with the Polar Shift, so widely discussed all over different blogs and websites. For example today (1st June) there was a 5.6 earthquake in Antarctica.
Please let me clear that one up for you. The Pole Shift is the shift of the magnetic field and not the whole of the crust as is suggested by some blogs that that little knowledge and even less common sense. The Pole Shift will have very little if any effect upon us when it happens. We will not be fried like in a microwave as is suggested as actually most of our protection comes from the atmosphere and not from the very weal magnetic field.
I will get back to you on this. It may not be tonight but as Arnie said I'll be back.
Just before I go..............
The lake connects to the harbour of the town by a channel dug in 1870.
Lake Voulismeni (Source:Wikipedia)
Perhaps this explains the rhythmic rise and fall of the lake?
edit on 1/6/2012 by PuterMan because: (no reason given)
Originally posted by PuterMan
The THR ones were all pegged out, and still are, which was why I was looking at this in the first place.
Hmm, while I see periods of high noise at THR3 and at the others, for the moment those stations are anything but completely clipped (what I meant by pegged out). So I am not sure why you would make such a statement, especially with your knowledge. But it's not true, at least at the moment. You can see this by looking at other peaky signatures and seeing where the clipping point is set on their webicorder plotter settings.
bbnet.gein.noa.gr...
I have never seen such a badly placed set of seismo and, as I have been saying, these would be completely useless if there was VT as you would not see it.
Again, I am surprised by this statement. Are you losing it or something? Of course you'd see it. But what exactly is "it?" If we are talking about intense, pre-eruptive type volcanic tremor, there is no question THEY'D see it, cause they have the raw data and can do frequency content analysis, as well as N and E channel analysis. And if it was, I am sure by now they'd be evacuating the crap out of Santorini. But I see no such reports, and I don't see any coincident seismic activity that usually accompanies that type of tremor either.
And even if it was just some long period low level type tremor, they'd see that too, through all the man made noise, because of, again, frequency content analysis. Without that WE can't be sure, but we can speculate with what we've got.
In addition to be showing so much noise they must be on really sensitive settings. Pointless IMHO.
We are simply in an unfavorable position without the raw data to better comment, PM. Those sensitive settings can be beneficial when you DO have the raw data, which they do, and we don't. It appears the broadbands are low pass filtered at 3k, and they are still showing a fair amount of noise and man made activity, like at SAP2:
bbnet.gein.noa.gr...
reply to post by TrueAmerican
Then if you mean clipped say clipped and do not use jargon or slang. You are not seeing now quite what we have been seeing for the past few days, and why is that? Because the wind has dropped. It has been 15+ km/hr for days and you just happen to have arrived when it has calmed down. And by the way if you look at the trace not one single one of those is clipped. If you had seen the earlier ones you would know this as there were traces that almost covered the whole length. In fact here you are, one I posted earlier - not a clip in sight.
Perhaps you could give your opinion of this one as well? I can't see much on it, can you?
Your turn to be losing it now Low pass filtered at 3k? You would not see a darn thing. Most will low pass filter at between 2 and 6 Hz, not 3000 Hz. A very common low pass is 4.5 Hz, but not 3000 Hz. You do realise that a standard tuning fork is 440 Hz and that C8 on a piano is 4100 Hz (a bit more but I can't recall the exact figure)
That says HHZ, the channel, and the 3000 refers to the counts.
One of the problems with seismology is that what they call Hertz for the instruments is not hertz it is samples per second and that ain't the same thing. I would be extremely surprised if there was any signal above around 30 Hz that was worth looking at except perhaps for harmonics but even they would not be much higher than that, and I also seriously doubt that they are sampling at 3000 samples per second considering that most instruments sample at 100 sps, There are a few very much faster instruments but are these they? Extremely unlikely.
This post explains the difference between Hz and samples per second as applied to seismometers.
My point is that they are displaying these for the public. In that respect they are completely useless as you would not see anything. I am perfectly well aware that they can filter the data, but we cannot, and therefore at sensitive settings these seismograms are pointless - for the public. The sensitivity of the seismogram does NOT have to match the sensitivity of the instrument as I have demonstrated several times on ATS.
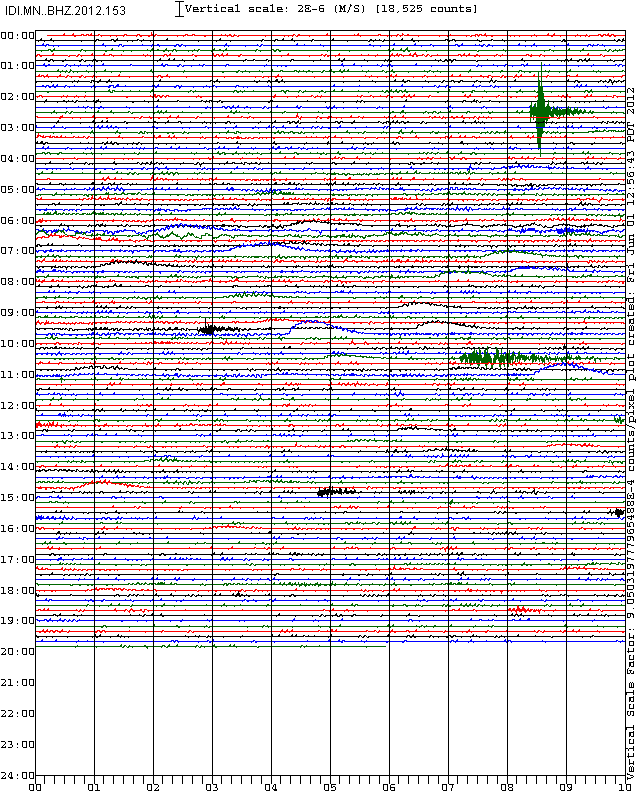
A seismo can be as presented: IDI.MN..BHZ.2012.153 or can be tweaked to make it look flat: IDI.MN..BHZ.2012.153 (Flat) or extremely 'busy': IDI.MN..BHZ.2012.153 (Scary)
Hmm, while I see periods of high noise at THR3 and at the others, for the moment those stations are anything but completely clipped (what I meant by pegged out). So I am not sure why you would make such a statement, especially with your knowledge. But it's not true, at least at the moment. You can see this by looking at other peaky signatures and seeing where the clipping point is set on their webicorder plotter settings.
Then if you mean clipped say clipped and do not use jargon or slang. You are not seeing now quite what we have been seeing for the past few days, and why is that? Because the wind has dropped. It has been 15+ km/hr for days and you just happen to have arrived when it has calmed down. And by the way if you look at the trace not one single one of those is clipped. If you had seen the earlier ones you would know this as there were traces that almost covered the whole length. In fact here you are, one I posted earlier - not a clip in sight.
Perhaps you could give your opinion of this one as well? I can't see much on it, can you?
It appears the broadbands are low pass filtered at 3k, and they are still showing a fair amount of noise and man made activity, like at SAP2:
Your turn to be losing it now Low pass filtered at 3k? You would not see a darn thing. Most will low pass filter at between 2 and 6 Hz, not 3000 Hz. A very common low pass is 4.5 Hz, but not 3000 Hz. You do realise that a standard tuning fork is 440 Hz and that C8 on a piano is 4100 Hz (a bit more but I can't recall the exact figure)
That says HHZ, the channel, and the 3000 refers to the counts.
One of the problems with seismology is that what they call Hertz for the instruments is not hertz it is samples per second and that ain't the same thing. I would be extremely surprised if there was any signal above around 30 Hz that was worth looking at except perhaps for harmonics but even they would not be much higher than that, and I also seriously doubt that they are sampling at 3000 samples per second considering that most instruments sample at 100 sps, There are a few very much faster instruments but are these they? Extremely unlikely.
This post explains the difference between Hz and samples per second as applied to seismometers.
My point is that they are displaying these for the public. In that respect they are completely useless as you would not see anything. I am perfectly well aware that they can filter the data, but we cannot, and therefore at sensitive settings these seismograms are pointless - for the public. The sensitivity of the seismogram does NOT have to match the sensitivity of the instrument as I have demonstrated several times on ATS.
A seismo can be as presented: IDI.MN..BHZ.2012.153 or can be tweaked to make it look flat: IDI.MN..BHZ.2012.153 (Flat) or extremely 'busy': IDI.MN..BHZ.2012.153 (Scary)
edit on 1/6/2012 by PuterMan because: To add information link
Originally posted by PuterMan
That says HHZ, the channel, and the 3000 refers to the counts.
Yep, I think you're right, my bad - I don't ever remember seeing max webicorder counts listed like that, so that's a new display to me... What happened to mv then and how does mv translate to counts? 3000 counts is set pretty sensitive then, and "amplifies" the waves on the webi quite a bit. Whereas 100,000 counts squishes them a lot more. I guess it just depends on what software the web host is using to plot the webicorder from the raw data as to what units are displayed. I do understand the instrument sensitivity is separate from the webicorder software that displays it, and plots it with a lot of setting options.
I also understand that without a lack of display standardization in the industry, deciphering all this is a major PITA! You really do have to be a rocket scientist. Ever since I got into counts instead of engineering units I have been rather hazy on all this. And on top of that, I am rusty- glad you're there to explain things.
One of the problems with seismology is that what they call Hertz for the instruments is not hertz it is samples per second and that ain't the same thing. I would be extremely surprised if there was any signal above around 30 Hz that was worth looking at except perhaps for harmonics but even they would not be much higher than that, and I also seriously doubt that they are sampling at 3000 samples per second considering that most instruments sample at 100 sps, There are a few very much faster instruments but are these they? Extremely unlikely.
Hard to find a network with instrument frequency response unfiltered over 25Hz. I've never seen one, since I got into spectrogram displays, anyways. And many cap at 20 Hz or 10 Hz. Now maybe these newer VBB instruments have a wider response, but I have not monitored any of those types yet, or their channels, to draw a comparison. Another thing I am curious about is if the designation "HHZ" for example is derived from the instrument itself, or from the settings used in the software to display the instrument's output.
reply to post by TrueAmerican
Well don't quote me on this but I think that there are a number of 'counts' per volt for a given instrument, which is determined by the number of bits in the comparator of the analogue digital converter. This section from a lesson about voltmeters may explain it better than me!
Source
So as I understand it the number of 'counts' is the number of intervals determined by the ADC AND by the voltage range of the instrument.
To cut a long story short you can convert from counts to mV if you know the range of the instrument. (This is actually a function of the datalogger and this may not be built in to the instrument) thus you can have a broadband sensor connected to an RefTek model RT130 datalogger (link for that one below)
You can enjoy torturing the brain cells with the wealth of information on the PASSCAL site in there you will glean this information
which sheds a bit of light on counts and how you convert between counts and mV Quanterra in their wisdom require a login to look at their instrument manuals however REF TEK, makers of the instrument I referenced above do not.
This instrument is the datalogger - the ADC and data storage and as you can see the number of counts is different from the Q330.
I guess if you are in the business it makes a bit more sense (but I doubt it!) but it scrambles my brain!
Phew! Something easier to answer!
I will be totally lazy and direct you to my page on types of seismometer. On there you will find a link to IRIS which has a full description of the naming..
To answer your question it is not connected to the display but rather to the characteristics of a combination of the sensor and the other instrumentation thus HHZ is a High broadband instrument >80 samples per second from a High gain seismometer that is oriented to record the vertical movement. HNZ is the same except it is an accelerometer. I find the first letter the most useful as it gives and instant idea of the likely sample range of the instrument.
What happened to mv then and how does mv translate to counts?
Well don't quote me on this but I think that there are a number of 'counts' per volt for a given instrument, which is determined by the number of bits in the comparator of the analogue digital converter. This section from a lesson about voltmeters may explain it better than me!
E1 Consider a voltmeter built around a 10 bit A/D converter. We will assume the following.
The range of the voltmeter is from 0-3v, and it does DC voltage measurements. It does not measure negative voltages.
Then, with 10 bits we can draw these inferences.
Ten bits will produce 210 intervals. That's 1024 intervals.
If there are 1024 intervals over a range of 3v, each interval will be 3/1024 = .00293v.
It is easier to compute the displayed voltage if the interval is adjusted to .003v.
That would make the range 0-3.072v. (That's .003 x 1024.)
If you are measuring a voltage that varies around 3v, that would allow you to keep the range the same, but still change the range (if the instrument also has a 0-30v range, for instance) when the voltage got large enough. Manufacturers like to build in a little "hysteresis" to prevent constant range changes in situations like that and it might be especially hard on auto-ranging meters.
If you wanted to measure negative voltages and have the range be from -3v to +3v, you would have intervals of .006v, and the meter would measure from -3.072v to +3.072v.
If you wanted to measure voltages on a 0-30v scale, you would probably use a voltage divider or some other way to reduce the voltage by a factor of (exactly) 10 (i.e., multiply it by exactly 0.1) and then use the same converter as on the 0-3v scale.
If we could use a 12 bit A/D, then some conclusions would change.
Twelve bits will produce 212 intervals. That's 4096 intervals.
If there are 4096 intervals over a range of 3v, each interval will be 3/4096 = .000732v.
It is easier to compute the displayed voltage if the interval is adjusted to .0075v.
That would make the range 0-3.072v - just as it was in the case of the 10 bit converter,
That produces the same advantages as you had with the 10 bit converter.
If you wanted to measure negative voltages and have the range be from -3v to +3v, you would have intervals of .0015v, and the meter would measure from -3.072v to +3.072v.
Source
So as I understand it the number of 'counts' is the number of intervals determined by the ADC AND by the voltage range of the instrument.
To cut a long story short you can convert from counts to mV if you know the range of the instrument. (This is actually a function of the datalogger and this may not be built in to the instrument) thus you can have a broadband sensor connected to an RefTek model RT130 datalogger (link for that one below)
You can enjoy torturing the brain cells with the wealth of information on the PASSCAL site in there you will glean this information
Quanterra model Q330: 419,430 counts/volt, or 2.384 uV/count at a Gain of 1
which sheds a bit of light on counts and how you convert between counts and mV Quanterra in their wisdom require a login to look at their instrument manuals however REF TEK, makers of the instrument I referenced above do not.
RefTek model RT130: 629,327 counts/volt, or 1.58997 uV/count at a Gain of 1
This instrument is the datalogger - the ADC and data storage and as you can see the number of counts is different from the Q330.
I guess if you are in the business it makes a bit more sense (but I doubt it!) but it scrambles my brain!
Another thing I am curious about is if the designation "HHZ" for example is derived from the instrument itself, or from the settings used in the software to display the instrument's output.
Phew! Something easier to answer!
I will be totally lazy and direct you to my page on types of seismometer. On there you will find a link to IRIS which has a full description of the naming..
To answer your question it is not connected to the display but rather to the characteristics of a combination of the sensor and the other instrumentation thus HHZ is a High broadband instrument >80 samples per second from a High gain seismometer that is oriented to record the vertical movement. HNZ is the same except it is an accelerometer. I find the first letter the most useful as it gives and instant idea of the likely sample range of the instrument.
reply to post by PuterMan
Puterman can i just say a couple of things here but please please please dont take this the wrong way.
I am sure that there are many like me on here who havent got as much knowledge as you regarding the technical terms you post.
Is there any chance you can simplify your replies please. Some of the terms you use go way over my head, i am not taking the piss but i feel that more would find your posts and replies of greater benefit if they understood your terms.
Your posts are informative and educational but hey i aint no scientist but simplify please.
I happen to think thats also the reason why we are struggling globally in general because we are making everything more complicated that it needs to be.
I sincerely hope you are not offended as i think you are an asset to ATS i am just sharing my opinion. Please take this as its meant.
TO ADD
Do you have a blog? If not i would consider doing one. I would happily allow my kids to use it as a tool for their education.
edit on 2-6-2012
by jazz10 because: (no reason given)
update to post by PuterMan because I found something interesting
I just found a PDF file by USGS about the STS2 seismometer and it illustrates what I was trying to say as far as connecting a sensor to a digitiser is concerned.
The document is titled "An Assessment of the High-gain Streckeisen STS2 Seismometer for Routine Earthquake Monitoring in the United States"
PDF download (depending on your browser you can save that direct to disk)
Well worth a complete read through as it gives some useful insights. (I wish I had found this a while ago)
reply to post by jazz10
To be fair to myself that was directed specifically at True American who should understand it. Perhaps I should have replied by u2u rather than making people go cross eyed!
You are not wrong there. I do try generally to explain this more simply, but sometimes it is not possible.
No problem and of course I am not offended. You are quite right to say if you think that a discussion is way above the heads of people and therefore not contributing anything. In this instance as I said it was specifically for TA.
I have several blogs but they are not of the newsy type. They are general blogs for earthquake information, volcano information and a bit of Solar and weather.
If you start at Quake and Volcano links in my signature and work your way out from there. QVS Data has more of the learning elements whereas Quake Watch, Volcano Watch are reporting sites as is Earthquake Reports (Not the site by that name). Solar Watch has some of the more way out theories such as the Electric Universe but none of these are in depth complicated posts.
Puterman can i just say a couple of things here but please please please dont take this the wrong way.
I am sure that there are many like me on here who havent got as much knowledge as you regarding the technical terms you post.
Is there any chance you can simplify your replies please. Some of the terms you use go way over my head, i am not taking the piss but i feel that more would find your posts and replies of greater benefit if they understood your terms.
Your posts are informative and educational but hey i aint no scientist but simplify please.
To be fair to myself that was directed specifically at True American who should understand it. Perhaps I should have replied by u2u rather than making people go cross eyed!
I happen to think thats also the reason why we are struggling globally in general because we are making everything more complicated that it needs to be.
You are not wrong there. I do try generally to explain this more simply, but sometimes it is not possible.
I sincerely hope you are not offended as i think you are an asset to ATS i am just sharing my opinion. Please take this as its meant.
No problem and of course I am not offended. You are quite right to say if you think that a discussion is way above the heads of people and therefore not contributing anything. In this instance as I said it was specifically for TA.
TO ADD
Do you have a blog? If not i would consider doing one. I would happily allow my kids to use it as a tool for their education.
I have several blogs but they are not of the newsy type. They are general blogs for earthquake information, volcano information and a bit of Solar and weather.
If you start at Quake and Volcano links in my signature and work your way out from there. QVS Data has more of the learning elements whereas Quake Watch, Volcano Watch are reporting sites as is Earthquake Reports (Not the site by that name). Solar Watch has some of the more way out theories such as the Electric Universe but none of these are in depth complicated posts.
lol, I realize what a bone-headed statement that was for me to suggest a low pass filter at 3K. I don't even know WHAT I was thinking, as that is so
far off base, it makes me feel like a total noob all over again. All I had to do was recall my own experience with spectrograms to know that was
idiotic. :shk: Oh well. Typical me. If I get away from this stuff for a while, as I have been, different compartmentalized elements of the technical
knowledge fade away, leaving gaps in brain logic assembly- and thus cause errors in assimilation as I made above.
It takes a razor sharp mind armed with a vast array of technical knowledge of instruments, peripherals, and measurement systems to REALLY understand seismology to its core. I remain on the periphery, and envious of the few people that can debate the merits of one system over another from a deep technical standpoint. Nonetheless, I still maintain that Santorini remains seismically quiet, and is not an imminent threat unless things change.
It takes a razor sharp mind armed with a vast array of technical knowledge of instruments, peripherals, and measurement systems to REALLY understand seismology to its core. I remain on the periphery, and envious of the few people that can debate the merits of one system over another from a deep technical standpoint. Nonetheless, I still maintain that Santorini remains seismically quiet, and is not an imminent threat unless things change.
reply to post by TrueAmerican
You are sounding like the Borg. Bet you don't look anything like Seven of Nine, Tertiary Adjunct of Unimatrix Zero-One.
I do not disagree, hence the thread title. Coming on all that mess it was not easy to sort out what was going on.
If I get away from this stuff for a while, as I have been, different compartmentalized elements of the technical knowledge fade away, leaving gaps in brain logic assembly- and thus cause errors in assimilation as I made above.
You are sounding like the Borg. Bet you don't look anything like Seven of Nine, Tertiary Adjunct of Unimatrix Zero-One.
I still maintain that Santorini remains seismically quiet, and is not an imminent threat unless things change.
I do not disagree, hence the thread title. Coming on all that mess it was not easy to sort out what was going on.
new topics
-
whistleblower Captain Bill Uhouse on the Kingman UFO recovery
Aliens and UFOs: 3 hours ago -
1980s Arcade
General Chit Chat: 5 hours ago -
Deadpool and Wolverine
Movies: 6 hours ago -
Teenager makes chess history becoming the youngest challenger for the world championship crown
Other Current Events: 7 hours ago -
CIA botched its handling of sexual assault allegations, House intel report says
Breaking Alternative News: 8 hours ago -
Lawsuit Seeks to ‘Ban the Jab’ in Florida
Diseases and Pandemics: 10 hours ago
top topics
-
Lawsuit Seeks to ‘Ban the Jab’ in Florida
Diseases and Pandemics: 10 hours ago, 20 flags -
Starburst galaxy M82 - Webb Vs Hubble
Space Exploration: 12 hours ago, 12 flags -
CIA botched its handling of sexual assault allegations, House intel report says
Breaking Alternative News: 8 hours ago, 8 flags -
The Superstition of Full Moons Filling Hospitals Turns Out To Be True!
Medical Issues & Conspiracies: 14 hours ago, 8 flags -
IDF Intel Chief Resigns Over Hamas attack
Middle East Issues: 17 hours ago, 6 flags -
whistleblower Captain Bill Uhouse on the Kingman UFO recovery
Aliens and UFOs: 3 hours ago, 6 flags -
15 Unhealthiest Sodas On The Market
Health & Wellness: 12 hours ago, 5 flags -
Teenager makes chess history becoming the youngest challenger for the world championship crown
Other Current Events: 7 hours ago, 3 flags -
Deadpool and Wolverine
Movies: 6 hours ago, 3 flags -
1980s Arcade
General Chit Chat: 5 hours ago, 3 flags
active topics
-
How ageing is" immune deficiency"
Medical Issues & Conspiracies • 26 • : RookQueen2 -
The Democrats Take Control the House - Look what happened while you were sleeping
US Political Madness • 105 • : SchrodingersRat -
Starburst galaxy M82 - Webb Vs Hubble
Space Exploration • 4 • : SchrodingersRat -
Non-Human Operate Within The Visual Spectrum 'We Cannot See' - ULTRATERRESTRIALS EXIST!
Paranormal Studies • 136 • : burritocat -
New whistleblower Jason Sands speaks on Twitter Spaces last night.
Aliens and UFOs • 39 • : RookQueen2 -
23,000 Dead People Registered Within a Two Week Period In One State
US Political Madness • 39 • : Audreagassulke -
1980s Arcade
General Chit Chat • 7 • : Freeborn -
Europe declares war on Russia?
World War Three • 59 • : Freeborn -
George Knapp AMA on DI
Area 51 and other Facilities • 38 • : theshadowknows -
Candidate TRUMP Now Has Crazy Judge JUAN MERCHAN After Him - The Stormy Daniels Hush-Money Case.
Political Conspiracies • 618 • : WeMustCare