It looks like you're using an Ad Blocker.
Please white-list or disable AboveTopSecret.com in your ad-blocking tool.
Thank you.
Some features of ATS will be disabled while you continue to use an ad-blocker.

Arctic sea ice loss tied to unusual jet stream patterns
page: 113
share:
This is from a blog post by Dr. Jeff Masters of Weather Underground and it relates a couple of recent studies
regarding the Arctic Sea Ice summer melt. The information within the post says nothing as to what may be causing the higher than average melt, but it
does draw some interesting conclusions and explains the odd weather phenomena we have recently experienced (mild winter in the US and extreme cold in
Europe) quite well:
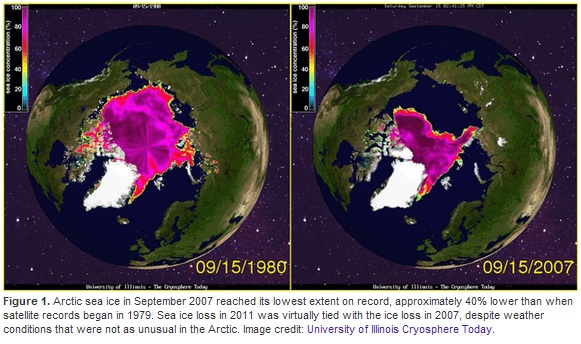
Image source: Cryosphere Today
According to the post, the melt in 2007 was even more extreme than the most recent summer, but weather patterns have been affected nearly as much.
This explains perfectly why the US had such a mild winter while Europe experienced record setting snow storms. If the Jet Stream acts as a sort of "fence" for air masses, and it gets stuck in position for extended periods of time, then anything on the "warm" side of the fence will remain warm, while anything on the 'cold' side will experience that end of the spectrum.
Here again we see that persistent weather patterns are tied back to the melting of the Arctic Sea Ice and as we all know the evidence of those persistent weather patterns were demonstrated this most recent winter.
The opening sentence in the above reference quote would seem to be counter-intuitive, but we can't deny the evidence of the most recent winter.
As with anything dealing with weather, there are a multitude of variables which have to be considered. and even when you think you've got them all accounted for you can almost guarantee that there will be others which don't seem to be applicable, but probably are in some as yet unknown way.
Related ATS threads:
Will We Have a Winter This Year??
Winter 2012- Most Extreme Configuration of the Jet Stream Ever Recorded
Europe and US Be Aware - Winter Is Returning...
(note: links within external quotes above are formatted for ATS forum code)
Earth has seen some highly unusual weather patterns over the past three years, and three new studies published this year point to Arctic sea loss as a potential important driver of some of these strange weather patterns. The record loss of sea ice the Arctic in recent years may be increasing winter cold surges and snowfall in Europe and North America, says a study by a research team led by Georgia Institute of Technology scientists Jiping Liu and Judith Curry. The paper, titled "Impact of declining Arctic sea ice on winter snowfall", was published on Feb. 27, 2012 in the online early edition of the journal Proceedings of the National Academy of Sciences.
Image source: Cryosphere Today
According to the post, the melt in 2007 was even more extreme than the most recent summer, but weather patterns have been affected nearly as much.
Summertime Arctic sea ice loss: 40% since 1980
The Arctic has seen a stunning amount of sea ice loss in recent years, due to melting and unfavorable winds that have pushed large amounts of ice out of the region. Forty percent of the sea ice was missing in September 2007, compared to September of 1980. ... The Georgia Tech study found that Arctic sea ice loss had caused a 20 - 60% weakening of the west-to-east belt of winds circling the pole in recent years, producing broader meanders in the jet stream that allowed it to get "stuck" in place 20 - 60% more often. When the jet stream gets stuck in place for a long period of time, we say a "blocking pattern" has set up. ... Such a blocking pattern began on January 26, 2012 and lasted until February 11, bringing and exceptionally cold and snowy conditions to much of Europe, which lay on the cold side of an elongated loop of the jet stream that got stuck in place. Conversely, most of North America and northern Siberia saw unusually warm temperatures during this period, since they were on the warm side of the jet stream.
This explains perfectly why the US had such a mild winter while Europe experienced record setting snow storms. If the Jet Stream acts as a sort of "fence" for air masses, and it gets stuck in position for extended periods of time, then anything on the "warm" side of the fence will remain warm, while anything on the 'cold' side will experience that end of the spectrum.
emphasis mine
Two other studies link Arctic sea ice loss to atmospheric circulation changes
"The question is not whether sea ice loss is affecting the large-scale atmospheric circulation...it's how can it not?" That was the take-home message from Dr. Jennifer Francis of Rutgers University, in her talk "Evidence Linking Arctic Amplification to Extreme Weather in Mid-latitudes, presented at December's American Geophysical Union meeting in San Francisco. Dr. Francis presented new research that has just been published in the journal Geophysical Research Letters, which shows that Arctic sea ice loss may significantly affect the upper-level atmospheric circulation, slowing its winds and increasing its tendency to make contorted high-amplitude loops. High-amplitude loops in the upper level wind pattern (and associated jet stream) increases the probability of persistent weather patterns in the Northern Hemisphere, potentially leading to extreme weather due to longer-duration cold spells, snow events, heat waves, flooding events, and drought conditions. Dr. Francis describes her work in a March 5, 2012 post on the Yale environment360 web site.
Here again we see that persistent weather patterns are tied back to the melting of the Arctic Sea Ice and as we all know the evidence of those persistent weather patterns were demonstrated this most recent winter.
"Even if the current weather situation may seem to speak against it, the probability of cold winters with much snow in Central Europe rises when the Arctic is covered by less sea ice in summer." That was the opening sentence of a January 26, 2012 press release by a group of European scientists, led by Ralf Jaiser of the Alfred Wegener Institute in Germany.
The opening sentence in the above reference quote would seem to be counter-intuitive, but we can't deny the evidence of the most recent winter.
Why was the winter of 2011 - 2012 so warm in the U.S.?
The winter of 2011 - 2012 in North America was unusually warm--the fourth warmest on record. The cold air spilling out of the Arctic during the winter was confined to Europe, unlike that previous two winters, which were unusually cold and snowy in the Eastern U.S. Obviously, loss of Arctic sea ice is not having the same impact each winter; such factors as El Niño/La Niña, the phase of the 11-year sunspot cycle, and the amount of snow cover in Siberia also have strong influences on the winter weather pattern that sets up. Cold air is less likely to spill out of the Arctic during a solar maximum, as we are now headed towards, so this factor may tend to reduce the odds of getting big cold blasts in the U.S. during the coming two winters. However, cold air may be more likely to spill out of the Arctic in winter due to the decades-long pattern of warming and cooling of Atlantic Ocean waters known as the Atlantic Multidecadal Oscillation (AMO). A 2012 study by NASA scientists found that the warm phase of the AMO (like we have been in since 1995) causes more instances of atmospheric blocking, where the jet stream gets "stuck" in place, leading to long periods of extreme weather
As with anything dealing with weather, there are a multitude of variables which have to be considered. and even when you think you've got them all accounted for you can almost guarantee that there will be others which don't seem to be applicable, but probably are in some as yet unknown way.
Related ATS threads:
Will We Have a Winter This Year??
Winter 2012- Most Extreme Configuration of the Jet Stream Ever Recorded
Europe and US Be Aware - Winter Is Returning...
(note: links within external quotes above are formatted for ATS forum code)
Good thread, but you are missing the most obvious element in all this. What is driving the ice loss in the arctic? Manmade global warming is the
answer, and has the science to prove it unequivocally. So these new findings paint an even worse scenario for us all. How bad are our winters going to
get when the arctic is ice free in the summer months (as it is predicted to be by as early as 2030).?
very interesting stuff!!! so does this means that we will countinue to see weather patterns like this until the sea ice and can build back up this
coming winter??
reply to post by Atzil321
I did mention that the blog post does not go in to causation for this phenomena, and while I do think there are some anthropogenic factors I do not think that those are the sole contributing elements in the overall equation.
As to whether or not you will continue to experience harsher winters, that depends on the blocking patern which is in place. You could easily experience a blocking pattern in which you end up on the "warm" side of the jet stream that would eventuate in a more mild winter on your side of the pond.
reply to post by RN311
Looking at the graphs on the Cryosphere Today shows some interesting data.
This is the Current Northern Hemisphere Sea Ice Area:
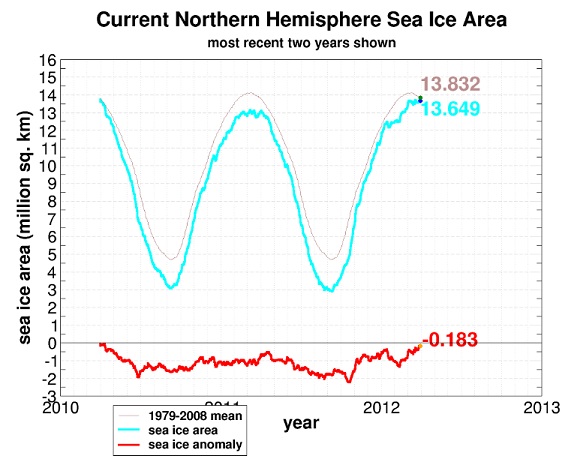
You can see that the current two year trend is below the 1979-2008 mean and the anomalous levels are currently .138 million sq. kilometers below the mean.
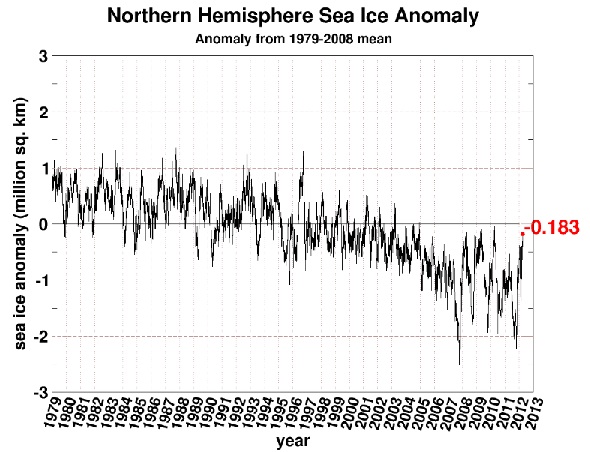
Indeed, if you look at the Northern Hemisphere Sea Ice Anomaloy graph (which shows data from 1979-2012), you will see that thee is a distinct downward trend beginning in the early 2000's:
Now taking a look at the graphe for the Current Southern Hemisphere Sea Ice Area, we find something just as interesting.
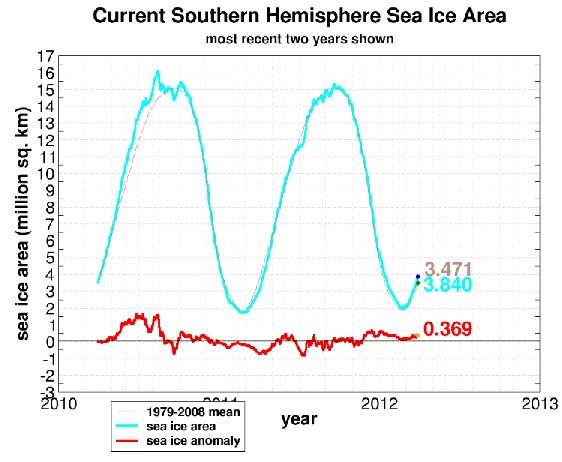
The current anomaly is .369 million sq. kilometers above the 1979-2008 mean.
This shows that for every 1 sq. kilometer below mean in the Northern Hemisphere, the Southern Hemisphere is 2.67 sq. kilometers above the mean.
So looking at the Southern Hemisphere Sea Ice Anomaly graph, we see a slight upward trend for the same time period in which the Northern Sea Ice Anomalygraph shows a downturn:
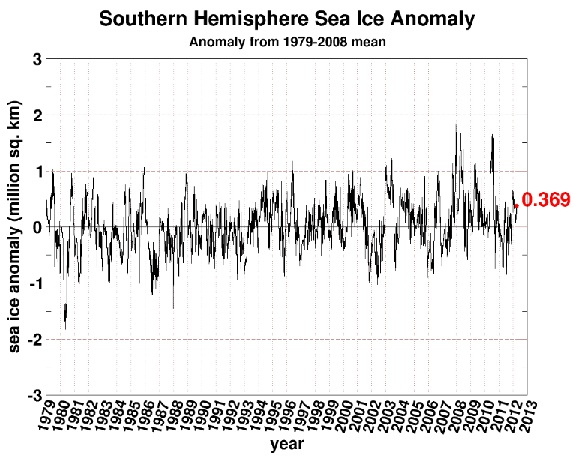
It would seem as though the Northern and Southern Hemipsheres are balancing each other out, and not necessarily in equal amounts as the above difference shows.
I did mention that the blog post does not go in to causation for this phenomena, and while I do think there are some anthropogenic factors I do not think that those are the sole contributing elements in the overall equation.
As to whether or not you will continue to experience harsher winters, that depends on the blocking patern which is in place. You could easily experience a blocking pattern in which you end up on the "warm" side of the jet stream that would eventuate in a more mild winter on your side of the pond.
reply to post by RN311
Looking at the graphs on the Cryosphere Today shows some interesting data.
This is the Current Northern Hemisphere Sea Ice Area:
You can see that the current two year trend is below the 1979-2008 mean and the anomalous levels are currently .138 million sq. kilometers below the mean.
Indeed, if you look at the Northern Hemisphere Sea Ice Anomaloy graph (which shows data from 1979-2012), you will see that thee is a distinct downward trend beginning in the early 2000's:
Now taking a look at the graphe for the Current Southern Hemisphere Sea Ice Area, we find something just as interesting.
The current anomaly is .369 million sq. kilometers above the 1979-2008 mean.
This shows that for every 1 sq. kilometer below mean in the Northern Hemisphere, the Southern Hemisphere is 2.67 sq. kilometers above the mean.
So looking at the Southern Hemisphere Sea Ice Anomaly graph, we see a slight upward trend for the same time period in which the Northern Sea Ice Anomalygraph shows a downturn:
It would seem as though the Northern and Southern Hemipsheres are balancing each other out, and not necessarily in equal amounts as the above difference shows.
Sea ice coverage is not the primary concern in antarctica for various reasons. The thickness of the land locked ice is used to determine the overall
health of the system down there. Data shows that while the sea ice may have grown in area, it is also thinning at an alarming rate on land.
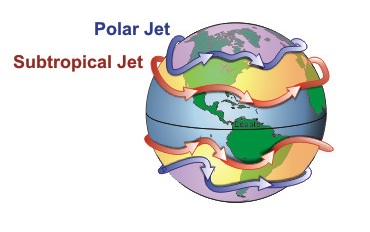
another question is there a jet stream that sort of a "twin" to the one in the northern hemisphere down in the souther hemisphere. And if there is,
is it behaving "normally" or is it also stalling? I guess from the above info I would guess if there is one (i know nothing about this stuff) it is
behaving normally since there's no dramatic change in sea ice there. now also aren't they having some wacky weather down in aussie land and fiji as
well? can you make any guesses about wether any change in the jet stream down there (if there is one) could be causing these as well? sorry if this
seems a little rambling I just find this sort of stuff very interesting and don't have alot of time to do much research on my own thanks in
advance!!!
Just to let you know the last time the artic was free of ice it altered the flow of the gulf stream and an iceage occured within 100years.
en.wikipedia.org...
en.wikipedia.org...
reply to post by RN311
Didn't take a lot of time at all actually, a quick look at WIkipedia found this entry:
reply to post by Atzil321
Good point. With that in mind, I have found the following:
This is a model based upon observed data and it is generated through a variety of source parameters. New versions are updated regularly and with each successive iteration, accuracy improves.
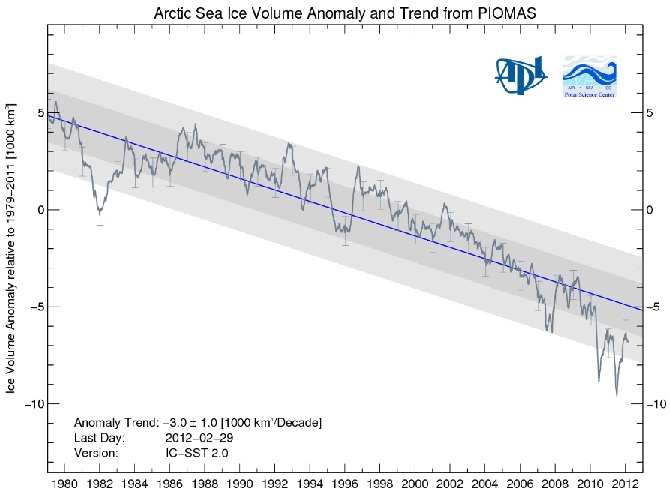
This shows a clear downward trend, again that seems to increase in the early 2000's.
The year over year trend is as follows:
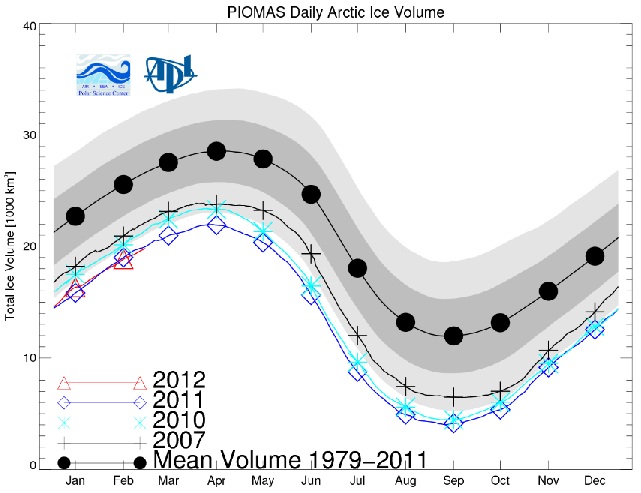
2012 and 2011 volumes, so far, are very closely parallel.
Thinking about this we look at the solar cycle:
And of course there is the correlation to volcanic activity:
Point being there are a host of factors which are far greater than human activity that have measurable effects on climate. Again, not to say that there are no human causative agents in driving climate change (which has always been in a state of flux) but thoe anthropogenic factors also have to be compared to these other factors which are far and above not within our realm of control.
Didn't take a lot of time at all actually, a quick look at WIkipedia found this entry:
The Northern Hemisphere and the Southern Hemisphere each have both a polar jet and a subtropical jet. The northern hemisphere polar jet flows over the middle to northern latitudes of North America, Europe, and Asia and their intervening oceans, while the southern hemisphere polar jet mostly circles Antarctica all year round.
reply to post by Atzil321
Good point. With that in mind, I have found the following:
Sea ice volume is an important climate indicator. It depends on both ice thickness and extent and therefore more directly tied to climate forcing than extent alone. However, Arctic sea ice volume cannot currently be observed continuously. Observations from satellites, Navy submarines, moorings, and field measurements are all limited in space and time. ...
This time series of ice volume is generated with an updated version of PIOMAS (June-15,2011). This updated version improves on prior versions by assimilating sea surface temperatures (SST) for ice-free areas and by using a different parameterization for the strength of the ice. Comparisons of PIOMAS estimates with ice thickness observations show reduced errors over the prior version. The long term trend is reduced to about -2.8 103 km3/decade from -3.6 km3 103/decade in the last version.
This is a model based upon observed data and it is generated through a variety of source parameters. New versions are updated regularly and with each successive iteration, accuracy improves.
This shows a clear downward trend, again that seems to increase in the early 2000's.
emphasis mine
It takes energy to melt sea ice. How much energy? The energy required to melt the 16,400 Km3 of ice that are lost every year (1979-2010 average) from April to September as part of the natural annual cycle is about 5 x 10^21 Joules. For comparison, the U.S. Energy consumption for 2009 (www.eia.gov/totalenergy) was about 1 x 10^20 J. So it takes about the 50 times the annual U.S. energy consumption to melt this much ice every year. This energy comes from the change in the distribution of solar radiation as the earth rotates around the sun.
To melt the additional 280 km3 of sea ice, the amount we have have been losing on an annual basis based on PIOMAS calculations, it takes roughly 8.6 x 10^19 J or 86% of U.S. energy consumption.
The year over year trend is as follows:
2012 and 2011 volumes, so far, are very closely parallel.
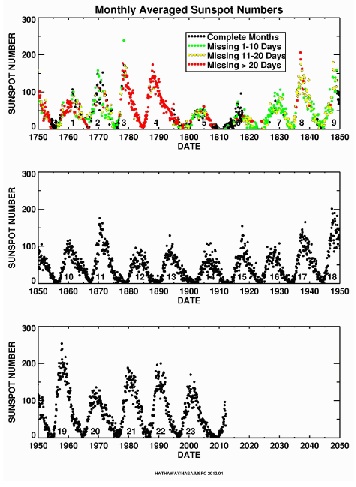
Thinking about this we look at the solar cycle:
In 1610, shortly after viewing the sun with his new telescope, Galileo Galilei (or was it Thomas Harriot?) made the first European observations of Sunspots. Continuous daily observations were started at the Zurich Observatory in 1849 and earlier observations have been used to extend the records back to 1610. The sunspot number is calculated by first counting the number of sunspot groups and then the number of individual sunspots.
Early records of sunspots indicate that the Sun went through a period of inactivity in the late 17th century. Very few sunspots were seen on the Sun from about 1645 to 1715 (38 kb JPEG image). Although the observations were not as extensive as in later years, the Sun was in fact well observed during this time and this lack of sunspots is well documented. This period of solar inactivity also corresponds to a climatic period called the "Little Ice Age" when rivers that are normally ice-free froze and snow fields remained year-round at lower altitudes. There is evidence that the Sun has had similar periods of inactivity in the more distant past.
And of course there is the correlation to volcanic activity:
ScienceDaily (Jan. 30, 2012) — A new international study may answer contentious questions about the onset and persistence of Earth's Little Ice Age, a period of widespread cooling that lasted for hundreds of years until the late 19th century.
Point being there are a host of factors which are far greater than human activity that have measurable effects on climate. Again, not to say that there are no human causative agents in driving climate change (which has always been in a state of flux) but thoe anthropogenic factors also have to be compared to these other factors which are far and above not within our realm of control.
reply to post by jadedANDcynical
What loss of Arctic Sea ice? It's at a seven year high.
Source< br />
We do lose alot of ice during summer, but seem to be gaining thru winter. I just don't think we have enough data to really know the big picture. I think this comment below sums it up:
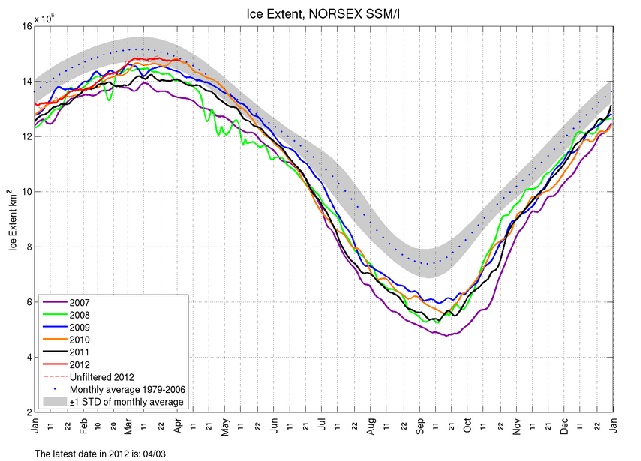
What loss of Arctic Sea ice? It's at a seven year high.
Arctic sea ice on the rise, year's ice extent is highest since 2006, according to NORSEX SSM/I data
Source< br />
Good news from the Arctic. Sea ice extent (area covered by ice greater than 15%*) is at a seven-year high (See NORSEX SSM/I ). It’s nearly back to within one standard deviation of the 30 year normal at 14.5 million square kilometers.
This year's ice extent is the highest since 2006 at this point in the year.
Temperatures in the arctic remain well below freezing and should remain there through March. So, more ice should be added in the next few weeks. We are nearing the peak of sea ice in the Northern Hemisphere. Once April roles around, warmer temperatures will move north from the equator. That's when ice extent will begin its yearly decline toward mid-summer
We do lose alot of ice during summer, but seem to be gaining thru winter. I just don't think we have enough data to really know the big picture. I think this comment below sums it up:
A lot has been made of disappearing Arctic sea ice and the prospects of ice-free summers due to global warming. But, let’s put that into perspective. The problem with much of this debate is the fact that accurate ice measurements go back only a few decades. Satellite measurements date back only to 1979 for Arctic sea ice, so accurate data is barely 30 years old. So, what was the state of Arctic sea ice before then? We just don't know.
edit on 3-4-2012 by isyeye because: (no reason given)
reply to post by isyeye
You won't get any argument from me on that. And I think if you look at the graphs I have posted, you will see an increase since 2007 which does seem to be a low tide marker in ice coverage, even from the site quoted in the story you referenced:
And if you take a look further at the site Arctic Regional Ocean Observing System, you will find a host of graphs which also show a steady downward trend, for example:
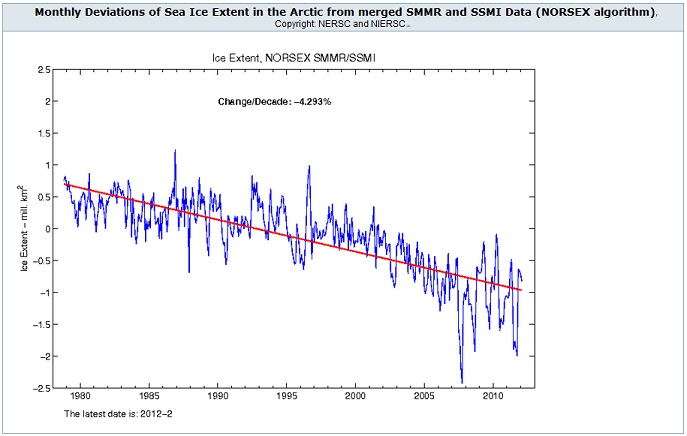
Just to pull one graph from the page.
It clearly shows a decrease of -4.293% from it's beginning point in 1979.
Again, I agree with you in that this is a very short amount of time in which to look for patterns in a system that has been operating for billions of years.
My purpose in creating this thread was to have a discussion about possible underlying causes for the odd winter we recently experienced.
I just don't think we have enough data to really know the big picture.
You won't get any argument from me on that. And I think if you look at the graphs I have posted, you will see an increase since 2007 which does seem to be a low tide marker in ice coverage, even from the site quoted in the story you referenced:
And if you take a look further at the site Arctic Regional Ocean Observing System, you will find a host of graphs which also show a steady downward trend, for example:
Just to pull one graph from the page.
It clearly shows a decrease of -4.293% from it's beginning point in 1979.
Again, I agree with you in that this is a very short amount of time in which to look for patterns in a system that has been operating for billions of years.
My purpose in creating this thread was to have a discussion about possible underlying causes for the odd winter we recently experienced.
new topics
-
Is the origin for the Eye of Horus the pineal gland?
General Conspiracies: 57 minutes ago -
Man sets himself on fire outside Donald Trump trial
Mainstream News: 1 hours ago -
Biden says little kids flip him the bird all the time.
2024 Elections: 1 hours ago -
The Democrats Take Control the House - Look what happened while you were sleeping
US Political Madness: 1 hours ago -
Sheetz facing racial discrimination lawsuit for considering criminal history in hiring
Social Issues and Civil Unrest: 1 hours ago -
In an Historic First, In N Out Burger Permanently Closes a Location
Mainstream News: 3 hours ago -
MH370 Again....
Disaster Conspiracies: 4 hours ago -
Are you ready for the return of Jesus Christ? Have you been cleansed by His blood?
Religion, Faith, And Theology: 6 hours ago -
Chronological time line of open source information
History: 7 hours ago -
A man of the people
Diseases and Pandemics: 9 hours ago
top topics
-
Israeli Missile Strikes in Iran, Explosions in Syria + Iraq
World War Three: 17 hours ago, 19 flags -
In an Historic First, In N Out Burger Permanently Closes a Location
Mainstream News: 3 hours ago, 14 flags -
The Democrats Take Control the House - Look what happened while you were sleeping
US Political Madness: 1 hours ago, 8 flags -
Thousands Of Young Ukrainian Men Trying To Flee The Country To Avoid Conscription And The War
Other Current Events: 14 hours ago, 7 flags -
Iran launches Retalliation Strike 4.18.24
World War Three: 17 hours ago, 6 flags -
12 jurors selected in Trump criminal trial
US Political Madness: 17 hours ago, 4 flags -
4 plans of US elites to defeat Russia
New World Order: 11 hours ago, 4 flags -
A man of the people
Diseases and Pandemics: 9 hours ago, 4 flags -
Man sets himself on fire outside Donald Trump trial
Mainstream News: 1 hours ago, 4 flags -
Biden says little kids flip him the bird all the time.
2024 Elections: 1 hours ago, 3 flags
active topics
-
Man sets himself on fire outside Donald Trump trial
Mainstream News • 11 • : chiefsmom -
4 plans of US elites to defeat Russia
New World Order • 35 • : Oldcarpy2 -
12 jurors selected in Trump criminal trial
US Political Madness • 74 • : Xtrozero -
George Knapp AMA on DI
Area 51 and other Facilities • 26 • : nerbot -
Sheetz facing racial discrimination lawsuit for considering criminal history in hiring
Social Issues and Civil Unrest • 6 • : chiefsmom -
Is the origin for the Eye of Horus the pineal gland?
General Conspiracies • 1 • : ARM19688 -
Thousands Of Young Ukrainian Men Trying To Flee The Country To Avoid Conscription And The War
Other Current Events • 25 • : twistedpuppy -
Silent Moments --In Memory of Beloved Member TDDA
Short Stories • 46 • : Encia22 -
The Democrats Take Control the House - Look what happened while you were sleeping
US Political Madness • 15 • : matafuchs -
Are you ready for the return of Jesus Christ? Have you been cleansed by His blood?
Religion, Faith, And Theology • 17 • : TheValeyard
13