It looks like you're using an Ad Blocker.
Please white-list or disable AboveTopSecret.com in your ad-blocking tool.
Thank you.
Some features of ATS will be disabled while you continue to use an ad-blocker.

2012 Pole Shift Data Coverup?
page: 111
share:

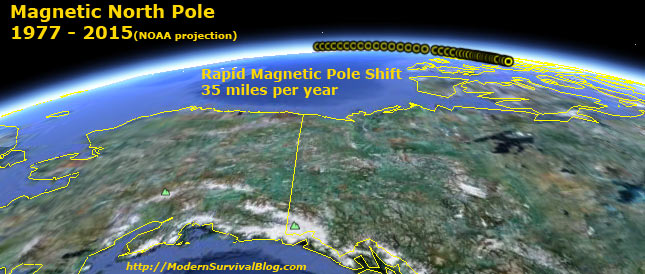
The NOAA National Geophysical Data Center has updated (revised – massaged) their magnetic north pole-shift positional data and has projected the location of the pole through 2015. The pole shift, if you will, continues to race along in the same direction since it dramatically accelerated back in the mid 1990′s. But…
NOAA made some significant and apparently linear changes to the pole location data going back to the years 2001 through 2010. The most noticeable result of the changes that they made was an overall linear slow down of the shift during the past decade, although still currently high at 30 miles per year. They have projected positional data through 2015 and have slowed the pace of movement each subsequent year from 30 miles (2012) to 24 miles (2015).
No apparent reason for the change was listed. A 10 year change nonetheless! Given the fact that they suddenly changed their previously posted data of the previous decade to indicate a slower pole-shift progression, they are now able to project a slowing trend through 2015. If it were not for changing their own data, they would not have been able to project this trend through 2015. It is beginning to look like the USGS, who when they change their earthquake magnitude numbers, they always (95% of the time) revise them downward. The revisions made are always in a ‘less alarming’ direction.
The following map shows the position of the magnetic north pole, and its shift since 1977. Read here for the past 400 years of magnetic north pole shift. Clearly it can be seen where the annual pole location begins to spread during the mid 1990′s when the acceleration rapidly increased.
globalrumblings.blogspot.com...
The following image plot shows the comparison between the original magnetic north pole locations and now the new revised locations (2001 onward) from NOAA (National Oceanic and Atmospheric Administration).
previous NOAA data revised NOAA data
Latitude Longitude year Latitude Longitude
80.815 -109.568 2001 80.772 -109.478
81.268 -110.89 2002 81.225 -110.807
81.714 -112.344 2003 81.67 -112.268
82.193 -114.095 2004 82.149 -114.026
82.623 -115.892 2005 82.578 -115.83
83.127 -118.178 2006 82.996 -117.828
83.579 -120.578 2007 83.443 -120.273
83.981 -123.067 2008 83.838 -122.814
84.37 -125.881 2009 84.218 -125.681
84.742 -129.077 2010 84.548 -128.62
2011 84.86 -131.91
2012 85.154 -135.594
2013 85.396 -139.28
2014 85.618 -143.339
2015 85.791 -147.26
Source: www.ngdc.noaa.gov...
Side Note...
Note this author does not know for certain if NOAA themselves changed the numbers, or if the data set is from another source prior to NOAA processing. We also do not know the details why the change, as it is not apparently publicized. This is simply an observation and opinion.
Interesting information about a rapid pole shift taking place, other than what I have read it does seem that North is a little to the West from where I used to remember it being but that's not proof. The numbers are interesting but without knowing if NOAA is responsible for the change in those numbers it's all speculation. I bet someone knows.
edit on 21-3-2012 by PageAlaCearl because: (no reason given)
edit on
21-3-2012 by PageAlaCearl because: (no reason given)
reply to post by PageAlaCearl
Looking at the magnetosphere images, whay does it look like this mess from time to time, instead of looking like it is supposed to here?
Looking at the magnetosphere images, whay does it look like this mess from time to time, instead of looking like it is supposed to here?
Originally posted by tinker9917
reply to post by PageAlaCearl
Looking at the magnetosphere images, whay does it look like this mess from time to time, instead of looking like it is supposed to here?
That is interesting! 2 hours later and it's normal again, wonder what was going on ---- wait is that from today? 12/03/21 - March 21 is what it says and looks to be something going on at about 11:00am Pacific time with the magnetosphere -- Interesting...
edit on 21-3-2012 by PageAlaCearl
because: (no reason given)
reply to post by tinker9917
I wonder if Earth moving through the gravity well connected to the sun has anything to do with the magnetosphere anomalies you found?
I wonder if Earth moving through the gravity well connected to the sun has anything to do with the magnetosphere anomalies you found?
reply to post by PageAlaCearl
Yes, those are from today. Some days I look at various time throughout the day to see if anything "unusual" looking happened. Link
I just wish somebody with knowledge could tell me why this happens.
Yes, those are from today. Some days I look at various time throughout the day to see if anything "unusual" looking happened. Link
I just wish somebody with knowledge could tell me why this happens.
edit on 21-3-2012 by tinker9917 because: (no reason given)
Originally posted by tinker9917
reply to post by PageAlaCearl
Yes, those are from today. Some days I look at various time throughout the day to see if anything "unusual" looking happened. Link
I just wish somebody with knowledge could tell me why this happens.
edit on 21-3-2012 by tinker9917 because: (no reason given)
I have no clue but I find it interesting with all that's going on and the talked about Earth transiting the gravity well of the sun and the earthquake theories posted in mass. If you find something out you might have a pretty interesting thread to talk about!
reply to post by PageAlaCearl
Hi PageAlaCearl!
Interesting thread (S&F!! ). It's been a long time that the pole shift questions interest me, but there are some things that makes me wonder how bad things really are...
Besides the excellent question you rise up here, I noticed that there are an evident lack of datas for the exact North magnetic pole for years. I tried last year to reconstitute its exact path year by year, but I failed as I wasn't able to find any precise datas about this nowhere over the Net.
Today is a special day as, and I think it's the first time here in France that they publicly talked about it in the mass medias, there was an (short, but nonetheless it was there) explanation on how the North Magnetic Pole position move increase in speed and how the magnetic field decline in the South pole.
I'm not, far from that, a pole specialist, and I have a simple question for you (or everybody that can answer):
-"Is there a precise map that shows the North Magnetic Pole position since at least, let say a century, year by year, and its speed increase as well?"
Thanks!
Why was this moved to chit-chat.
This is more than random chit-chat, don't you think?
This is more than random chit-chat, don't you think?
new topics
-
Las Vegas UFO Spotting Teen Traumatized by Demon Creature in Backyard
Aliens and UFOs: 1 minutes ago -
2024 Pigeon Forge Rod Run - On the Strip (Video made for you)
Automotive Discussion: 50 minutes ago -
Gaza Terrorists Attack US Humanitarian Pier During Construction
Middle East Issues: 1 hours ago -
The functionality of boldening and italics is clunky and no post char limit warning?
ATS Freshman's Forum: 2 hours ago -
Meadows, Giuliani Among 11 Indicted in Arizona in Latest 2020 Election Subversion Case
Mainstream News: 2 hours ago -
Massachusetts Drag Queen Leads Young Kids in Free Palestine Chant
Social Issues and Civil Unrest: 3 hours ago -
Weinstein's conviction overturned
Mainstream News: 4 hours ago -
Supreme Court Oral Arguments 4.25.2024 - Are PRESIDENTS IMMUNE From Later Being Prosecuted.
Above Politics: 6 hours ago -
Krystalnacht on today's most elite Universities?
Social Issues and Civil Unrest: 6 hours ago -
Chris Christie Wishes Death Upon Trump and Ramaswamy
Politicians & People: 6 hours ago
top topics
-
Krystalnacht on today's most elite Universities?
Social Issues and Civil Unrest: 6 hours ago, 8 flags -
Weinstein's conviction overturned
Mainstream News: 4 hours ago, 6 flags -
Supreme Court Oral Arguments 4.25.2024 - Are PRESIDENTS IMMUNE From Later Being Prosecuted.
Above Politics: 6 hours ago, 5 flags -
University of Texas Instantly Shuts Down Anti Israel Protests
Education and Media: 8 hours ago, 5 flags -
Massachusetts Drag Queen Leads Young Kids in Free Palestine Chant
Social Issues and Civil Unrest: 3 hours ago, 4 flags -
Meadows, Giuliani Among 11 Indicted in Arizona in Latest 2020 Election Subversion Case
Mainstream News: 2 hours ago, 4 flags -
Chris Christie Wishes Death Upon Trump and Ramaswamy
Politicians & People: 6 hours ago, 2 flags -
Any one suspicious of fever promotions events, major investor Goldman Sachs card only.
The Gray Area: 10 hours ago, 2 flags -
Gaza Terrorists Attack US Humanitarian Pier During Construction
Middle East Issues: 1 hours ago, 2 flags -
2024 Pigeon Forge Rod Run - On the Strip (Video made for you)
Automotive Discussion: 50 minutes ago, 1 flags
active topics
-
University of Texas Instantly Shuts Down Anti Israel Protests
Education and Media • 182 • : JAY1980 -
Las Vegas UFO Spotting Teen Traumatized by Demon Creature in Backyard
Aliens and UFOs • 0 • : FlyersFan -
Candidate TRUMP Now Has Crazy Judge JUAN MERCHAN After Him - The Stormy Daniels Hush-Money Case.
Political Conspiracies • 778 • : Annee -
Supreme Court Oral Arguments 4.25.2024 - Are PRESIDENTS IMMUNE From Later Being Prosecuted.
Above Politics • 59 • : xuenchen -
Breaking Baltimore, ship brings down bridge, mass casualties
Other Current Events • 489 • : Threadbarer -
-@TH3WH17ERABB17- -Q- ---TIME TO SHOW THE WORLD--- -Part- --44--
Dissecting Disinformation • 679 • : McTech2 -
Gaza Terrorists Attack US Humanitarian Pier During Construction
Middle East Issues • 15 • : Irishhaf -
Massachusetts Drag Queen Leads Young Kids in Free Palestine Chant
Social Issues and Civil Unrest • 9 • : theatreboy -
Meadows, Giuliani Among 11 Indicted in Arizona in Latest 2020 Election Subversion Case
Mainstream News • 5 • : Disgusted123 -
God's Righteousness is Greater than Our Wrath
Religion, Faith, And Theology • 29 • : Topcraft
11