It looks like you're using an Ad Blocker.
Please white-list or disable AboveTopSecret.com in your ad-blocking tool.
Thank you.
Some features of ATS will be disabled while you continue to use an ad-blocker.

Deep Tremors and Big Earthquakes
page: 3share:
Originally posted by qmantoo
is there any daily data for Japanese earthquakes available ?
I dont mean images with spots or crosses on it, but real data that we can plot our own with.
The only one I found had the larger earthquake data but nothing for the many smaller swarms and tremors that occur each day. Maybe one of the universities?
Good question. Id love to know the answer to that one as well.
No swarm on the 12th to report
But Q, I found the animated map of the Tohoku EQ that is really kind of strange. The rupture was split up over a 25 minute period. If the rupture had happened all at once it would have been a 9.4 instead of a 9 or 9.1. It also almost looks like charges set off in a distinct pattern. Hmmmmm?
seismology.harvard.edu...
But Ive still not found the swarm data preceding this event.
reply to post by zworld
Hi!
Don't know if this is what you're looking for? This one I posted before, has the swarm of 40 quakes before the big one.
They started with the foreshock & ended with the big one. All in the same area.
Here's the link to the start on page 39. The second half of it is page 38. It goes backwards, newer ones are lower numbered pages.
quake.twiple.jp...:39
Shoot!!! When I checked it, it wasn't coming up on page 39 or in English!!! At least it is showing March 2011. You'll have to hit English & page through it. If I remember right it's not user friendly! You have to sneak up on it! If you use >>, I think it went to the end of the year instead of the end of the month!!! Just click on the last page number everytime unil you get close! I lost so much time when I first used it! There was no easy way to get to an individual page in a given year. Maybe it was just me! I'm such a techtard!!! Oops, is that even PC?
40 pages of quakes for March 2011; 1,170 total. Only 10 before the foreshock, in various locations. Then the swarm of 40 quakes before the big one. So 1,120 aftershocks for March. The smallest I found anywhere was 2.3. but not in March.
If you click on the blue date for an individual quake, it will go to a map showing it. Then click on 'earthquake map' on the top right. Scroll to the bottom. I think that was where the earthquake warning history was. It gives the time, seconds between warnings, latitude & longitude, location, dept, magnitude & Japanese seismic scale.
There's a map on one of them that you are supposed to be able to access the last 30 quakes for 24 & 48 hours. I couldn't get that to change no matter what day I used though, it kept showing the same quakes!
I thought maybe they were using a different scale because they have the big one as 8.1. But that would mean the small ones would be bigger too!!! I don't know why nothing smaller is on there?
WOQ scratches head!!!
Since we are also looking at the data for the Washington/Vancouver Island area, I thought I would put this out and see what everyone thought about it.
I cannot find any earthquakes >= M1 from USGS in that area since British Columbia, Canada 10th Feb 2012 M2.4
(I have chosen M1 as a lower cutoff point)
Now if this is correct, does this mean that there is a build-up of stress going on?
Of course, I may have got this wrong, mainly because the program I have written to determine adjacent areas maybe wrong, but if it is correct that there have not been any >= M1 recently, then it may be significant. Today I will update the splatter chart which I linked to earlier in the thread so that we can see the trend and the silence....
wasobservingquietly - this is excellent data thankyou. Now what to do with it?
reply to post by qmantoo
It makes me wonder what they were thinking when they saw that???
They had a 7.2, then 40 aftershocks of varying magnitudes, the smallest listed as a 3.5.
8-3's, 17-4's, 10-5's & 4-6's, in two days, in no particular pattern that I can see. They weren't increasing or decreasing, just bouncing around random magnitudes.
Unless they thought they were aftershocks? That seems like an awful lot from a 7.2 in two days, but what do I know?
And all in the same area, with none from any other areas mixed in among them!!!
I just wonder if that had ever happened before?
If I saw that, I'd get the heck out of Dodge!!!
Originally posted by qmantoo
Since we are also looking at the data for the Washington/Vancouver Island area, I thought I would put this out and see what everyone thought about it.
I cannot find any earthquakes >= M1 from USGS in that area since British Columbia, Canada 10th Feb 2012 M2.4
(I have chosen M1 as a lower cutoff point)
Now if this is correct, does this mean that there is a build-up of stress going on?
In general its been kinda quiet up there until today. This shouldn't be the starting of a swarm however as its too early. But still interesting cause I think this is the area that TA thought was going to shake. A serious cluster in the north, fair shaker in the south. Hmmmm?
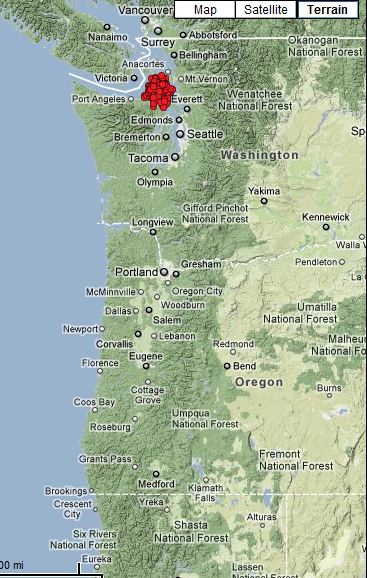
The last-30 earthquake map has some interesting items in it which are not on any ridges but are single
ones miles from anywhere. I just wonder if there is a drill or mine (or something else) going under the surface of the ocean in these places?
In my tiny mind, I thought earthquakes were either caused by slipping plates or rising magma and occurred around faults, grinding plates or volcanoes. But I guess looking at these odd ones, they can come out of nowhere and for no particular reason.
It would be interesting to try to find the captains log of positions of the Japanese exploratory ocean drilling for methane hydrate mission and then plot the earthquakes around that!
edit on 13 Feb 2012 by qmantoo because: MH bit
Originally posted by wasobservingquietly
reply to post by zworld
Hi!
Don't know if this is what you're looking for? This one I posted before, has the swarm of 40 quakes before the big one.
They started with the foreshock & ended with the big one. All in the same area.
wasobservingquietly, I apologize. I thought I responded before but Ive had too much going on. Yes that stuff is very helpful. Excellent resource. Excellent.
Now we need to find maps, as well as the swarm mappings that Hinet does. Im now registered with Hinet and just have to figure out how to get the data downloaded. Once its all assembled we will be rocking.
Originally posted by qmantoo
It would be interesting to try to find the captains log of positions of the Japanese exploratory ocean drilling for methane hydrate mission and then plot the earthquakes around that!edit on 13 Feb 2012 by qmantoo because: MH bit
Thats actually something I intend to do when I get the time.I dont know if Japan is the same as the US, but here we can get at least the block number for any project. But theres usually a way to find them buggers if we cant get the data delivered on a silver platter.
ON EDIT: meant to add that looking at that 30 day pic I could really feel one plate gobbling up the other. Feed me Seymour. No wonder Japan gets so many quakes
edit on 13-2-2012 by zworld because: (no reason given)
reply to post by zworld
No need to apologize, you did respond before!
When I saw your post up above, where you said you still needed swarm data, I thought maybe you hadn't seen it all.
Didn't know it was swarm maps you were looking for. Hope you find some!
No need to apologize, you did respond before!
When I saw your post up above, where you said you still needed swarm data, I thought maybe you hadn't seen it all.
Didn't know it was swarm maps you were looking for. Hope you find some!
This is what UC Berkeley says about the EQ yesterday.
seismo.berkeley.edu...
"Bending in the subducted plate. Is that like folding a t-shirt......just kidding. Never heard that term before, the bending of a plate. Not sure what it means. has anyone experience with this bending of the plate thing?
seismo.berkeley.edu...
Shakemap from the 1:07 PM (PST) February 13 Mw 5.6 event near Eureka, CA. The maximum instrumental intensity for this earthquake is VI. The moment tensor solution, determined at Berkeley, indicates normal faulting, which could be due to bending in the subducted plate.
"Bending in the subducted plate. Is that like folding a t-shirt......just kidding. Never heard that term before, the bending of a plate. Not sure what it means. has anyone experience with this bending of the plate thing?
Wow. USGS is actually concerned about the CSZ. Coulda fooled me.
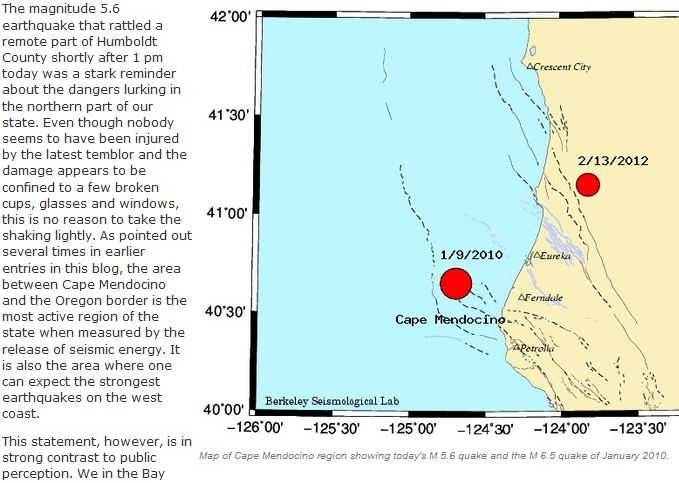
"Where one can expect the strongest earthquakes on the west coast."
No sh!t sparky. USGS has such a funny sense of humor.
ON EDIT: whoops. This is from BSL, not USGS. hence the concern. seismo.berkeley.edu...
"Where one can expect the strongest earthquakes on the west coast."
No sh!t sparky. USGS has such a funny sense of humor.
ON EDIT: whoops. This is from BSL, not USGS. hence the concern. seismo.berkeley.edu...
edit on 14-2-2012
by zworld because: (no reason given)
new topics
-
Israeli Missile Strikes in Iran, Explosions in Syria + Iraq
World War Three: 9 minutes ago -
George Knapp AMA on DI
Area 51 and other Facilities: 5 hours ago -
Not Aliens but a Nazi Occult Inspired and then Science Rendered Design.
Aliens and UFOs: 5 hours ago -
Louisiana Lawmakers Seek to Limit Public Access to Government Records
Political Issues: 8 hours ago -
The Tories may be wiped out after the Election - Serves them Right
Regional Politics: 9 hours ago -
So I saw about 30 UFOs in formation last night.
Aliens and UFOs: 11 hours ago
top topics
-
BREAKING: O’Keefe Media Uncovers who is really running the White House
US Political Madness: 12 hours ago, 25 flags -
George Knapp AMA on DI
Area 51 and other Facilities: 5 hours ago, 19 flags -
Biden--My Uncle Was Eaten By Cannibals
US Political Madness: 13 hours ago, 18 flags -
"We're All Hamas" Heard at Columbia University Protests
Social Issues and Civil Unrest: 13 hours ago, 7 flags -
Louisiana Lawmakers Seek to Limit Public Access to Government Records
Political Issues: 8 hours ago, 7 flags -
Russian intelligence officer: explosions at defense factories in the USA and Wales may be sabotage
Weaponry: 17 hours ago, 6 flags -
So I saw about 30 UFOs in formation last night.
Aliens and UFOs: 11 hours ago, 5 flags -
The Tories may be wiped out after the Election - Serves them Right
Regional Politics: 9 hours ago, 3 flags -
Do we live in a simulation similar to The Matrix 1999?
ATS Skunk Works: 12 hours ago, 3 flags -
Not Aliens but a Nazi Occult Inspired and then Science Rendered Design.
Aliens and UFOs: 5 hours ago, 3 flags
active topics
-
Israeli Missile Strikes in Iran, Explosions in Syria + Iraq
World War Three • 1 • : WeMustCare -
MULTIPLE SKYMASTER MESSAGES GOING OUT
World War Three • 36 • : Irishhaf -
Candidate TRUMP Now Has Crazy Judge JUAN MERCHAN After Him - The Stormy Daniels Hush-Money Case.
Political Conspiracies • 386 • : WeMustCare -
British TV Presenter Refuses To Use Guest's Preferred Pronouns
Education and Media • 61 • : nugget1 -
-@TH3WH17ERABB17- -Q- ---TIME TO SHOW THE WORLD--- -Part- --44--
Dissecting Disinformation • 535 • : cherokeetroy -
African "Newcomers" Tell NYC They Don't Like the Free Food or Shelter They've Been Given
Social Issues and Civil Unrest • 15 • : marg6043 -
Alabama Man Detonated Explosive Device Outside of the State Attorney General’s Office
Social Issues and Civil Unrest • 58 • : Unknownparadox -
BREAKING: O’Keefe Media Uncovers who is really running the White House
US Political Madness • 13 • : WeMustCare -
"We're All Hamas" Heard at Columbia University Protests
Social Issues and Civil Unrest • 127 • : marg6043 -
Two Serious Crimes Committed by President JOE BIDEN that are Easy to Impeach Him For.
US Political Madness • 16 • : WeMustCare