It looks like you're using an Ad Blocker.
Please white-list or disable AboveTopSecret.com in your ad-blocking tool.
Thank you.
Some features of ATS will be disabled while you continue to use an ad-blocker.

What States are Leeching off the taxpayer? - The numbers.
page: 1share:
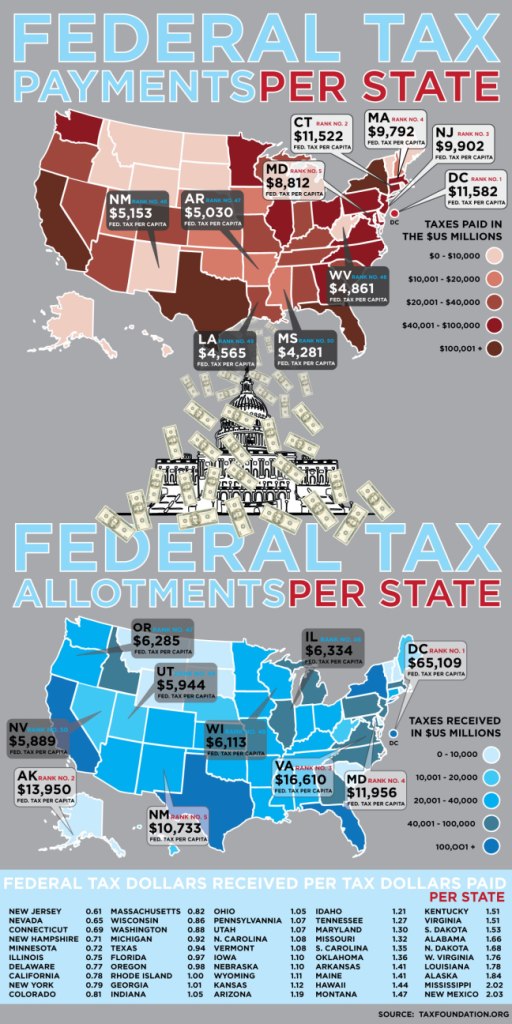
Federal Dollars recieved for Tax Dollars Given...By State
In 2005 the Tax Foundation" did a study to determine how much each state got in Taxpayer Money (Federal Money) in comparison to how much they paid in taxes. It included everything from Unemployment to Welfare etc.
The 32 states (and the District of Columbia) that got more in Federal Spending than they contributed -- 76% are Red States
17 of the 20 (85%) states receiving the most federal spending per dollar of federal taxes paid are Red States.
80% of the Top 10 states that feed at the federal trough, get more dollars back from the US Gov than they pay, are Red States, Voting GOP in 2008
(Red States highlighted in bold):
States Receiving Most in Federal Spending Per Dollar of Federal Taxes Paid:
1. D.C. ($6.17)
2. North Dakota ($2.03)
3. New Mexico ($1.89)
4. Mississippi ($1.84)
5. Alaska ($1.82)
6. West Virginia ($1.74)
7. Montana ($1.64)
8. Alabama ($1.61)
9. South Dakota ($1.59)
10. Arkansas ($1.53)
100% of the 10 states receiving the least federal spending per dollar of federal taxes paid are Blue States, voting Obama in 2008. They lose money when they pay taxes funding the Red States welfare and other programs
Top 10 states that recieve the LEAST federal dollars per dollar given....feed the rest of the states with Blue States highlighted in bold.
States Receiving Least in Federal Spending Per Dollar of Federal Taxes Paid:
1. New Jersey ($0.62)
2. Connecticut ($0.64)
3. New Hampshire ($0.68)
4. Nevada ($0.73)
5. Illinois ($0.77)
6. Minnesota ($0.77)
7. Colorado ($0.79)
8. Massachusetts ($0.79)
9. California ($0.81)
10. New York ($0.81)
Full Study here..
www.taxfoundation.org...
I found it fascinating that in the all of the conservative rhetoric of Leeching and Welfare, that it is rarely mentioned that the Blue States are paying for the "Red States" welfare checks.
While a state like California might recieve more Welfare funds from the Gov than other states, it is a function of population and they actually get much less money back than they pay in taxes than a State like SC or any other Red State.
Put another way...
California gets .81 cents back for every dollar it pays in taxes...South Carolina gets $1.35 for every dollar it pays in taxes.
Also see here for the top 10 States with the highest percentage of poor (living below the poverty level)
Rank States Amount
# 1 Mississippi: 21.6%
# 2 Louisiana: 19.4%
# 3 New Mexico: 19.3%
# 4 District of Columbia: 18.9%
# 5 Arkansas: 17.9%
# 5 West Virginia: 17.9%
# 7 Kentucky: 17.4%
# 8 Texas: 16.6%
# 9 Alabama: 16.1%
# 10 South Carolina: 15.7%
www.statemaster.com...
So it appears that it is the Blue states that fund the Red States "Leeching"?...can anyone explain stark contradiction between Conservative rhetoric and the evidence?
edit on 20-1-2012 by Indigo5 because: (no reason given)
Here is a Graphical representation of the above..Averaged over 1977 to present. So it wasn't just 2005 as seen above...
visualizingeconomics.com...
visualizingeconomics.com...
edit on 20-1-2012 by Indigo5 because: (no reason
given)
reply to post by Indigo5
Just going out on a limb here, but to me the red state/blue state comparison seems likely drawn along lines of mainly rural vs. more urban
states, likely income, etc...the red states in focus appear to be sparsely populated, likely not having a great deal of industry/high-paying jobs,
etc...whereas the blue states are big states with lots of business and generally considered wealthier and "more sophisticated" states, etc. (unsure
how Minnesota figures in there, offhand).
I'll await the social experts, but just with a quick glance, the states involved and my very general view of them seems to jump out.
I'll await the social experts, but just with a quick glance, the states involved and my very general view of them seems to jump out.
edit on
1/20/2012 by Praetorius because: (no reason given)
reply to post by Praetorius
I would agree. The south has had some factors working against it economically. They suffered from the flight of Manufacturing to Mexico and China more than the north and have been slow on the uptick of Technology Ventures, though New Orleans has instituted strong tax incentives now for Silicon Valley like start ups, Ditto Dallas and Austin, other regions have to get on board and encourage more tech companies to set up shop there IMO.
My real question though...as the GOP courts the South with rhetoric of "Leeching off of the taxpayer"...do those southern states realize that it is them that are the "Leeches" thier nominee is referring to?
edit on 20-1-2012 by Indigo5 because: (no reason given)
reply to post by Indigo5
Yeah, you'll have to bear with me while I try to get the gears spinning. Caffeine withdrawal is killing me today...
I think it's a loaded question, and a bit unfair...but understandable. It seems to be a natural function, honestly, that states with higher incomes and populations (etc.) will end up losing on the deal to states with lower incomes, as the latter states still have large-ish infrastructures, roads, etc., to maintain, while they have less income, various other revenue sources, and population to support such.
Admittedly, it's also an illustration of the general understanding of "socialism" at work - "From each according to his ability, to each according to his need" and so forth. There is a nice touch of irony to it, agreed. As far as the leeching off the taxpayer claim, though, I suppose it would be more fair to take a look further into what the funds are actually going in to. If it's mainly a matter of state and county governments eating up the funds for various needs (or wastes...) as compared to the taxpayers receiving direct benefits and welfare, then it falls a bit flat on that appeal.
I'll have to look more into it. Nice post, and definitely gets the mind working...I'll have to follow up when mine's doing so better.
My real question though...as the GOP courts the South with rhetoric of "Leeching off of the taxpayer"...do those southern states realize that it is them that are the "Leeches" thier nominee is referring to?
I think it's a loaded question, and a bit unfair...but understandable. It seems to be a natural function, honestly, that states with higher incomes and populations (etc.) will end up losing on the deal to states with lower incomes, as the latter states still have large-ish infrastructures, roads, etc., to maintain, while they have less income, various other revenue sources, and population to support such.
Admittedly, it's also an illustration of the general understanding of "socialism" at work - "From each according to his ability, to each according to his need" and so forth. There is a nice touch of irony to it, agreed. As far as the leeching off the taxpayer claim, though, I suppose it would be more fair to take a look further into what the funds are actually going in to. If it's mainly a matter of state and county governments eating up the funds for various needs (or wastes...) as compared to the taxpayers receiving direct benefits and welfare, then it falls a bit flat on that appeal.
I'll have to look more into it. Nice post, and definitely gets the mind working...I'll have to follow up when mine's doing so better.
Originally posted by Praetorius
If it's mainly a matter of state and county governments eating up the funds for various needs (or wastes...) as compared to the taxpayers receiving direct benefits and welfare, then it falls a bit flat on that appeal.
I'll have to look more into it. Nice post, and definitely gets the mind working...I'll have to follow up when mine's doing so better.
Agreed. That is why if you look at the end of my OP I provide numbers on poverty and welfare by state...these funds the south recieves are welfare focused.
reply to post by Indigo5
I saw the part about poverty levels, but it doesn't appear to refer to actual (personal) welfare funds distribution. You happen to have any
sources or info handy on that, as federal poverty levels don't necessarily correlate to people collecting welfare (likely due to associated cost of
living, and so forth)? I'm not having luck finding numbers by state right at the moment.
I would like to see this study done on county by county basis. Blue states have red counties and red states have blue counties.
Regardless, I love reading stories like this because of all the conflicting stereotypes that abound. Red states are all the rich people, the 1%. No wait, they are all the poor and uneducated leeching off the govt. No no I got it, only a few really rich control all the poor. It's entertaining to me.
Regardless, I love reading stories like this because of all the conflicting stereotypes that abound. Red states are all the rich people, the 1%. No wait, they are all the poor and uneducated leeching off the govt. No no I got it, only a few really rich control all the poor. It's entertaining to me.
Originally posted by Praetorius
reply to post by Indigo5
I saw the part about poverty levels, but it doesn't appear to refer to actual (personal) welfare funds distribution. You happen to have any sources or info handy on that, as federal poverty levels don't necessarily correlate to people collecting welfare (likely due to associated cost of living, and so forth)? I'm not having luck finding numbers by state right at the moment.
Working on it
Conservatives remind me of religious folks. Both are nothing but HYPOCRITES when you really look into them.
The red states always make the top of the lists in highest poverty, poorest education, lowest wages and lowest quality of life.
Having lived in both a die-hard blue state, and a die-hard red state, there is no comparison between the two. Sad case the red states are..
The red states always make the top of the lists in highest poverty, poorest education, lowest wages and lowest quality of life.
Having lived in both a die-hard blue state, and a die-hard red state, there is no comparison between the two. Sad case the red states are..
edit on 20-1-2012 by HangTheTraitors because: (no reason given)
Its expensive to keep a federal occupying force in place for a hundred years.
So do you want to do something about it or just drag it out as petty political fodder when the mood suits?
NH alone kind of kills the politics of it all. Having been red long before it was blue and still not taking in many federal dollars.
You don't want people suckling your tit? Stop putting it out there.
Posted Via ATS Mobile: m.abovetopsecret.com
So do you want to do something about it or just drag it out as petty political fodder when the mood suits?
NH alone kind of kills the politics of it all. Having been red long before it was blue and still not taking in many federal dollars.
You don't want people suckling your tit? Stop putting it out there.
The first problem that I have is the issue of Red and Blue states. The color is determined by what political party wins the state, not whether the
majority of the people in the state want any particular thing.
Secondly, in the context of federal elections, a state border is arbitrary. A better breakdown would be coloring the counties, and even then you have some of the same problems. That is, 51% and you have either red or blue, not shades of either.
Lastly, both parties believe in welfare. Welfare for their voting base.
Tax money is distributed based upon political clout and tax revenue is based upon the economy of the individual state.
reply to post by Praetorius
The Ten States with the Highest Percentage of it's People relying on Foodstamps..
Numbers from FDA Accounting as of January 2012, slideshow by huff.
1. Mississippi
2. Oregon
3. Tennessee
4. New Mexico
5. Michigan
6. Louisianna
7. Kentucky
8. West Virginia
9. Maine
10. South Carolina
www.fns.usda.gov...
www.huffingtonpost.com...&title=10_South_Carolina
Originally posted by jjkenobi
Regardless, I love reading stories like this because of all the conflicting stereotypes that abound. Red states are all the rich people, the 1%. No wait, they are all the poor and uneducated leeching off the govt. No no I got it, only a few really rich control all the poor. It's entertaining to me.
Nope...All of the above. The Red States have greater poverty than the Blue States, live more off the Tax Payer than the Blue States while at the same time supporting candidates whose policies would abandone them.
That is the irony I like to examine.
reply to post by Indigo5
Just making a guess here, I know that South Carolina doesn't have any state taxes and I believe Florida is the same. It could quite possibly be that because they don't have revenue collected from taxes they require more money from the federal government for welfare and the likes.
I also noticed states like California, New York and the others with high state taxes. They wouldn't need as much Federal money.
Originally posted by jjkenobi
I would like to see this study done on county by county basis. Blue states have red counties and red states have blue counties.
Here you go...SNAP = Food Stamps, Detailed maps you can click through.
At a glance, one sees the layout of high rates of SNAP participation across Appalachia, the Mississippi delta and the deep south, the Texas borderlands, and remote rural parts of the West.
usfoodpolicy.blogspot.com...
edit on 20-1-2012 by Indigo5 because: (no reason given)
reply to post by Indigo5
Where did you find what it included? I can't find that anywhere on the link you provided. Can you provide a link that list the criteria they used? Not that I don't take your word for it, I would just like to see exactly what is included and what was left out.
The "Blue States" Which by your definition means they liked Obama more than McCain and "Red States" the opposite. I don't know how reliable that is.
I would consider a "Blue State" one that is primarily governed and represented by democrats and a "Red State" one that is primarily governed and represented by republicans. Have you looked at the representation of these states or are you just going from who voted for who by state for president? I don't know exactly how reliable a way that is to judge the majority of political leanings in any particular state.
Anyhow, I think you have answered your own question though you may not accept it. It would seem obvious to me, if these "Blue States" don't get their fair share of tax money back to them they would want more perhaps explaining why they are "Blue States" to begin with or rather to say, why they voted in a majority for Obama.
This data doesn't mean a thing though without a link to what programs it includes and an understanding of the actual democrat or republican representation of each state.
Simply voting in a majority for or against a president doesn't make a states majority political leanings known it just says who they by a majority voted for in one election.
Also the data is from 2005 and the redstate/bluestate thing is from 2008. 3 years is a long time when it comes to political theater. Perhaps you can see which states were blue or red from the year 2005 based on their government and representation.
My conclusion is that your statement has been made from unrelated data and is thus inconclusive and perhaps quite faulty.
That's not to say you may not be right, simply that with the data you have given us no reliable conclusion can be drawn.
Anyhow, except for Ron Paul, most "conservatives" are very specific about which federal spending the don't like and what they deem as fine. If this data includes "everything" it doesn't really speak to the rhetoric that the "conservatives" spout. I say except Ron Paul because it is my understanding he would want to eventually get rid of it all.
I am also concerned that you have, it seemed to me, made this a left vs right thing when everyone knows that all politicians are scumbags that say one thing and do another regardless of party affiliation.
It included everything from Unemployment to Welfare etc.
Where did you find what it included? I can't find that anywhere on the link you provided. Can you provide a link that list the criteria they used? Not that I don't take your word for it, I would just like to see exactly what is included and what was left out.
The "Blue States" Which by your definition means they liked Obama more than McCain and "Red States" the opposite. I don't know how reliable that is.
I would consider a "Blue State" one that is primarily governed and represented by democrats and a "Red State" one that is primarily governed and represented by republicans. Have you looked at the representation of these states or are you just going from who voted for who by state for president? I don't know exactly how reliable a way that is to judge the majority of political leanings in any particular state.
Anyhow, I think you have answered your own question though you may not accept it. It would seem obvious to me, if these "Blue States" don't get their fair share of tax money back to them they would want more perhaps explaining why they are "Blue States" to begin with or rather to say, why they voted in a majority for Obama.
This data doesn't mean a thing though without a link to what programs it includes and an understanding of the actual democrat or republican representation of each state.
Simply voting in a majority for or against a president doesn't make a states majority political leanings known it just says who they by a majority voted for in one election.
Also the data is from 2005 and the redstate/bluestate thing is from 2008. 3 years is a long time when it comes to political theater. Perhaps you can see which states were blue or red from the year 2005 based on their government and representation.
My conclusion is that your statement has been made from unrelated data and is thus inconclusive and perhaps quite faulty.
That's not to say you may not be right, simply that with the data you have given us no reliable conclusion can be drawn.
Anyhow, except for Ron Paul, most "conservatives" are very specific about which federal spending the don't like and what they deem as fine. If this data includes "everything" it doesn't really speak to the rhetoric that the "conservatives" spout. I say except Ron Paul because it is my understanding he would want to eventually get rid of it all.
I am also concerned that you have, it seemed to me, made this a left vs right thing when everyone knows that all politicians are scumbags that say one thing and do another regardless of party affiliation.
edit on 20-1-2012 by sageofmonticello because: (no reason given)
Originally posted by IncognitoGhostman
reply to post by Indigo5
Just making a guess here, I know that South Carolina doesn't have any state taxes and I believe Florida is the same. It could quite possibly be that because they don't have revenue collected from taxes they require more money from the federal government for welfare and the likes.
I also noticed states like California, New York and the others with high state taxes. They wouldn't need as much Federal money.
Doesn't explain the stats on actual food stamp and welfare participation that lean Red.
Originally posted by sageofmonticello
reply to post by Indigo5
It included everything from Unemployment to Welfare etc.
Where did you find what it included? I can't find that anywhere on the link you provided.
Working on it. I was reading a lot of data..will track down the citiation on the link for you.
Originally posted by sageofmonticello
The "Blue States" Which by your definition means they liked Obama more than McCain and "Red States" the opposite.
I used the last election as a Red/Blue meter, but for the purposes of the data little changed scrolling back on the electoral map to prior years, lest you would like to argue those states are traditionally blue?
Originally posted by sageofmonticello
I would consider a "Blue State" one that is primarily governed and represented by democrats and a "Red State" one that is primarily governed and represented by republicans. Have you looked at the representation of these states or are you just going from who voted for who by state for president? I don't know exactly how reliable a way that is to judge the majority of political leanings in any particular state.
The vast majority of the red states I indicated are solidly in the red camp, representitives and all.
Originally posted by sageofmonticello
This data doesn't mean a thing though without a link to what programs it includes and an understanding of the actual democrat or republican representation of each state.
I am littering this thread with specific poverty and food stamp per capita stats for context.
Originally posted by sageofmonticello
Also the data is from 2005 and the redstate/bluestate thing is from 2008. 3 years is a long time when it comes to political theater. Perhaps you can see which states where blue or red from the year 2005 based on their government and representation.
Again, electoral maps are easily available, little changed for the majority of states involved.
Originally posted by sageofmonticello
My conclusion is that your statement has been made from unrelated data and is thus inconclusive and perhaps quite faulty.
Your conclusion contains absolutely no evidence and data - like I provided and continue to provide.
Originally posted by Indigo5
Doesn't explain the stats on actual food stamp and welfare participation that lean Red.
I cant speak of the other states but Maine's high food stamp stats are because of a nearly 50 year era of big government local election winners loosening the requirements to qualify for aid year after year.
If we assume stereotypical roles of "democrat" and "republican" it would have been the democrats that put all those Mainers on food stamps through lax standards.
Now, for the first time in so many decades the "republicans" have some power in Maine. One of the first things they did was prepare to tackle the obscene welfare participation by at least putting the standards on par with surrounding states. Maine is so full of hippies and retirees occupying double-wides that any mention of cutting the dole brings outrage aplenty.
So when popular outrage forces the "republicans" to stall their cutting measures and the state continues to be a money pit for the nation who's fault is it going to be? The "republicans" for not following through? The "democrats" for creating the dependence in the first place? The whiny population for refusing to accept any cut?
Or will each group respectively use whichever excuse suits their interests at a given time?
Nobody wants to fix anything. This thread is a perfect example of that. You love that people are on welfare. You love that we have guns to our head extorting our wages. You love that nothing will ever be right, fixed or even honest.
Because if it were fixed you wouldnt be able to play the stupid game you and so many others are so fond of.
Play the game. Fine by me. Just stop dipping into my wallet to fund the stupidity of it all.
PS Topic was posted in April 2011 www.abovetopsecret.com... and October 2004 www.abovetopsecret.com... which tells me this is just more chain email tripe designed to work partisan idiots up into a fervor.
edit on 20-1-2012 by thisguyrighthere because: (no reason given)
new topics
-
VP's Secret Service agent brawls with other agents at Andrews
Mainstream News: 29 minutes ago -
Sunak spinning the sickness figures
Other Current Events: 1 hours ago -
Nearly 70% Of Americans Want Talks To End War In Ukraine
Political Issues: 1 hours ago -
Late Night with the Devil - a really good unusual modern horror film.
Movies: 3 hours ago -
Cats Used as Live Bait to Train Ferocious Pitbulls in Illegal NYC Dogfighting
Social Issues and Civil Unrest: 4 hours ago -
The Good News According to Jesus - Episode 1
Religion, Faith, And Theology: 6 hours ago -
HORRIBLE !! Russian Soldier Drinking Own Urine To Survive In Battle
World War Three: 8 hours ago -
Bobiverse
Fantasy & Science Fiction: 11 hours ago -
Florida man's trip overseas ends in shock over $143,000 T-Mobile phone bill
Social Issues and Civil Unrest: 11 hours ago
top topics
-
Florida man's trip overseas ends in shock over $143,000 T-Mobile phone bill
Social Issues and Civil Unrest: 11 hours ago, 8 flags -
SETI chief says US has no evidence for alien technology. 'And we never have'
Aliens and UFOs: 15 hours ago, 7 flags -
Cats Used as Live Bait to Train Ferocious Pitbulls in Illegal NYC Dogfighting
Social Issues and Civil Unrest: 4 hours ago, 7 flags -
Former Labour minister Frank Field dies aged 81
People: 13 hours ago, 4 flags -
Bobiverse
Fantasy & Science Fiction: 11 hours ago, 3 flags -
HORRIBLE !! Russian Soldier Drinking Own Urine To Survive In Battle
World War Three: 8 hours ago, 2 flags -
Nearly 70% Of Americans Want Talks To End War In Ukraine
Political Issues: 1 hours ago, 2 flags -
Late Night with the Devil - a really good unusual modern horror film.
Movies: 3 hours ago, 2 flags -
VP's Secret Service agent brawls with other agents at Andrews
Mainstream News: 29 minutes ago, 1 flags -
Sunak spinning the sickness figures
Other Current Events: 1 hours ago, 0 flags
active topics
-
SETI chief says US has no evidence for alien technology. 'And we never have'
Aliens and UFOs • 38 • : SchrodingersRat -
VP's Secret Service agent brawls with other agents at Andrews
Mainstream News • 10 • : theatreboy -
15 Unhealthiest Sodas On The Market
Health & Wellness • 42 • : ThatSmellsStrange -
Breaking Baltimore, ship brings down bridge, mass casualties
Other Current Events • 483 • : KrustyKrab -
President BIDEN Vows to Make Americans Pay More Federal Taxes in 2025 - Political Suicide.
2024 Elections • 120 • : ImagoDei -
Truth Social goes public, be careful not to lose your money
Mainstream News • 126 • : Zanti Misfit -
Nearly 70% Of Americans Want Talks To End War In Ukraine
Political Issues • 6 • : budzprime69 -
HORRIBLE !! Russian Soldier Drinking Own Urine To Survive In Battle
World War Three • 25 • : Freeborn -
Definitive 9.11 Pentagon EVIDENCE.
9/11 Conspiracies • 422 • : Zanti Misfit -
How ageing is" immune deficiency"
Medical Issues & Conspiracies • 30 • : annonentity