It looks like you're using an Ad Blocker.
Please white-list or disable AboveTopSecret.com in your ad-blocking tool.
Thank you.
Some features of ATS will be disabled while you continue to use an ad-blocker.

New Activity at Mt. Rainier Confirmed to Be Seismic (...or ICE?), Right here on ATS!
page: 14share:
reply to post by Olivine
Yeah, thanks for digging that up Olivine. PM, see what I mean? Look at that. Look at all the low frequency present.
I have already thought about the ice possibly attenuating out some of those frequencies, but that can't be it, cause clearly the 1-6 Hz range we are receiving on a regular basis with these ice quakes. The glacier would attenuate those too, but it is not. So the lack of persistent energy in those bands makes me think that it cannot be HT.
reply to post by TrueAmerican
OK, rest your case on this one and see if it will stay still.
Mount St Helens tremor underlain with quakes against Mt Rainier with hardly any quakes. Both at 2000Hz, or 20x speed and showing IDENTICAL frequencies.
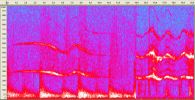
And now listen to the two sounds joined together.
msh-rainier.wav
Can you explain to me why, of the HUNDREDS of files I have listened to here and around Arkansas every time some one singles one out I have NEVER heard this sound before?
If you think this is just ice, find me another that shows the same frequencies and sound from Rainier or Glacier Peak. I am not saying it is not, just that I have not heard this one before.
OK, rest your case on this one and see if it will stay still.
Mount St Helens tremor underlain with quakes against Mt Rainier with hardly any quakes. Both at 2000Hz, or 20x speed and showing IDENTICAL frequencies.
And now listen to the two sounds joined together.
msh-rainier.wav
Can you explain to me why, of the HUNDREDS of files I have listened to here and around Arkansas every time some one singles one out I have NEVER heard this sound before?
If you think this is just ice, find me another that shows the same frequencies and sound from Rainier or Glacier Peak. I am not saying it is not, just that I have not heard this one before.
edit on 24/1/2012 by PuterMan because: (no reason given)
reply to post by TrueAmerican
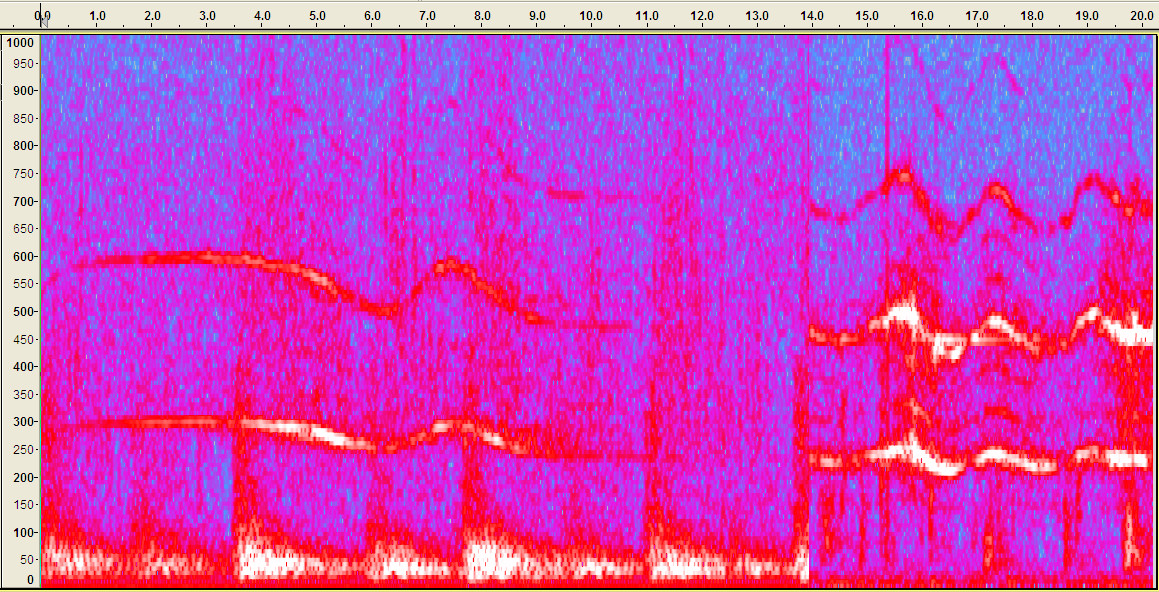
Actually little or no 1 Hz. Almost all of the signals i have looked at so far are between 5Hz and 15Hz. Very few show the low seismic persistent signal that you yourself have commented on when looking at known seismic events.
cause clearly the 1-6 Hz range we are receiving on a regular basis with these ice quakes
Actually little or no 1 Hz. Almost all of the signals i have looked at so far are between 5Hz and 15Hz. Very few show the low seismic persistent signal that you yourself have commented on when looking at known seismic events.
reply to post by PuterMan
You are not setup for running, streaming spectrograms. And you will only see what have pulled in raw data. I am seeing it all at this point.True that 1 Hz itself is not a predominant frequency, but it is there nonetheless in a lot of these quakes. But let's not argue semantics, shall we? I think you get the point.
Your opinions are highly noted. If you think there is even a minute chance that was HT, then it behooves us all the more to keep an eye on Rainier.
The whole point of this thread, before we get too lost in it all, is basically a running hypothesis that the ice could be attenuating the events, and blurring them to a point where the scientists may be misreading them as ice quakes. When in fact, they could be seismic. And if they are seismic, and the swarms are increasing in frequency (which they seem to be), it IS of concern. Add to that the possibility now of this being HT, and well, this is how Mother Nature kills you unexpectedly, even with scientists on the ball. I am just trying to make sure they are watching the right ball. Both as an experiment, and a learning experience.
reply to post by TrueAmerican
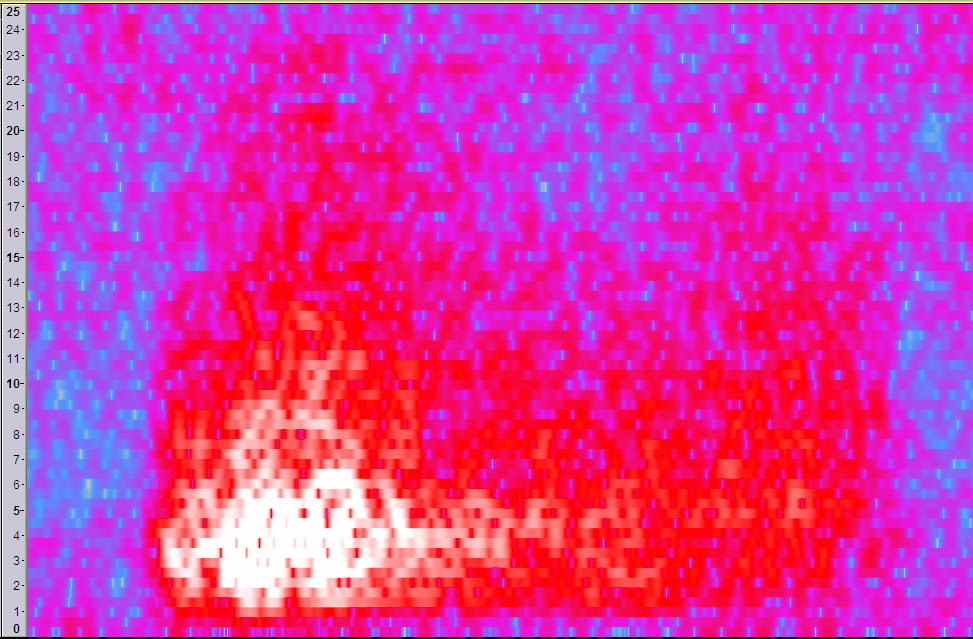
I can run any SAC file into a streaming spectrogram if I need to, but that is no different from being able to view a full 24hrs. Yes it is raw data. The only difference if that I don't run it through a band-pass filter generally, just a low pass at 6 Hz if I know it is seismic and I don't have the facility to moderate it with the poles and zeros information, but it is enough to see the frequencies.
Here is the move and bump start
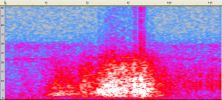
Very little 1 Hz. Almost all above that. You seem to forget TA that whilst you may have a new toy to play with I have been looking at these frequencies in the spectrograms for about 3 years now. There is a difference between most of these quakes and the known earthquakes which are heavy in the 1 Hz band.
I am still asking therefore, if that is not HT, what is it? How do you explain the identical frequencies? How do you explain that I have never come across that signal before?
You are not setup for running, streaming spectrograms. And you will only see what have pulled in raw data. I am seeing it all at this point.True that 1 Hz itself is not a predominant frequency, but it is there nonetheless in a lot of these quakes.
I can run any SAC file into a streaming spectrogram if I need to, but that is no different from being able to view a full 24hrs. Yes it is raw data. The only difference if that I don't run it through a band-pass filter generally, just a low pass at 6 Hz if I know it is seismic and I don't have the facility to moderate it with the poles and zeros information, but it is enough to see the frequencies.
Here is the move and bump start
Very little 1 Hz. Almost all above that. You seem to forget TA that whilst you may have a new toy to play with I have been looking at these frequencies in the spectrograms for about 3 years now. There is a difference between most of these quakes and the known earthquakes which are heavy in the 1 Hz band.
I am still asking therefore, if that is not HT, what is it? How do you explain the identical frequencies? How do you explain that I have never come across that signal before?
Here is a thumbnail of a map I cooked up showing Mt. Rainier with a few items of interest.
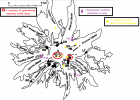
The largest red oval indicates an extensive area (>10,000m2) of boiling-point fumaroles at 76-82°C and heated ground along and marginal to the overlapping rims of East and West Craters at the volcano's summit.
The smaller red oval to the right is a small area (
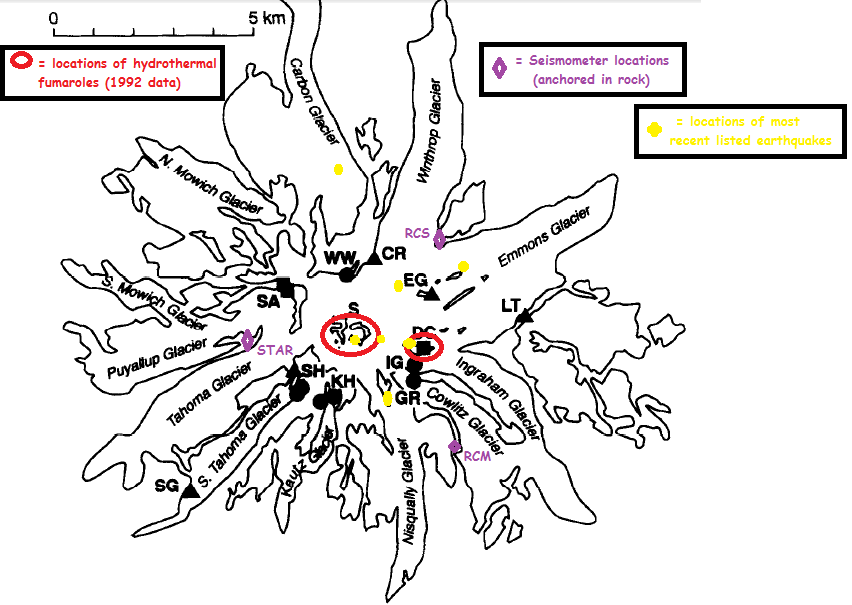
The largest red oval indicates an extensive area (>10,000m2) of boiling-point fumaroles at 76-82°C and heated ground along and marginal to the overlapping rims of East and West Craters at the volcano's summit.
The smaller red oval to the right is a small area (
reply to post by PuterMan
:shk: We are taking our eye off the ball, my friend.
Do me a favor, and post a spectro of some of the small events. Pick some different spots in the timeline. Pick some different sized events. Give us spectro samples, say, of a small, medium and large "icequake" events.
:shk: We are taking our eye off the ball, my friend.
Do me a favor, and post a spectro of some of the small events. Pick some different spots in the timeline. Pick some different sized events. Give us spectro samples, say, of a small, medium and large "icequake" events.
Oh, forgot to mention, and this is important, that the cases where I have seen 1 Hz present are mostly at STAR, not RCS...(Sorry, should of said that
before I sent you on a goose chase...). But it should be noted that STAR is closest to the summit.
reply to post by TrueAmerican
Why?
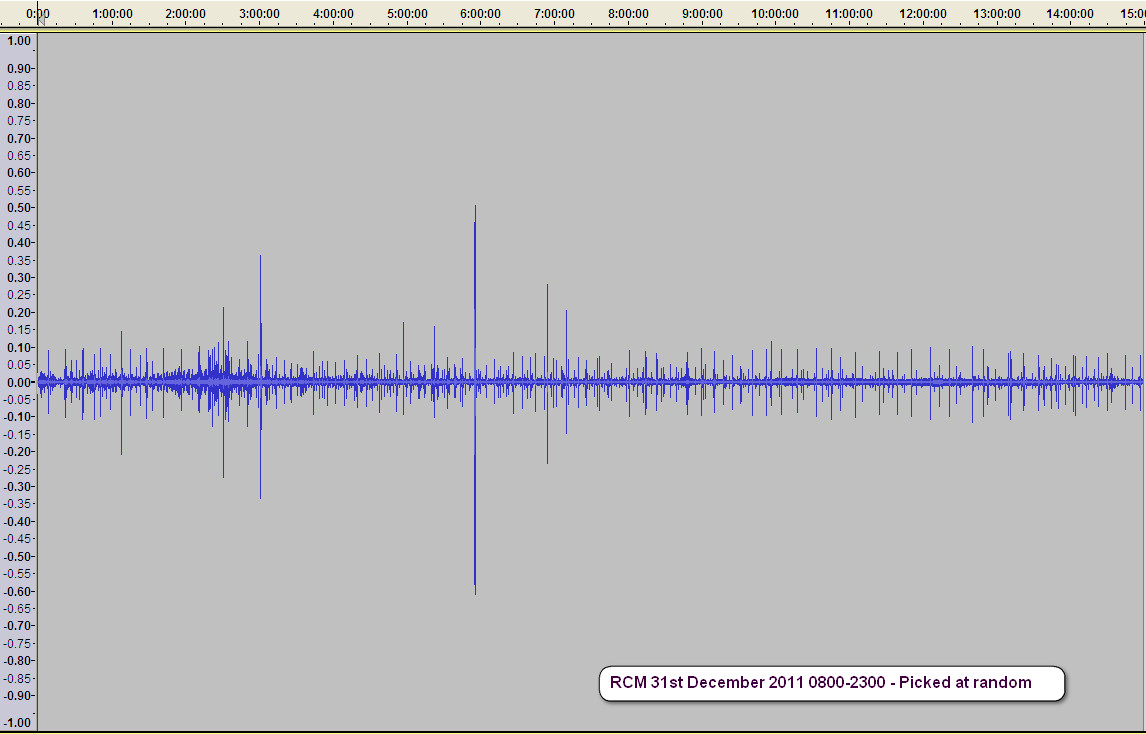
RCM 31 Dec 11 By comparison Glacier Peak 06 Nov 11
  These two are very similar.
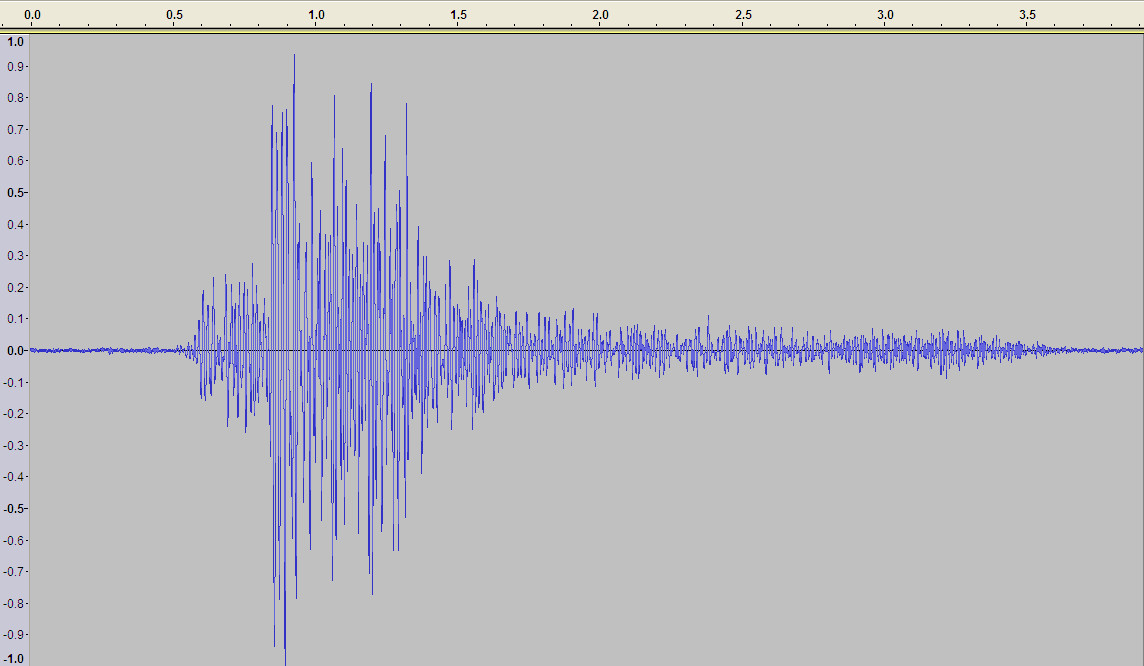
The area I picked at random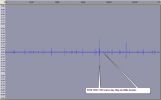
Close up of the area
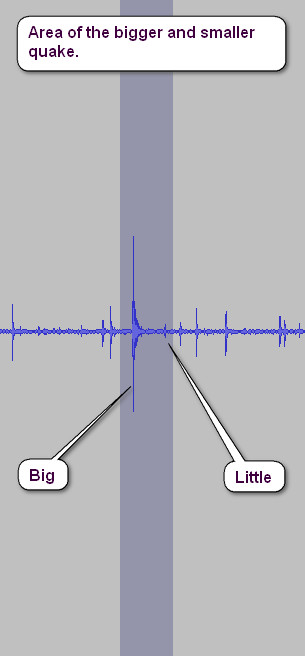
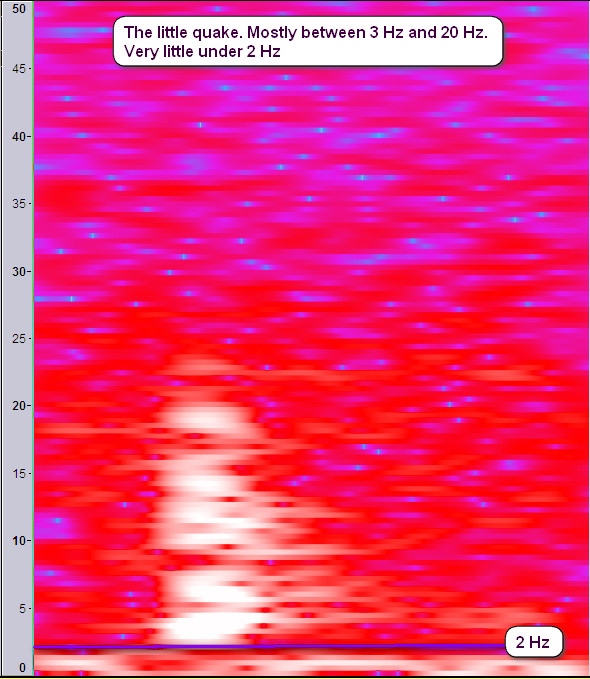
The little quake
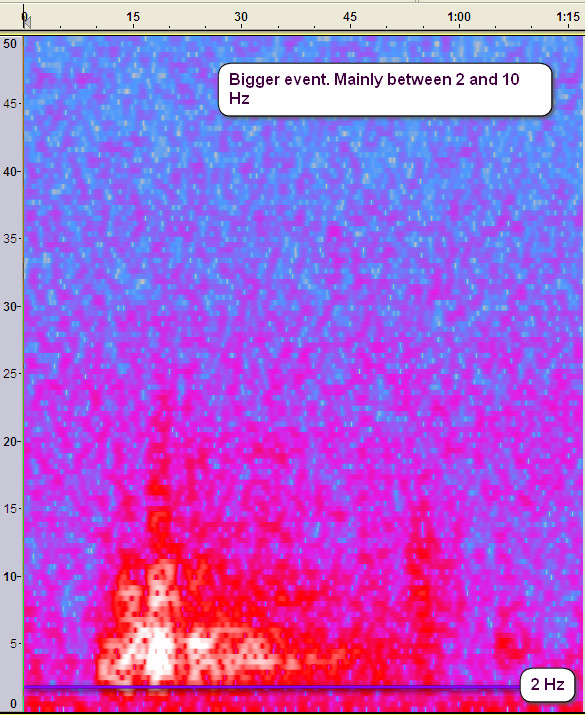
The bigger quake
Does any of this look like the other signal? No. Have you offered an explanation? No.
Does it look like the HT as MSH? Yes.
Remember ducks?
Why?
RCM 31 Dec 11
 By comparison Glacier Peak 06 Nov 11
 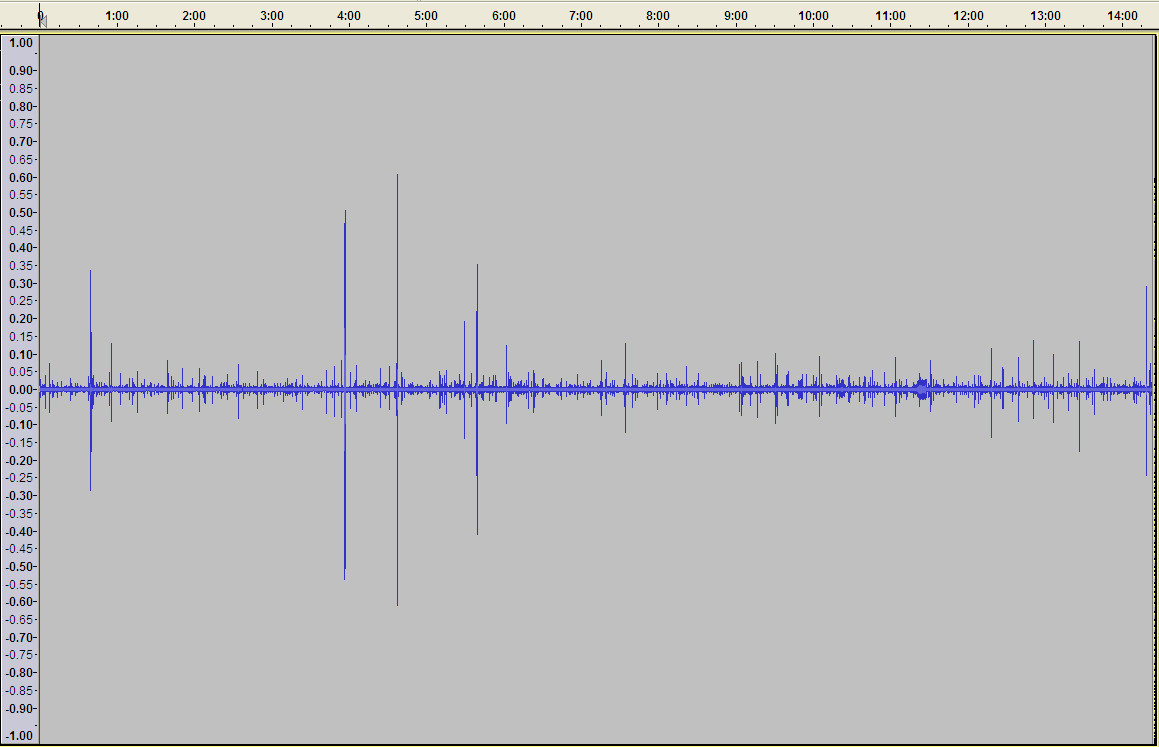 These two are very similar.
 The area I picked at random
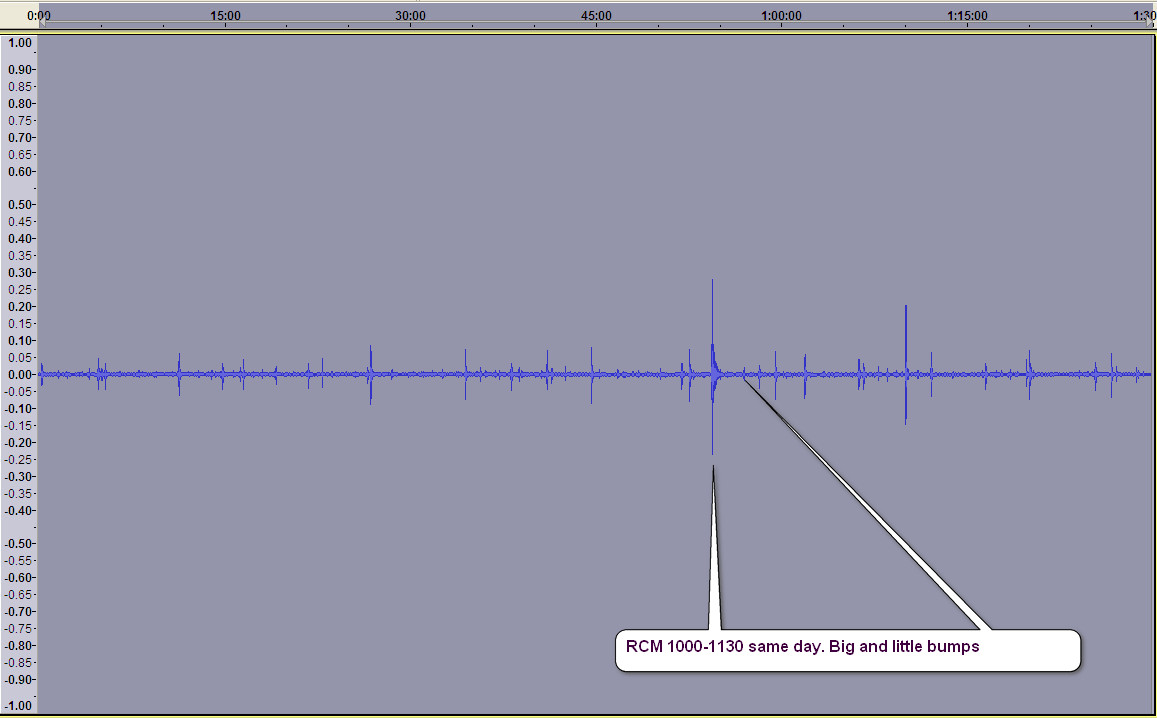
Close up of the area
The little quake
The bigger quake
Does any of this look like the other signal? No. Have you offered an explanation? No.
Does it look like the HT as MSH? Yes.
Remember ducks?
reply to post by PuterMan
lol, I mentioned 1-6 Hz as a mere range, trying to make a simple point! I realize 1 Hz isn't as hot, but it's there, just look at your own pic. Be sure to check out some of the STAR station data, and in broader segments, different periods.
Besides, what are we getting at with this, anyway. Of course I don't have an explanation for your "unknown" signature, that you apparently feel is characteristic of HT. I'll bet the guys up at PNSN would be inclined to agree with me that it is not HT, but ok. Let's find out what they think. Maybe someone could email it to them for an opinion?
reply to post by TrueAmerican
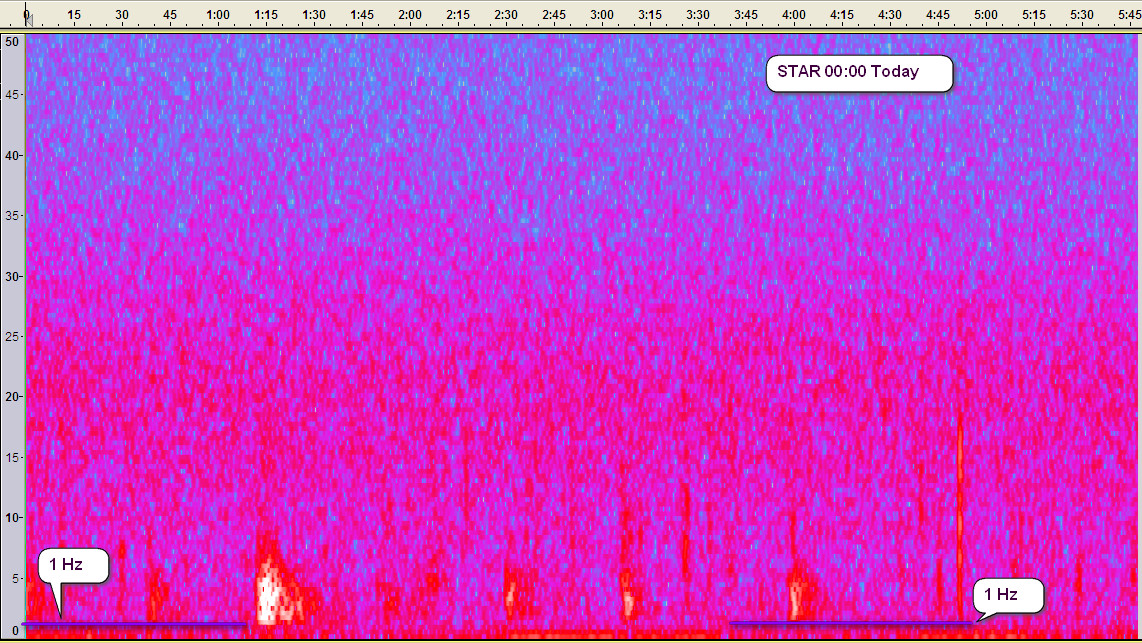
Almost impossible to get a signal off STAR yesterday or today. All broken up into sub 10 seconds slices. There was one 5:45 minute section at midnight. Guess what? No 1 Hz

Almost impossible to get a signal off STAR yesterday or today. All broken up into sub 10 seconds slices. There was one 5:45 minute section at midnight. Guess what? No 1 Hz
Originally posted by PuterMan
reply to post by TrueAmerican
Almost impossible to get a signal off STAR yesterday or today. All broken up into sub 10 seconds slices. There was one 5:45 minute section at midnight. Guess what? No 1 Hz
I could make a more in depth comment than I am gonna make, but I can't.
That is not true. Been watching STAR all day today and yesterday with only one dropout period. How I am able to do that I am not willing to discuss.
ETA: At least not publicly. I want you in this world, PM, and if I can get clearance, would love to share this with you. But there are certain responsibilities that come with this, as certain information is revealed that is not public, and part of it is a security issue.
But the bottom line is we just need to keep an eye on that darn thing.
edit on Tue Jan 24th 2012 by TrueAmerican because: (no reason
given)
reply to post by TrueAmerican
Sorry beg to differ. Using the inferior tools that I have (VASE) the period from 00:00 to 01:00 today for STAR came down as 497 separate slices.
That is not true
Sorry beg to differ. Using the inferior tools that I have (VASE) the period from 00:00 to 01:00 today for STAR came down as 497 separate slices.
reply to post by Olivine
Looks better on this one (not clipped) RCM.UW..EHZ.2012.024. Looks like it could be ice again.
Will have a listen if I can.
Looks better on this one (not clipped) RCM.UW..EHZ.2012.024. Looks like it could be ice again.
Will have a listen if I can.
Originally posted by PuterMan
reply to post by TrueAmerican
That is not true
Sorry beg to differ. Using the inferior tools that I have (VASE) the period from 00:00 to 01:00 today for STAR came down as 497 separate slices.
From your frame of reference, that would appear to be the case. But I am not just pushing hot air here. I will give you that information from that time period:

And I can't provide a link to that, because, like I said, I AM the webicorder now.
reply to post by TrueAmerican
Looks fine here as well: STAR.UW..EHZ.2012.024
Very different when one comes to download.
Looks fine here as well: STAR.UW..EHZ.2012.024
Very different when one comes to download.
reply to post by PuterMan
There are some issues with IRIS DMC, as usual. But in their defense, that is a monster that by its very nature are going to have problems that go with the territory.
There are some issues with IRIS DMC, as usual. But in their defense, that is a monster that by its very nature are going to have problems that go with the territory.
reply to post by Olivine
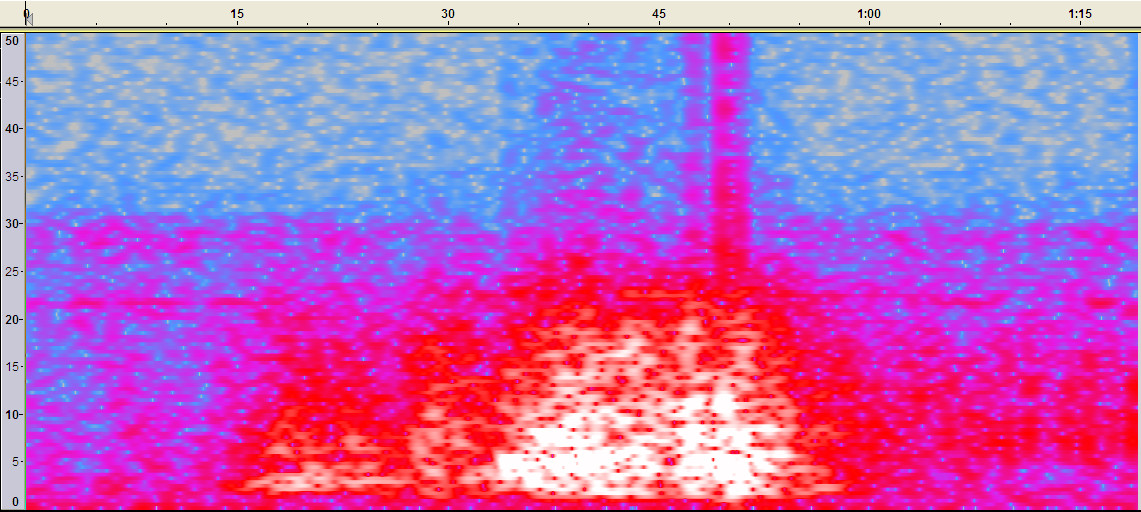
Ice/Glacier I think. Rumbles well in the sound file but does not have the sharpness of a local quake, and it has to be local as the signal is much smaller on other seismos.
UWRCM _EHZ_20120124-131700_2000_AMPsps.WAV
Ice/Glacier I think. Rumbles well in the sound file but does not have the sharpness of a local quake, and it has to be local as the signal is much smaller on other seismos.
UWRCM _EHZ_20120124-131700_2000_AMPsps.WAV
edit on 24/1/2012 by PuterMan because: (no reason given)
new topics
-
Any one suspicious of fever promotions events, major investor Goldman Sachs card only.
The Gray Area: 45 minutes ago -
God's Righteousness is Greater than Our Wrath
Religion, Faith, And Theology: 5 hours ago -
Electrical tricks for saving money
Education and Media: 8 hours ago -
VP's Secret Service agent brawls with other agents at Andrews
Mainstream News: 9 hours ago -
Sunak spinning the sickness figures
Other Current Events: 10 hours ago -
Nearly 70% Of Americans Want Talks To End War In Ukraine
Political Issues: 10 hours ago
top topics
-
VP's Secret Service agent brawls with other agents at Andrews
Mainstream News: 9 hours ago, 9 flags -
Cats Used as Live Bait to Train Ferocious Pitbulls in Illegal NYC Dogfighting
Social Issues and Civil Unrest: 13 hours ago, 8 flags -
Electrical tricks for saving money
Education and Media: 8 hours ago, 4 flags -
HORRIBLE !! Russian Soldier Drinking Own Urine To Survive In Battle
World War Three: 17 hours ago, 3 flags -
Sunak spinning the sickness figures
Other Current Events: 10 hours ago, 3 flags -
Nearly 70% Of Americans Want Talks To End War In Ukraine
Political Issues: 10 hours ago, 3 flags -
Late Night with the Devil - a really good unusual modern horror film.
Movies: 12 hours ago, 2 flags -
The Good News According to Jesus - Episode 1
Religion, Faith, And Theology: 15 hours ago, 1 flags -
Any one suspicious of fever promotions events, major investor Goldman Sachs card only.
The Gray Area: 45 minutes ago, 1 flags -
God's Righteousness is Greater than Our Wrath
Religion, Faith, And Theology: 5 hours ago, 0 flags
active topics
-
Nearly 70% Of Americans Want Talks To End War In Ukraine
Political Issues • 15 • : Consvoli -
SETI chief says US has no evidence for alien technology. 'And we never have'
Aliens and UFOs • 55 • : Consvoli -
God's Righteousness is Greater than Our Wrath
Religion, Faith, And Theology • 4 • : randomuser2034 -
The Acronym Game .. Pt.3
General Chit Chat • 7746 • : bally001 -
Any one suspicious of fever promotions events, major investor Goldman Sachs card only.
The Gray Area • 1 • : BeyondKnowledge3 -
Terrifying Encounters With The Black Eyed Kids
Paranormal Studies • 75 • : FlyersFan -
Russia Ukraine Update Thread - part 3
World War Three • 5728 • : F2d5thCavv2 -
Electrical tricks for saving money
Education and Media • 5 • : BeyondKnowledge3 -
-@TH3WH17ERABB17- -Q- ---TIME TO SHOW THE WORLD--- -Part- --44--
Dissecting Disinformation • 658 • : F2d5thCavv2 -
Sunak spinning the sickness figures
Other Current Events • 7 • : xWorldxGonexMadx