It looks like you're using an Ad Blocker.
Please white-list or disable AboveTopSecret.com in your ad-blocking tool.
Thank you.
Some features of ATS will be disabled while you continue to use an ad-blocker.

Quake Watch 2012
page: 88share:
reply to post by muzzy
Sounds like you had a blast with that one.
I was going to move to New Zealand a couple of years ago but shil* happens and the move didn't go ahead.
It's a beautiful part of the World you live in, although very active.
Sounds like you had a blast with that one.
I was going to move to New Zealand a couple of years ago but shil* happens and the move didn't go ahead.
It's a beautiful part of the World you live in, although very active.
Magnitude ML 4.0
Region BULGARIA
Date time 2012-03-30 20:48:33.0 UTC
Location 42.59 N ; 26.33 E
Depth 3 km
Distances 207 km S Bucharest (pop 1,877,155 ; local time 23:48:33.8 2012-03-30)
10 km S Sliven (pop 96,368 ; local time 23:48:33.8 2012-03-30)
60 km E Stara zagora (pop 143,431 ; local time 23:48:33.8 2012-03-30)
EMSC
www.jsonline.com...
www.reuters.com...
www.wimp.com...
www.youtube.com...
www.pbs.org...
www.mauinews.com...
www.arktimes.com...
"Session: The M5.8 Central Virginia and the M5.6 Oklahoma Earthquakes of 2011
--------------------------------------------------------------------------------
Are Seismicity Rate Changes in the Midcontinent Natural or Manmade?
ELLSWORTH, W. L., US Geological Survey, Menlo Park, CA, ; HICKMAN, S. H., US Geological Survey, Menlo Park, CA, ; LLEONS, A. L., US Geological Survey, Menlo Park, CA, ; MCGARR, A., US Geological Survey, Menlo Park, CA, ; MICHAEL, A. J., US Geological Survey, Menlo Park, CA, ; RUBINSTEIN, J. L., US Geological Survey, Menlo Park, CA,
A remarkable increase in the rate of M 3 and greater earthquakes is currently in progress in the US midcontinent. The average number of M >= 3 earthquakes/year increased starting in 2001, culminating in a six-fold increase over 20th century levels in 2001. Is this increase natural or manmade? To address this question, we take a regional approach to explore changes in the rate of earthquake occurrence in the midcontinent (defined here as 85° to 108° West, 25° to 50° North) using the USGS Preliminary Determination of Epicenters and National Seismic Hazard Map catalogs. These catalogs appear to be complete for M >= 3 since 1970. From 1970 through 2000, the rate of M >= 3 events averaged 21 +- 7.6/year in the entire region. This rate increased to 29 +- 3.5 from 2001 through 2008. In 2009, 2010 and 2011, 50, 87 and 134 events occurred, respectively. The modest increase that began in 2001 is due to increased seismicity in the coal bed methane field of the Raton Basin along the Colorado-New Mexico border west of Trinidad, CO. The acceleration in activity that began in 2009 appears to involve a combination of source regions of oil and gas production, including the Guy, Arkansas region, and in central and southern Oklahoma. Horton, et al. (2012) provided strong evidence linking the Guy, AK activity to deep waste water injection wells. In Oklahoma, the rate of M >= 3 events abruptly increased in 2009 from 1.2/year in the previous half-century to over 25/year. This rate increase is exclusive of the November 2011 M 5.6 earthquake and its aftershocks. A naturally-occurring rate change of this magnitude is unprecedented outside of volcanic settings or in the absence of a main shock, of which there were neither in this region. While the seismicity rate changes described here are almost certainly manmade, it remains to be determined how they are related to either changes in extraction methodologies or the rate of oil and gas production.
--------------------------------------------------------------------------------
Wednesday, April 18th / 3:45 PM Oral / Pacific Salon 4 & 5 "
"
edit on 30-3-2012 by ericblair4891 because: (no reason given)
edit on 30-3-2012 by ericblair4891 because: (no reason
given)
quakes.globalincidentmap.com...[/url]
Type: Earthquake
21 minutes ago
Magnitude: 3.1
DateTime: Saturday March 31 2012, 02:15:09 UTC
Region: Channel Islands region, California
Depth: 0.1 km
Source: USGS Feed
Type: Earthquake
3 hours ago
Magnitude: 3.4
DateTime: Friday March 30 2012, 23:29:59 UTC
Region: Canada
Depth: 46 km
Source: Natural Resources Canada Feed
Dito murkraz
Type: Earthquake
21 minutes ago
Magnitude: 3.1
DateTime: Saturday March 31 2012, 02:15:09 UTC
Region: Channel Islands region, California
Depth: 0.1 km
Source: USGS Feed
Type: Earthquake
3 hours ago
Magnitude: 3.4
DateTime: Friday March 30 2012, 23:29:59 UTC
Region: Canada
Depth: 46 km
Source: Natural Resources Canada Feed
Dito murkraz
edit on 30-3-2012 by azureskys because: added more
I am by no means an expert at reading or interpreting graphs, but I do have, I believe, a basic understanding of how seismo readings should and
shouldn't look. I check the stations around the U.S. only semi-regularly, but when checking just now, I found the graphs for the town of
Portageville, on the New Madrid fault, to be very interesting:
folkworm.ceri.memphis.edu...
Also, if you go back in the 12 hour increments day by day, they are all different and all showing what I believe to be definite seismic activity that is not showing on the USGS site. Because of the booms & smells being reported in the midwest, I figured asking someone to review this data wouldn't hurt.
Additionally, CERI stations and even stations listed on the USGS' ANSS show activity that seems to be centered around southern Illinois & Indiana tonite. It does not seem that there are any big "world quakes" causing these readings, and it is not showing up on graphs outside of the midwest.
Thanks
Hmm nothing larger than a 5.2 for 12 hours now not good. Stress is building somewhere and it can be huge in size when it releases.
quakes.globalincidentmap.com...
quakes.globalincidentmap.com...
Ok that resets things
quakes.globalincidentmap.com...
Magnitude: 5.2
DateTime: Saturday March 31 2012, 09:04:40 UTC
Region: south of the Fiji Islands
Depth: 543.5 km
Source: USGS Feed
So that was about a 12 hour span until another 5.2 size quake.
quakes.globalincidentmap.com...
Magnitude: 5.2
DateTime: Saturday March 31 2012, 09:04:40 UTC
Region: south of the Fiji Islands
Depth: 543.5 km
Source: USGS Feed
So that was about a 12 hour span until another 5.2 size quake.
Hmm what is this ????
Magnitude: 4.5
DateTime: Saturday March 31 2012, 09:18:38 UTC
Region: south of the Aleutian Islands
Depth: 10 km
and a
Magnitude: 4.6
DateTime: Saturday March 31 2012, 09:19:33 UTC
Region: Andreanof Islands, Aleutian Is.
Depth: 175 km
Not the same as they are apart
quakes.globalincidentmap.com...
Magnitude: 4.5
DateTime: Saturday March 31 2012, 09:18:38 UTC
Region: south of the Aleutian Islands
Depth: 10 km
and a
Magnitude: 4.6
DateTime: Saturday March 31 2012, 09:19:33 UTC
Region: Andreanof Islands, Aleutian Is.
Depth: 175 km
Not the same as they are apart
quakes.globalincidentmap.com...
edit on 4/5/2011 by dreamfox1 because: (no reason given)
Los Angeles Area in danger for a good size quake today.
abclocal.go.com...
quakes.globalincidentmap.com...
Increasing activity
7 Hours ago
Magnitude: 3.1
DateTime: Saturday March 31 2012, 02:15:09 UTC
Region: Channel Islands region, California
Depth: 0.1 km
Source: USGS Feed
and a few minutes ago
Magnitude: 3
DateTime: Saturday March 31 2012, 09:53:26 UTC
Region: Channel Islands region, California
Depth: 3.5 km
Source: USGS Feed
edit on 4/5/2011 by dreamfox1 because: (no reason given)
Pretty ironic I guess but here in So Calif I've felt 3 quakes not even listed,not real big ones perhaps 3's,oh well buisness as usual
reply to post by mountaingirl1111
This is more than lakely manmade activity, trains most probabaly.
For example:
This blog post on Puterman's Quakewatch Blog gives examples.
And indeed, if you look up the location of the helicorder, you will find the following:
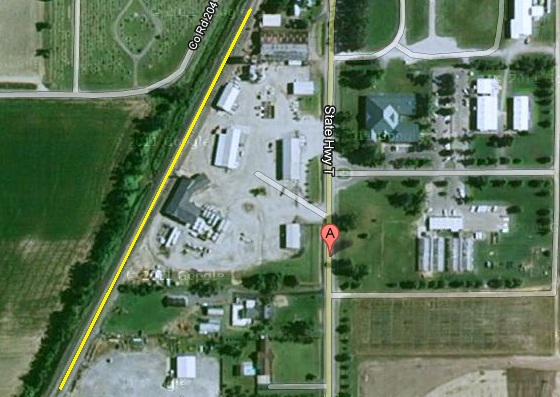
The "A" is the helicorder coordinates and the yellow line is is the location of a train track.
This is more than lakely manmade activity, trains most probabaly.
For example:
This blog post on Puterman's Quakewatch Blog gives examples.
And indeed, if you look up the location of the helicorder, you will find the following:
The "A" is the helicorder coordinates and the yellow line is is the location of a train track.
Originally posted by jadedANDcynical
reply to post by mountaingirl1111
This is more than lakely manmade activity, trains most probabaly.
For example:
This blog post on Puterman's Quakewatch Blog gives examples.
And indeed, if you look up the location of the helicorder, you will find the following:
The "A" is the helicorder coordinates and the yellow line is is the location of a train track.
Ah, thanks, Jaded
I do want to add to this that stations in s. Indiana, Kentucky, & Ilinois all picked up a moderate-looking quake before I posted this last night, according to ANSS, yet none were posted for the area on USGS and I did notice that for roughly the same time frame, CERI has blank spots . Does that mean anything? I just don't understand how a quake can register for a region and have it not be registered on the USGS site. Also, why would there be an "erased" area for just some of the helicorders, not all (if you look at others across the country, that gap isn't there, seems like a midwest & somewhat southern occurence). I have linked all of this, can someone please check it out? THanks!
Links to "quake" on ANSS helicorders:
Hopedale, Illinois:
earthquake.usgs.gov...
Wyandotte Cave, Indiana:
earthquake.usgs.gov...
Waverly, Tennessee:
earthquake.usgs.gov...
Absence of quake (& all data) on CERI helicorders:
Hopedale, Illinois:
folkworm.ceri.memphis.edu...
Wyandotte Cave, Indiana: (This one is very interesting because of how noticeable the "blank" is)
folkworm.ceri.memphis.edu...
Waverly, Tennessee:
folkworm.ceri.memphis.edu...
reply to post by mountaingirl1111
The "blanks" are due to telemetry drops, think data loss.
As far as those "quakes" go, I don't think any of those traces are actual quakes, but raqther more manmade activity.
Quakes don't (generally) have a slow build up like what is show in the traces you are linking to. A quake signature is much more abrupt at the beginning and then tapers off. Of course this depends on a number of factors; sensitivity of the instrument, distance of quake from the instrument, type of quake, size of quake, etc.
I don't know enough (very little actually) about reading the instruments, but I suspect that these are set to very sensitive levels and as a result are showing either manmade (train, semi truck, etc) or weather (such as wind) events.
I'm sure some of the more experienced wathers can give more details about the specific stations you are referencing and would have a better understanding, so take this for what it is worth.
Originally posted by jadedANDcynical
reply to post by mountaingirl1111
The "blanks" are due to telemetry drops, think data loss.
As far as those "quakes" go, I don't think any of those traces are actual quakes, but raqther more manmade activity.
Quakes don't (generally) have a slow build up like what is show in the traces you are linking to. A quake signature is much more abrupt at the beginning and then tapers off. Of course this depends on a number of factors; sensitivity of the instrument, distance of quake from the instrument, type of quake, size of quake, etc.
I don't know enough (very little actually) about reading the instruments, but I suspect that these are set to very sensitive levels and as a result are showing either manmade (train, semi truck, etc) or weather (such as wind) events.
I'm sure some of the more experienced wathers can give more details about the specific stations you are referencing and would have a better understanding, so take this for what it is worth.
Thanks for your reply I just figured they were quakes, since they all show up on the different stations at the same time and are far enough apart to rule out local activity, such as you pointed out with the train one (thank you for that, by the way). The same thing with the blanks, I just didn't know how the same area would be blank or have data dropped in different areas, but were fine in other parts of the country, just as the quake-like data didn't appear on helicorders in different parts of the country. Thanks for your time
reply to post by mountaingirl1111
I think the signatures you saw were from this earthquake.usgs.gov...
I checked the webis I watch in AR and saw the same thing at the same time frame, and this quake was listed soon after that. Close enough in time and distance to be the likely culprit.
I may be wrong, however... I`m still learning about all of this too
reply to post by dragonlover12
Thank you so much! See, I didn't think it was because of a quake, because I wasn't looking at the info as being in UTC time, which does make a difference, obviously! I feel so dumb Thanks so much, I appreciate you taking the time to reply to this!
Thank you so much! See, I didn't think it was because of a quake, because I wasn't looking at the info as being in UTC time, which does make a difference, obviously! I feel so dumb Thanks so much, I appreciate you taking the time to reply to this!
reply to post by JonoEnglish
Yes it is a beautiful place, and thats how it got so ( quakes created the mountains)
This one was eventually relocated 36.25km to the north west, under the eastern side of the Tararua Range, I'm on the west side, 37.2km from the final epi-centre
Felt bigger than a 4.5 to me, they put my location down as MM4 Intensity though. It can be deceptive here on the sand dunes, a 4.2 under the mountains to the east can feel as strong as a 4.8 in Cook Strait to the west.
Getting various magnitudes from different parts of Geonet,
Geonet Rapid says 4.6 now
Recent Quakes 4.5
and the Magma data says 4.522 (enter March 30 in both Date boxes)
some damage at Carterton, MM6
At the confluence of the Hector River, Waiohine River and Totara Creek, on the Wellington Fault BTW.
Just had a look on USGS, they have it , 4.8mb
I didn't expect to see it there, USGS usually have the magnitude less than Geonet.
shows on LISS SNZO, like I have said before the LISS system seems to be set up for long range quakes. SNZO is about 70km from the quake epi-centre. I'll ID those other ones later.
Yes it is a beautiful place, and thats how it got so ( quakes created the mountains)
This one was eventually relocated 36.25km to the north west, under the eastern side of the Tararua Range, I'm on the west side, 37.2km from the final epi-centre
Felt bigger than a 4.5 to me, they put my location down as MM4 Intensity though. It can be deceptive here on the sand dunes, a 4.2 under the mountains to the east can feel as strong as a 4.8 in Cook Strait to the west.
Getting various magnitudes from different parts of Geonet,
Geonet Rapid says 4.6 now
Recent Quakes 4.5
and the Magma data says 4.522 (enter March 30 in both Date boxes)
some damage at Carterton, MM6
edit on 31-3-2012 by muzzy because:
got my west and east mixed up
At the confluence of the Hector River, Waiohine River and Totara Creek, on the Wellington Fault BTW.
edit on 31-3-2012 by muzzy because: (no
reason given)
Just had a look on USGS, they have it , 4.8mb
I didn't expect to see it there, USGS usually have the magnitude less than Geonet.
shows on LISS SNZO, like I have said before the LISS system seems to be set up for long range quakes. SNZO is about 70km from the quake epi-centre. I'll ID those other ones later.
edit on 31-3-2012 by muzzy
because: (no reason given)
Magnitude 5.4
Date-Time
Saturday, March 31, 2012 at 17:06:43 UTC
Sunday, April 01, 2012 at 06:06:43 AM at epicenter
Time of Earthquake in other Time Zones
Location 20.155°S, 174.774°W
Depth 122.8 km (76.3 miles)
Region TONGA
Distances 116 km (72 miles) NNE of NUKU`ALOFA, Tonga
186 km (115 miles) SSW of Neiafu, Tonga
413 km (256 miles) E of Ndoi Island, Fiji
2113 km (1312 miles) NNE of Auckland, New Zealand
Location Uncertainty horizontal +/- 21.6 km (13.4 miles); depth +/- 13.5 km (8.4 miles)
Parameters NST= 48, Nph= 51, Dmin=761.4 km, Rmss=1.19 sec, Gp=101°,
M-type=body wave magnitude (Mb), Version=6
Source
Magnitude: USGS NEIC (WDCS-D)
Location: USGS NEIC (WDCS-D)
Event ID usc0008tl6
earthquake.usgs.gov...
shows on IRIS NIUE BHZ
no IRIS stations on Tongatapu , you would think that would be a good idea considering the number of quakes they have around there.
Not showing on LISS SNZO or any of the other South Pacific stations
reasonably deep, but not so much that it wouldn't show, 5.4 is not an insignificant size.
confirmed by GFZ
[shrugs shoulders and goes to work, because its going to rain for the next week from Tuesday, all over Easter Break ]
edit on 31-3-2012 by
muzzy because: (no reason given)
Reference Number: 3683370
NZST: Sun, Apr 1 2012 4:30 pm
Magnitude: 4.1
Depth: 6 km
Details: 110 km north of White Island
[View Felt Reports in Google Maps] [View event in Google Maps] Reference Number: 3683368
NZST: Sun, Apr 1 2012 4:24 pm
Magnitude: 4.7
Depth: 5 km
Details: 110 km north of White Island
[View Felt Reports in Google Maps] [View event in Google Maps] Reference Number: 3683361
NZST: Sun, Apr 1 2012 4:06 pm
Magnitude: 4.8
Depth: 3 km
Details: 110 km north of White Island
What do we think about the recent activies at White Island. We know its a big arse volcano.
new topics
-
Electrical tricks for saving money
Education and Media: 2 hours ago -
VP's Secret Service agent brawls with other agents at Andrews
Mainstream News: 4 hours ago -
Sunak spinning the sickness figures
Other Current Events: 4 hours ago -
Nearly 70% Of Americans Want Talks To End War In Ukraine
Political Issues: 5 hours ago -
Late Night with the Devil - a really good unusual modern horror film.
Movies: 6 hours ago -
Cats Used as Live Bait to Train Ferocious Pitbulls in Illegal NYC Dogfighting
Social Issues and Civil Unrest: 8 hours ago -
The Good News According to Jesus - Episode 1
Religion, Faith, And Theology: 10 hours ago
top topics
-
Cats Used as Live Bait to Train Ferocious Pitbulls in Illegal NYC Dogfighting
Social Issues and Civil Unrest: 8 hours ago, 8 flags -
Florida man's trip overseas ends in shock over $143,000 T-Mobile phone bill
Social Issues and Civil Unrest: 15 hours ago, 8 flags -
VP's Secret Service agent brawls with other agents at Andrews
Mainstream News: 4 hours ago, 8 flags -
Former Labour minister Frank Field dies aged 81
People: 17 hours ago, 4 flags -
HORRIBLE !! Russian Soldier Drinking Own Urine To Survive In Battle
World War Three: 12 hours ago, 3 flags -
Nearly 70% Of Americans Want Talks To End War In Ukraine
Political Issues: 5 hours ago, 3 flags -
Sunak spinning the sickness figures
Other Current Events: 4 hours ago, 3 flags -
Bobiverse
Fantasy & Science Fiction: 15 hours ago, 3 flags -
Electrical tricks for saving money
Education and Media: 2 hours ago, 3 flags -
Late Night with the Devil - a really good unusual modern horror film.
Movies: 6 hours ago, 2 flags
active topics
-
Electrical tricks for saving money
Education and Media • 3 • : Mike72 -
TLDR post about ATS and why I love it and hope we all stay together somewhere
General Chit Chat • 10 • : theshadowknows -
VP's Secret Service agent brawls with other agents at Andrews
Mainstream News • 31 • : WeMustCare -
Why to avoid TikTok
Education and Media • 20 • : 5thHead -
How ageing is" immune deficiency"
Medical Issues & Conspiracies • 32 • : annonentity -
-@TH3WH17ERABB17- -Q- ---TIME TO SHOW THE WORLD--- -Part- --44--
Dissecting Disinformation • 657 • : daskakik -
President BIDEN Vows to Make Americans Pay More Federal Taxes in 2025 - Political Suicide.
2024 Elections • 135 • : WeMustCare -
HORRIBLE !! Russian Soldier Drinking Own Urine To Survive In Battle
World War Three • 30 • : DaRAGE -
Spectrophilia - Women Who Have Had Affairs With Ghosts Say Spooks Are Better Lovers Than Real Men
Paranormal Studies • 32 • : burritocat -
Cats Used as Live Bait to Train Ferocious Pitbulls in Illegal NYC Dogfighting
Social Issues and Civil Unrest • 18 • : Xtrozero