It looks like you're using an Ad Blocker.
Please white-list or disable AboveTopSecret.com in your ad-blocking tool.
Thank you.
Some features of ATS will be disabled while you continue to use an ad-blocker.

Quake Watch 2012
page: 286share:
Thank you muzzy and Puter for your replies to my queries.
Agreed, it's a bit of a mess with the way all the different places do things differently. Would be great if they could ever actually agree to use a common standard but I don't suppose that's going to happen.
But one thing still puzzles me. Puter, that section for seismologists from ESMC where they seem to be averaging the various magnitudes to get theirs: though it does look like that's what they're doing, I can't see how that method could always give a reliable figure, as the scale are logarithimic and so doing what is really "linear" addition and then division from those various numbers has to have a degree of error in it.
Besides which, averaging that way (even using some algorithm) is only going to work if all the numbers they work from are based on the same scale. If some use Ms, others use Mw or Ml, and still others just use the mysterious "M" (sounds like a spy thriller! ), then it's something like trying to add (x) US Gallons to (y) UK Gallons and then dividing the (x=y) total to give an average number in a unit that might not even be one or the other..
It just doesn't make sense to me.
Got a spare straitjacket handy?
Oh, wanted to mention: muzzy, thanks also for the info on the Pacific Antarctic Ridge region. From what you've provided it seems that
"depth" is probably calculated from MSL (mean sea level), which means those quakes are physically even shallower in the crust than they might
otherwise appear.
I say it "seems" because as is often the case, we are left guessing, which reminds me of what Puter said about "GS" perhaps meaning GuesS. AFAIK, it's supposed to be an addendum used after a magnitude type and is meant to indicate the calculation came from "USGS" via NEIC in Colorado. However, it seems that sometimes they haven't figured the mag type so they just use GS, which is about as useful as -- ummm -- hair spray for dolphins.
I say it "seems" because as is often the case, we are left guessing, which reminds me of what Puter said about "GS" perhaps meaning GuesS. AFAIK, it's supposed to be an addendum used after a magnitude type and is meant to indicate the calculation came from "USGS" via NEIC in Colorado. However, it seems that sometimes they haven't figured the mag type so they just use GS, which is about as useful as -- ummm -- hair spray for dolphins.
reply to post by JustMike
I contacted GFZ earlier in 2012 and asked what the "M" meant, I forget the actual reason, but the guy said it was a mixture of mb and Mw and was "their best estimate".
Being in the construction industry I know what an "estimate" means , it means "best guess based on information given" and is just a guide for the customer, a ballpark figure, certainly not something to base signing a contract to undertake the work on.
So Puterman is right on the button, M means "guess" and I'd say GS means the same thing.
Checking the MTS data, if it is available, does seem to provide some better results, but often I forget to do that.
I did some more GFZ data collection for the creation of the Pacific Antarctic Ridge map.
Extended to the Macquarie Triple Junction in the west and to the Chile Trench in the East, from 2005 to 2012 (GFZ went public in 2004)
Interesting those oddball isolated quakes out away from the Plate Boundries, south of the Chatham islands and Southern Pacific Ocean, they could be errors.
I haven't matched up with ANSS yet to check those out, will do so if its rainy today.
I'd say if I had LDEO data for the same time period there would be 10 times the number of events on that map.
Edit:
I just found my LDEO data on Dropbox as KML files, so will reinstate that page, there will be gaps though, I started collecting data in Jun 5th and ended the last run in Aug 6th. I tried e-mailing LDEO when I was doing it asking if they had a catalog to access, but they never even had the courtesy to reply.
edit on 28-12-2012 by muzzy because: (no reason given)
edit on 28-12-2012 by muzzy because: (no reason
given)
just did a 5 day upload for Japan, NIED data, 22nd through 26th Dec inclusive.
mag1= 521
mag2= 308
mag3= 95
mag4= 18
mag5= 3
total= 945
TTNT released 3726.711
Still pumping them out at the Trench
I don't bother with the preliminary stuff anymore, although its always fresh when you download it,there are so many changes when its reviewed its hardly worth the effort.
a lot of work to do on Japan, a lot of work
edit on 28-12-2012 by muzzy because: (no reason given)
reply to post by JustMike
No, but why should that matter? There is no such thing as a reliable magnitude it seems. Could you just help me with the strings at the back of this thing? I might be able to find you one then. (straitjacket that is)
Oh, almost forgot. Along with Mi(5), "M" and various other clandestine magnitude scales we now have a new one
Source GeoScience, Australia.
3.7 AUST eh? Anyone have a conversion table for AUST to mb?
I can't see how that method could always give a reliable figure
No, but why should that matter? There is no such thing as a reliable magnitude it seems. Could you just help me with the strings at the back of this thing? I might be able to find you one then. (straitjacket that is)
Oh, almost forgot. Along with Mi(5), "M" and various other clandestine magnitude scales we now have a new one
2012-12-28 12:04:35, -24.173, 111.481, 3.7 AUST, 20.0, Offshore Western Australia. [F] +-+28+Dec+12++12%3A04%3A35+UTC)&ll=-24.17300,111.48100&sp n=2,2&f=d&t=h&hl=e][Map]
Source GeoScience, Australia.
3.7 AUST eh? Anyone have a conversion table for AUST to mb?
edit on 28/12/2012 by PuterMan because: (no reason given)
I am observing the 2013 thread and still all the action is in this one
reply to post by aLLeKs
That would be because, it is still 2012
Thanks for a great year of reporting folks!
That would be because, it is still 2012
Thanks for a great year of reporting folks!
Originally posted by PuterMan
reply to post by JustMike
[snip]
3.7 AUST eh? Anyone have a conversion table for AUST to mb?
No idea. But if it's an Australian thing then it probably hops around quite a lot, so it's going to be hard to pin it down.
Seriously though, this magnitude type thing is really getting out of hand. They should be trying to arrive at a common scale, but instead they're playing the "my scale is better'n yours" game.
However, regarding "M". According to McCalpin in this PDF (1.46 MB) that discusses some of the magnitude scales used, the final section is headed:
A.1.4 Moment Magnitude (Mw OR M)
So, when we see "M", we can read it as Mw and if that turns out to be wrong, we can blame McCalpin.
reply to post by JustMike
I think he will be taking much blame then as very rarely is it M for Mw from what I can see. M for Mysterious, M for Manual, M for Middling or, since most are under 5, M for Minute or Miniscule?
I often show this pic
which is the same as the one in the PDF but there is a further problem - that is just the tip of the iceberg. and mB is not the same scale as mb.
You might find a discussion by the earthquake god - sorry Kanamori - of the different type interesting.
Magnitude scale and quantification of earthquakes
I decided to stop trying to unpick the strait jacket. It is getting to be quite comfortable.
Forgot to add, just in case folks had not noticed, I put the weekly geophysical report for 28th up earlier.
So, when we see "M", we can read it as Mw and if that turns out to be wrong, we can blame McCalpin.
I think he will be taking much blame then as very rarely is it M for Mw from what I can see. M for Mysterious, M for Manual, M for Middling or, since most are under 5, M for Minute or Miniscule?
I often show this pic
which is the same as the one in the PDF but there is a further problem - that is just the tip of the iceberg. and mB is not the same scale as mb.
You might find a discussion by the earthquake god - sorry Kanamori - of the different type interesting.
Magnitude scale and quantification of earthquakes
I decided to stop trying to unpick the strait jacket. It is getting to be quite comfortable.
Forgot to add, just in case folks had not noticed, I put the weekly geophysical report for 28th up earlier.
edit on 29/12/2012 by PuterMan because: (no reason given)
I don't think we will ever figure this M, Mb, ML, Ms, Mwp, Mw, Md issue out.
Take a look at this Excel file I downloaded from GeoAu
They have the option of showing the various magnitude types, generally its ML, mb and Ms.
I tried to figure out the conversion method by working out the % difference between mb and MS.
There is no consistency whatsoever, even the 2 Bismark Sea events have a different % result in the calculation.
(If you want to do this yourself go here and click on "export data" button bottom right corner then select the options you want from there) or ( use the "add/remove feilds" button to see the mag types on the html page)
for those that don't have Excel here are the results,
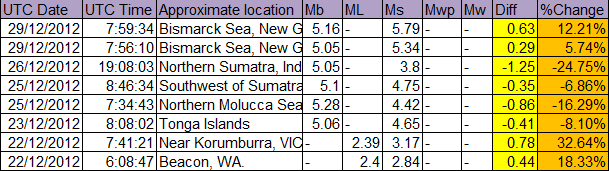
Maybe I'm being too simplistic in the method of conversion here, perhaps the % diff changes as the number increaces as well
Take a look at this Excel file I downloaded from GeoAu
They have the option of showing the various magnitude types, generally its ML, mb and Ms.
I tried to figure out the conversion method by working out the % difference between mb and MS.
There is no consistency whatsoever, even the 2 Bismark Sea events have a different % result in the calculation.
(If you want to do this yourself go here and click on "export data" button bottom right corner then select the options you want from there) or ( use the "add/remove feilds" button to see the mag types on the html page)
for those that don't have Excel here are the results,
Maybe I'm being too simplistic in the method of conversion here, perhaps the % diff changes as the number increaces as well
edit on 29-12-2012 by muzzy because: (no reason given)
Fortunately not shallow one.
2012-12-29 17:50:54.0 28min ago 35.86 N 70.65 E 129 5.8 HINDU KUSH REGION, AFGHANISTAN
Magnitude mb 5.8
Region HINDU KUSH REGION, AFGHANISTAN
Date time 2012-12-29 17:50:54.0 UTC
Location 35.86 N ; 70.65 E
Depth 129 km
Distances 200 km NE Kabul (pop 3,043,532 ; local time 22:20:54.6 2012-12-29)
159 km N Jalalabad (pop 200,331 ; local time 22:20:54.6 2012-12-29)
101 km W Chitral (pop 36,094 ; local time 22:50:54.6 2012-12-29)
www.emsc-csem.org...
edit on 29-12-2012 by MariaLida because: (no reason given)
Re. the 2 Bismark Sea quakes.
I wonder why the bigger one had such a huge S Wave signal?, on the lists its just a ho-hum regular mid 5 quake at sea,but that is because its presented in mb.
look at the SNZO graph of it
it looks like a mag 6 to me

compare that to this one New Ireland 6.1 (its the closest graph location wise I have on file)
only problem is I didn't mark the source on the NI graph so that mag type could also be Ms
I wonder why the bigger one had such a huge S Wave signal?, on the lists its just a ho-hum regular mid 5 quake at sea,but that is because its presented in mb.
look at the SNZO graph of it
it looks like a mag 6 to me
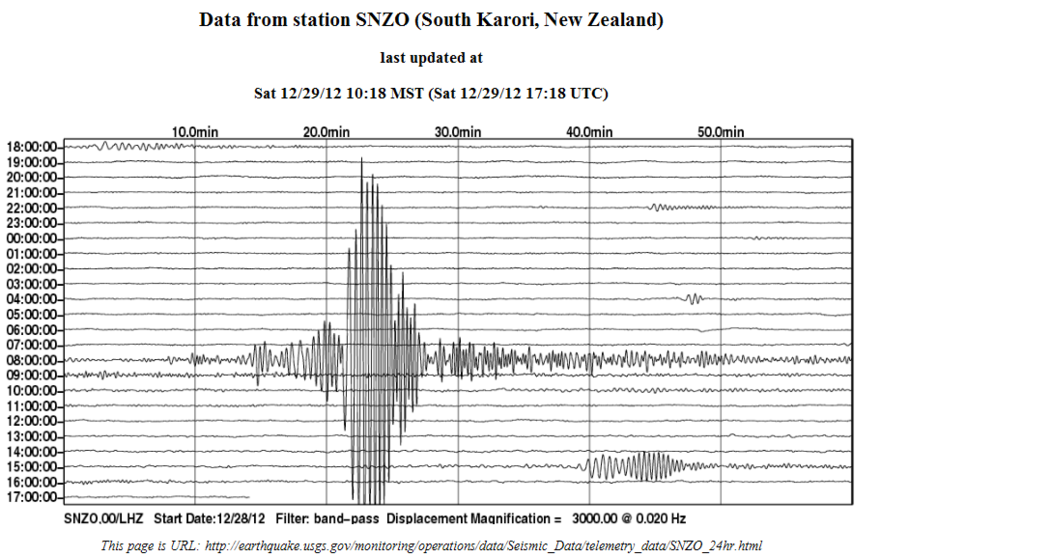
compare that to this one New Ireland 6.1 (its the closest graph location wise I have on file)
only problem is I didn't mark the source on the NI graph so that mag type could also be Ms
GFZ
5.4Unk, 2012-12-29 07:59:18, 3.28°S, 149.03°E, 10, Bismarck Sea
4.8Unk, 2012-12-29 07:56:03, 3.31°S, 148.91°E, 10, Bismarck Sea
USG
5.5mb 2012/12/29 07:59:16 -3.353 148.722 10.2 BISMARCK SEA
5.0mb 2012/12/29 07:56:01 -3.361 148.653 9.9 BISMARCK SEA
RAS
5.4mb, 2012-12-29 07:59:14.9, -3.33, 148.68, 10, Bismarck Sea
5.0mb, 2012-12-29 07:55:58.0, -3.29, 148.74, 10, Bismarck Sea
GEOAU
5.16mb/ 5.79Ms, 29/12/2012 7:59:34, Bismarck Sea, New Guinea.
5.05mb/5.34Ms, 29/12/2012 7:56:10, Bismarck Sea, New Guinea.
LDEO
6.0Ms, 2012/12/ 29 7:59:44.0, -3.25, 148.75, 33.0 , BISMARCK SEA
sources: as marked
edit on 29-12-2012 by muzzy because: (no reason given)
reply to post by muzzy
If that is Ms then that is measuring the surface wave as opposed to the first few seconds of the P wave. LDEO also measure the surface wave. There is no direct correlation between Ms and mb as the characteristics of the surface wave will be dependant on the geology it passes through, sort of similar to the huge difference in effect between a mag 5 in California and a mag 5 in the east/central US.
I note that Potsdam are using the Unk scale. Of course many sources also use the Unk scale but convert to mb or Mw. Unk is usually higher than the other scales except Ms. The approximate conversion from Unk to mb is 0.75 and to Mw is 0.81 thus a 5.4 Unk becomes 4.1 mb or 4.4 Mw if the area is one of which the public are aware. The conversion rates for areas not in the public eye are 0.9 to convert to mb giving 4.9 on a 5.4 Unk, and 0.93 to convert to Mw giving 5.0 Mw on a 5.4 Unk.
Perhaps we should just use the SS magnitudes (Subjective scale)
Zz - about mag 1.0 or less
Eh - about mag 2
Hey! - about Mag 3
Wow!! - about Mag 4
JCOB - about mag 5
JCWTH - about Mag 6
OMGWTF - about Mag 7
OMGJCWTFWTINPM - about Mag 8
OMGIJSMP - about Mag 9
Please do not ask for a translation of the terms. They are subjective
edit on 29/12/2012 by PuterMan because: (no reason given)
These quakes are very small, but it is a burst of activity over the past hour in an area that doesn't move everyday; and a large EQ in this spot would
prove disastrous...
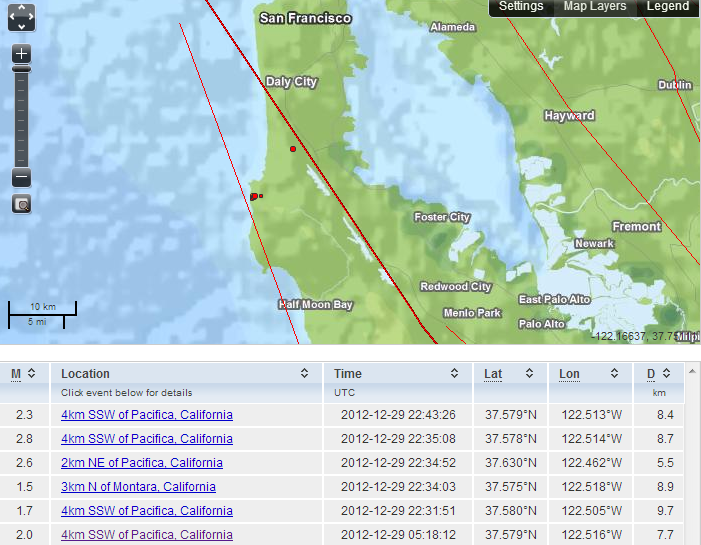
The NDEDC (Northern California Earthquake Data Center) even posted a First Motion focal mechanism for the 2.8 Ml.
ETA:reply to post by PuterMan
LMAO
"OMGIJSMP =about a Mag 9" This works for me.
It looks like USGS added 2 more quakes in this area since I first posted:
M Location TimeUTC Lat Lon Dkm
1.8 3km N of Montara, California 2012-12-29 22:49:10 37.578°N 122.511°W 8.7
2.5 3km N of Montara, California 2012-12-29 22:47:34 37.578°N 122.516°W 8.8
2.3 4km SSW of Pacifica, California 2012-12-29 22:43:26 37.579°N 122.513°W 8.4
2.8 4km SSW of Pacifica, California 2012-12-29 22:35:08 37.578°N 122.514°W 8.7
2.6 2km NE of Pacifica, California 2012-12-29 22:34:52 37.630°N 122.462°W 5.5
1.5 3km N of Montara, California 2012-12-29 22:34:03 37.575°N 122.518°W 8.9
1.7 4km SSW of Pacifica, California 2012-12-29 22:31:51 37.580°N 122.505°W 9.7
2.0 4km SSW of Pacifica, California 2012-12-29 05:18:12 37.579°N 122.516°W 7.7
The NDEDC (Northern California Earthquake Data Center) even posted a First Motion focal mechanism for the 2.8 Ml.
ETA:reply to post by PuterMan
LMAO
"OMGIJSMP =about a Mag 9" This works for me.
edit on 12/29/2012 by Olivine because: laughing with Puters
It looks like USGS added 2 more quakes in this area since I first posted:
M Location TimeUTC Lat Lon Dkm
1.8 3km N of Montara, California 2012-12-29 22:49:10 37.578°N 122.511°W 8.7
2.5 3km N of Montara, California 2012-12-29 22:47:34 37.578°N 122.516°W 8.8
2.3 4km SSW of Pacifica, California 2012-12-29 22:43:26 37.579°N 122.513°W 8.4
2.8 4km SSW of Pacifica, California 2012-12-29 22:35:08 37.578°N 122.514°W 8.7
2.6 2km NE of Pacifica, California 2012-12-29 22:34:52 37.630°N 122.462°W 5.5
1.5 3km N of Montara, California 2012-12-29 22:34:03 37.575°N 122.518°W 8.9
1.7 4km SSW of Pacifica, California 2012-12-29 22:31:51 37.580°N 122.505°W 9.7
2.0 4km SSW of Pacifica, California 2012-12-29 05:18:12 37.579°N 122.516°W 7.7
edit on 12/29/2012 by Olivine because: add info
edit on 12/29/2012 by Olivine because: (no reason given)
edit
on 12/29/2012 by Olivine because: because I cannot count
reply to post by Olivine
I just posted about this on the PNSN FB site...wondering which fault/mechanism would be involved in this area. I can't recall ever seeing a cluster/maybe swarm in this spot before. They're shallow too, at just 3-5 miles deep.
Is this it's own fault, or could they be seen as maybre precurors to the San Andreas??
Hello,
I've been reading about research that was done with prior large quakes, such as Japan in relation to atmospheric conditions changing prior to a quake. Do any of you know a site that considers these data points so I can review?
Japan paper on atmospheric conditions changing
I guess what I'm saying is there a software application that considers these types of data?
earthquake precursor paper
I've been reading about research that was done with prior large quakes, such as Japan in relation to atmospheric conditions changing prior to a quake. Do any of you know a site that considers these data points so I can review?
Japan paper on atmospheric conditions changing
I guess what I'm saying is there a software application that considers these types of data?
Earthquake precursors • Planetary positions • Ground deformations • Geomagnetic methods • Energy accumulation rate • Earthquake clouds • Gravity anomalies • Ground water level • Radon concentrations • Meteorological conditions • Thermal infrared • Infrasound • Crustal stress • Abnormal behaviour of animals • Geo-electric pulse • Historical/statistical data • Ground-based EM field • Tilt meters • GPS • TGFR • MS-Double Time Method • Geo-electricity • Micro-vibration • Earth resistivity • Geochemistry • Seismic gap • Foreshocks • Geodesy • Micro-changes • Ionosphere
earthquake precursor paper
edit on 29-12-2012 by curiouswa because: add gwu.edu
paper
I just read about these same small quakes at GLP, and was shocked that people are laughing about it. That much activity all at once should mean that
people be leery. Its not a normal thing in that area. However this also happened before the big quake out there the last time, so we all may want to
watch for more activity over the next week.
reply to post by westcoast
Hi Westcoast. Looking at this USGS map, all but one of these quakes was on/near the San Gregorio fault, which runs parallel to the San Andreas.
This USGS webpage gives more information about the percentages on the Bay Area map I linked above. But from what I can discern, The San Gregario has a 10% chance of generating a Mag 6.7 during the 30 years between 2002-2032.
Fukushima just had a JCOB.1
Glad it wasn't another OMGWTF
P
Glad it wasn't another OMGWTF
P
edit on 29/12/2012 by pheonix358 because: (no reason given)
new topics
-
Electrical tricks for saving money
Education and Media: 46 minutes ago -
VP's Secret Service agent brawls with other agents at Andrews
Mainstream News: 2 hours ago -
Sunak spinning the sickness figures
Other Current Events: 2 hours ago -
Nearly 70% Of Americans Want Talks To End War In Ukraine
Political Issues: 2 hours ago -
Late Night with the Devil - a really good unusual modern horror film.
Movies: 4 hours ago -
Cats Used as Live Bait to Train Ferocious Pitbulls in Illegal NYC Dogfighting
Social Issues and Civil Unrest: 6 hours ago -
The Good News According to Jesus - Episode 1
Religion, Faith, And Theology: 8 hours ago -
HORRIBLE !! Russian Soldier Drinking Own Urine To Survive In Battle
World War Three: 10 hours ago
top topics
-
SETI chief says US has no evidence for alien technology. 'And we never have'
Aliens and UFOs: 16 hours ago, 8 flags -
Cats Used as Live Bait to Train Ferocious Pitbulls in Illegal NYC Dogfighting
Social Issues and Civil Unrest: 6 hours ago, 8 flags -
Florida man's trip overseas ends in shock over $143,000 T-Mobile phone bill
Social Issues and Civil Unrest: 13 hours ago, 8 flags -
VP's Secret Service agent brawls with other agents at Andrews
Mainstream News: 2 hours ago, 6 flags -
Former Labour minister Frank Field dies aged 81
People: 15 hours ago, 4 flags -
Bobiverse
Fantasy & Science Fiction: 12 hours ago, 3 flags -
HORRIBLE !! Russian Soldier Drinking Own Urine To Survive In Battle
World War Three: 10 hours ago, 3 flags -
Nearly 70% Of Americans Want Talks To End War In Ukraine
Political Issues: 2 hours ago, 3 flags -
Sunak spinning the sickness figures
Other Current Events: 2 hours ago, 3 flags -
Late Night with the Devil - a really good unusual modern horror film.
Movies: 4 hours ago, 2 flags
active topics
-
VP's Secret Service agent brawls with other agents at Andrews
Mainstream News • 17 • : AwakeNotWoke -
NASA Researchers Discover a Parallel Universe That Runs Backwards through Time - Alongside Us
Space Exploration • 71 • : charlyv -
Sunak spinning the sickness figures
Other Current Events • 4 • : annonentity -
Cats Used as Live Bait to Train Ferocious Pitbulls in Illegal NYC Dogfighting
Social Issues and Civil Unrest • 12 • : Hakaiju -
HORRIBLE !! Russian Soldier Drinking Own Urine To Survive In Battle
World War Three • 28 • : budzprime69 -
Huge ancient city found in the Amazon.
Ancient & Lost Civilizations • 61 • : Therealbeverage -
The Reality of the Laser
Military Projects • 43 • : 5thHead -
Should Biden Replace Harris With AOC On the 2024 Democrat Ticket?
2024 Elections • 49 • : Therealbeverage -
WF Killer Patents & Secret Science Vol. 1 | Free Energy & Anti-Gravity Cover-Ups
General Conspiracies • 32 • : Arbitrageur -
Is there a hole at the North Pole?
ATS Skunk Works • 38 • : Therealbeverage