It looks like you're using an Ad Blocker.
Please white-list or disable AboveTopSecret.com in your ad-blocking tool.
Thank you.
Some features of ATS will be disabled while you continue to use an ad-blocker.

Quake Watch 2012
page: 183share:
Felt this one just now
was up on Geonet Rapid right away, already 2 minutes had past by the time I got the page up
just a strong wobbling, no rattling.
Bet they felt it good in the Wairarapa
confirmed
G Rapid a bit out with the location
well gosh lookie here
usgs - 4.9mb
Public ID 2012p560243
Universal Time July 26 2012 at 6:57:46
NZ Standard Time Thursday, July 26 2012 at 6:57:46 pm
Latitude, Longitude -40.73, 176.48
Intensity ? moderate
Focal Depth 46 km
Magnitude 5.2
Location 30 km north-east of Castlepoint
Agency WEL(GNS_Primary)
Status ? automatic
Quality ? good
was up on Geonet Rapid right away, already 2 minutes had past by the time I got the page up
just a strong wobbling, no rattling.
Bet they felt it good in the Wairarapa
edit on 26-7-2012 by muzzy because: (no reason given)
confirmed
Reference Number 3745640
Universal Time July 26 2012 at 6:57
NZ Standard Time Thursday, July 26 2012 at 6:57 pm
Latitude, Longitude 40.50°S, 176.14°E
Focal Depth 30 km
Richter magnitude 5.2
Region Wairarapa
Location
10 km north-west of Pongaroa
30 km east of Pahiatua
30 km south of Dannevirke
50 km east of Palmerston North
150 km north-east of Wellington
www.geonet.org.nz...
G Rapid a bit out with the location
edit on 26-7-2012 by muzzy because: (no reason given)
well gosh lookie here
usgs - 4.9mb
edit on 26-7-2012 by muzzy because: (no reason
given)
reply to post by muzzy
Get the feeling that things are heating up in the North Island and around the islands...sorta like a line thru the Kermadecs.
Hope it's helping to release build-up energies in stages, rather than a mega release.
Get the feeling that things are heating up in the North Island and around the islands...sorta like a line thru the Kermadecs.
Hope it's helping to release build-up energies in stages, rather than a mega release.
F-E Region: Mauritius/Reunion Region
6.6 (Mw)
Time: 2012-07-26 05:33:34.6 UTC
Magnitude: 6.6 (Mw)
Epicenter: 66.21°E 17.60°S
Depth: 10 km
Status: M - manually revised
geofon.gfz-potsdam.de...
usgs only has 5.9mb for that earthquake.usgs.gov...
They updated it to a 6.7. That's a 6.5, 6.4 and 6.7 in just a little over 24 hours.
Latest Earthquakes in the World - Past 7 days
Also,

Latest Earthquakes in the World - Past 7 days
Also,
edit on 26/7/12 by murkraz because: (no reason given)
I have been racking my brains ever since that quake happened. USGS had that as 5.8, and yet I've been getting S-wave readouts from a much bigger
quake, all over the place. Couldn't figure that out. Holy mother of upgrades, from 5.8 to 6.7, nearly a full order of magnitude.
neic.usgs.gov...
There it is from the initial details, which haven't changed yet to the new mag. of 6.7.
Historic Seismicity
Magnitude 5.8 MAURITIUS - REUNION REGION
Thursday, July 26, 2012 at 05:33:31 UTC
neic.usgs.gov...
There it is from the initial details, which haven't changed yet to the new mag. of 6.7.
edit on Thu Jul 26th 2012 by TrueAmerican because: (no
reason given)
Makes sense with no prior history of large or great quakes in the vicinity since record-keeping began. I thought the same thing, "How could USGS have
missed THAT?"
reply to post by TrueAmerican
EMSC still have 5.8mb.
I don't think that is a 6.7 either.
Can't check anything as it looks as if IRIS is down.
SCARDEC have 6.6 Mw
reply to post by murkraz
No prior? 100km radius (Not everywhere gets Mag 7+ )
Source
And 50km radius - same source
The Centennial Catalogue only has these (based on a 1° spread - approx 117 miles or 58 mile radius ):
EMSC still have 5.8mb.
I don't think that is a 6.7 either.
Can't check anything as it looks as if IRIS is down.
SCARDEC have 6.6 Mw
reply to post by murkraz
Makes sense with no prior history of large or great quakes in the vicinity since record-keeping began. I thought the same thing, "How could USGS have missed THAT?"
No prior? 100km radius (Not everywhere gets Mag 7+ )
CAT YEAR MO DA ORIG TIME LAT LONG DEP MAGNITUDE IEM DTSVNWG DIST
NFO km
TF
PDE 1974 12 09 105007.90 -17.02 66.87 33 5.0 mbGS ... ....... 83
PDE 1979 08 22 122411.70 -17.55 66.04 10 5.3 mbGS ... ....... 34
PDE 1980 04 14 191155.60 -17.20 66.79 10 5.7 MsGS ... ....... 62
PDE 1981 11 07 094255.43 -17.09 66.69 10 6.0 mbGS ..M ....... 65
PDE 1982 11 25 003628.67 -17.05 66.88 10 5.0 mbGS ... ....... 80
PDE 1983 08 12 111449.09 -17.79 65.82 10 5.4 MsGS ... ....... 61
PDE 1984 09 17 064143.28 -18.04 65.64 10 5.8 MsGS ..M ....... 90
PDE 1988 05 04 000132.08 -17.33 66.63 10 5.2 mbGS ..M ....... 40
PDE 1990 03 07 182203.19 -17.30 66.68 10 5.2 mbGS ..M ....... 46
PDE 1991 11 05 211616.02 -16.91 66.16 10 6.0 MsGS ..M ....... 78
PDE 1992 12 16 094940.99 -17.14 66.92 10 5.4 MwHRV ..M ....... 77
PDE 1995 05 06 205903.25 -17.04 66.94 10 5.3 MwHRV ..M ....... 86
PDE 1995 06 27 211256.21 -17.17 66.87 10 5.5 MwHRV ..M ....... 70
PDE 1995 09 17 170920.62 -17.09 66.71 8 6.5 MwHRV ..M ....... 66
PDE 1995 09 17 231440.04 -17.50 65.96 10 5.0 mbGS ... ....... 43
PDE 1996 08 22 193709.48 -17.32 66.76 10 5.1 MwHRV ..M ....... 52
PDE 2000 01 22 211431.76 -17.66 66.86 10 5.5 MwHRV ..M ....... 52
PDE 2003 05 28 161518.94 -17.65 66.12 10 6.2 MwGS ..M ....... 26
PDE 2004 02 26 203221.85 -18.17 66.42 10 6.3 MwHRV ..M ....... 64
PDE 2006 06 28 160637 -17.59 65.90 10 5.3 MwHRV ..M ....... 48
PDE 2006 07 12 230620.26 -17.64 65.77 10 5.5 MwHRV ..M ....... 63
PDE 2006 08 30 161339.71 -17.65 65.94 10 5.7 MwHRV ..M ....... 44
PDE 2007 01 07 101437.61 -17.67 65.73 10 5.1 MwGCMT ..M ....... 67
PDE 2007 04 04 195803.80 -17.23 66.79 10 5.9 MwGCMT ..M ....... 60
PDE 2008 06 11 161053.62 -17.94 65.52 10 5.3 MwGCMT ..M ....... 96
PDE 2008 10 09 023334.10 -17.33 66.54 10 5.0 MwGCMT ..M ....... 34
PDE 2009 03 09 034423.32 -17.18 66.80 10 5.2 MwGCMT ..M ....... 64
PDE 2009 05 11 213705.84 -17.25 66.64 10 5.0 MwGCMT ..M ....... 48
PDE 2009 10 12 031547.28 -17.10 66.69 10 6.2 MwGCMT ..M ....... 64
PDE 2009 12 18 073259.66 -17.73 65.87 10 5.8 MwUCMT ..M ....... 54
PDE 2010 08 16 033053.31 -17.76 65.65 9 6.3 MwUCMT ..M ....... 78
PDE-W 2011 12 23 175157.94 -17.44 66.34 10 5.1 mbGS ... ....... 17
PDE-Q 2012 07 07 224920.08 -17.08 66.88 10 5.0 mbGS ... ....... 78
Source
And 50km radius - same source
CAT YEAR MO DA ORIG TIME LAT LONG DEP MAGNITUDE IEM DTSVNWG DIST
NFO km
TF
PDE 1979 08 22 122411.70 -17.55 66.04 10 5.3 mbGS ... ....... 34
PDE 1988 05 04 000132.08 -17.33 66.63 10 5.2 mbGS ..M ....... 40
PDE 1990 03 07 182203.19 -17.30 66.68 10 5.2 mbGS ..M ....... 46
PDE 1995 09 17 231440.04 -17.50 65.96 10 5.0 mbGS ... ....... 43
PDE 2003 05 28 161518.94 -17.65 66.12 10 6.2 MwGS ..M ....... 26
PDE 2006 06 28 160637 -17.59 65.90 10 5.3 MwHRV ..M ....... 48
PDE 2006 08 30 161339.71 -17.65 65.94 10 5.7 MwHRV ..M ....... 44
PDE 2008 10 09 023334.10 -17.33 66.54 10 5.0 MwGCMT ..M ....... 34
PDE 2009 05 11 213705.84 -17.25 66.64 10 5.0 MwGCMT ..M ....... 48
PDE-W 2011 12 23 175157.94 -17.44 66.34 10 5.1 mbGS ... ....... 17
The Centennial Catalogue only has these (based on a 1° spread - approx 117 miles or 58 mile radius ):
1979-08-22T12:24:15.490Z -17.51400 66.03100 6.0000 Mw 19.9000
1980-04-14T19:11:58.040Z -17.15300 66.74800 6.3000 Mw 11.7000
1981-11-07T09:42:55.930Z -17.33500 66.63000 6.5000 Mw 10.0000
1983-08-12T11:14:57.300Z -17.43200 66.10300 6.0000 Mw 30.0000
1988-05-04T00:01:35.830Z -17.29300 66.58400 5.9000 Mw 18.5000
1990-03-07T18:22:05.400Z -17.30600 66.62900 5.9000 Mw 12.2000
1991-11-05T21:16:15.170Z -17.62400 65.91800 6.5000 Mw 12.4000
1995-09-17T17:09:22.600Z -17.13000 66.65600 6.5000 Mw 11.2000
2000-01-22T21:14:34.210Z -17.59200 66.68400 5.5000 Mw 15.0000
edit on 26/7/2012 by PuterMan because: (no reason given)
Originally posted by PuterMan
No prior? 100km radius (Not everywhere gets Mag 7+ )
True, true, lol
Have there been any 8-9 mags in that Mid Southern Indian Ocean zone before? Closer to Madagascar?
reply to post by murkraz
Not according to Utsu goo.gl...
All Mag 8 + Quakes 314-2012
Not according to Utsu goo.gl...
All Mag 8 + Quakes 314-2012
edit on 27-7-2012 by muzzy because: there is a rouge icon on that map, in Japan, that kind of thing drives me crazy, probably an editing error
on my part, now I'll have to go find it and fix it
edit on 27-7-2012 by muzzy because: OK fixed that, was a
default GE icon marker on 1099/2/16 Mag 8.2 Japan: Wakayama coast, Honshu
edit on 27-7-2012 by muzzy because: just an edit to
edit the edit
edit on 27-7-2012 by muzzy because: arrghh an edit to edit the edit of the edit, I had "and" instead of "an"
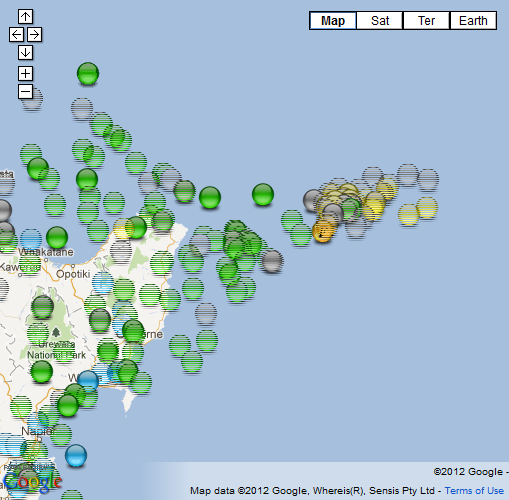
Not sure if that 5.8 quake at the Hikurangi Plateau ( NE of East Cape, NZ) on July 21st may have triggered a swarm to the NE of the mainshock or this
is aftershocks of that, the multiple 4's really only started yesterday, although Geonet Rapid have been posting hits all week from the area (
automatic readings, unconfirmed)
this is a map of Geonet Rapid (faded icons) and Geonet Preliminary data (solid icons) combined, 21-27July 2012 goo.gl...
screenshot
the IRIS URH station graphs confirm the multiple hits yesterday
www.iris.edu...
this is a map of Geonet Rapid (faded icons) and Geonet Preliminary data (solid icons) combined, 21-27July 2012 goo.gl...
screenshot
the IRIS URH station graphs confirm the multiple hits yesterday
www.iris.edu...
BTW do we really need that USA political claptrap junk www.unpartial.com advertising on each side of the editing window?
I say NO
get rid of it mods.!
Whoever put it up didn't even get it to fit the window
I for one don't give a rats arse about US politics, they are all a waste of time (politicians)
I say NO
get rid of it mods.!
Whoever put it up didn't even get it to fit the window
I for one don't give a rats arse about US politics, they are all a waste of time (politicians)
edit on 27-7-2012 by muzzy because: (no reason
given)
Two interesting little quakes directly North of the Capital of Iran.

reply to post by murkraz
OK I'll bite............... why?
Well what I find interesting is how USGS have taken an ML reading and converted it to mb and the mb has ended up being larger than ML, the dead opposite of what happens for quakes USGS report from New Zealand (and probably other places as well)
How can this be?
for the one at 2012/07/27 21:19:30
The International Institute of Earthquake Engineering and Seismology of Iran (IIEES) has 4.1ML location uncertainty +/- lat 3.2km, long 5.6km
USGS has mb = 4.2 ( 14) ML = 3.8 ( 2) location uncertainty +/- 24.7 km
for the other one at 2012/07/27 21:39:10
IIEES has 4.2ML location uncertainty +/- lat 5km, long 7.6km
USGS has mb = 4.4 ( 27) ML = 3.9 ( 4) location uncertainty +/- 20.4 km
given the location accuracy alone, I'd go with the Iranians estimates.
EMSC just as confusing
4.3mb for both
21:19:28
21:39:06
Stop teasing me into looking at USGS, I'm trying to avoid their inaccurate reporting
ETA: Just to test my observation I went through the "light-strong" quakes for the last few days on the USGS 7 days list and checked the ones that had an ML reading in the phase data.
Actually its about 50/50 whether they go up or down when comparing ML to mb
mb LOWER
Bosnia and Herzegovina ~ mb = 4.6 ( 27) ML = 4.7 ( 62)
Volcano Islands ~ mb = 4.6 ( 1) ML = 4.9 ( 2)
SW Siberia ~ mb = 4.7 ( 59) ML = 5.1 ( 2)
Mariana Islands ~ mb = 5.4 (346) ML = 6.0 ( 4)
Tonga ~ mb = 5.4 (193) ML = 6.0 ( 4)
Kermadec Islands ~ mb = 4.9 ( 49) ML = 5.1 ( 10)
Philippines ~ mb = 4.8 ( 67) ML = 5.3 ( 8)
Philippines ~ mb = 4.5 ( 1) ML = 4.6 ( 8)
Simeule ~ mb = 4.9 ( 16) ML = 5.2 ( 4)
mb HIGHER
Guatemala ~ mb = 4.2 ( 45) ML = 3.8 ( 7)
Guatemala ~ mb = 4.7 (201) ML = 4.3 ( 10)
New Britain ~ mb = 4.9 (129) ML = 4.4 ( 4)
Philippines ~ mb = 4.4 ( 16) ML = 3.9 ( 18)
Loyalty Islands ~ mb = 5.2 (129) ML = 5.0 ( 2)
Taiwan ~ mb = 4.7 ( 1) ML = 4.2 ( 18)
Hindu Kush ~ mb = 4.7 ( 33) ML = 3.8 ( 1)
N Indian Ocean ~`mb = 6.0 (198) ML = 5.9 ( 14)
SAME
NI New Zealand ~ mb = 4.9 ( 1) ML = 4.9 ( 29) [Geonet was 5.2ML]
so a 3.8ML in the Hindu Kush is 4.7mb, but a 3.8ML in Guatemala is a 4.2mb
Its beyond me
OK I'll bite............... why?
Well what I find interesting is how USGS have taken an ML reading and converted it to mb and the mb has ended up being larger than ML, the dead opposite of what happens for quakes USGS report from New Zealand (and probably other places as well)
How can this be?
for the one at 2012/07/27 21:19:30
The International Institute of Earthquake Engineering and Seismology of Iran (IIEES) has 4.1ML location uncertainty +/- lat 3.2km, long 5.6km
USGS has mb = 4.2 ( 14) ML = 3.8 ( 2) location uncertainty +/- 24.7 km
for the other one at 2012/07/27 21:39:10
IIEES has 4.2ML location uncertainty +/- lat 5km, long 7.6km
USGS has mb = 4.4 ( 27) ML = 3.9 ( 4) location uncertainty +/- 20.4 km
given the location accuracy alone, I'd go with the Iranians estimates.
EMSC just as confusing
4.3mb for both
21:19:28
21:39:06
Stop teasing me into looking at USGS, I'm trying to avoid their inaccurate reporting
edit on 28-7-2012 by muzzy because: (no reason
given)
ETA: Just to test my observation I went through the "light-strong" quakes for the last few days on the USGS 7 days list and checked the ones that had an ML reading in the phase data.
Actually its about 50/50 whether they go up or down when comparing ML to mb
mb LOWER
Bosnia and Herzegovina ~ mb = 4.6 ( 27) ML = 4.7 ( 62)
Volcano Islands ~ mb = 4.6 ( 1) ML = 4.9 ( 2)
SW Siberia ~ mb = 4.7 ( 59) ML = 5.1 ( 2)
Mariana Islands ~ mb = 5.4 (346) ML = 6.0 ( 4)
Tonga ~ mb = 5.4 (193) ML = 6.0 ( 4)
Kermadec Islands ~ mb = 4.9 ( 49) ML = 5.1 ( 10)
Philippines ~ mb = 4.8 ( 67) ML = 5.3 ( 8)
Philippines ~ mb = 4.5 ( 1) ML = 4.6 ( 8)
Simeule ~ mb = 4.9 ( 16) ML = 5.2 ( 4)
mb HIGHER
Guatemala ~ mb = 4.2 ( 45) ML = 3.8 ( 7)
Guatemala ~ mb = 4.7 (201) ML = 4.3 ( 10)
New Britain ~ mb = 4.9 (129) ML = 4.4 ( 4)
Philippines ~ mb = 4.4 ( 16) ML = 3.9 ( 18)
Loyalty Islands ~ mb = 5.2 (129) ML = 5.0 ( 2)
Taiwan ~ mb = 4.7 ( 1) ML = 4.2 ( 18)
Hindu Kush ~ mb = 4.7 ( 33) ML = 3.8 ( 1)
N Indian Ocean ~`mb = 6.0 (198) ML = 5.9 ( 14)
SAME
NI New Zealand ~ mb = 4.9 ( 1) ML = 4.9 ( 29) [Geonet was 5.2ML]
edit on 28-7-2012 by muzzy because: (no reason given)
so a 3.8ML in the Hindu Kush is 4.7mb, but a 3.8ML in Guatemala is a 4.2mb
Its beyond me
edit on 28-7-2012 by muzzy because: (no reason given)
Never scared of a challenge I've registered with NEID (Japan) and have access to all their data now, I am thinking of doing an interactive map of the
data behind this map, or individual
daily maps if its easier on my laptop's memory,
the data available is from Jun 03, 2002 ~ Jul 24, 2012
461 events for the 24th July
Is there any interest from here in this info?
the data available is from Jun 03, 2002 ~ Jul 24, 2012
461 events for the 24th July
Is there any interest from here in this info?
Eee, getting slack folks?? (Or did I miss it being posted?)
Location in Google Maps
Derived from Event Data Source: USGS
Powered by QVSData
Magnitude 6.6 - New Ireland Region. Papua New Guinea
Location in Google Maps
- Date-Time: Saturday, July 28, 2012 @ 20:04:00 UTC
- Earthquake location: 4.733°S, 153.173°E,
- Earthquake depth: 66.7 km
- Distances:
33km (20mi) SSE of Taron, PNG
109km (67mi) ESE of Kokopo, Papua New Guinea
308km (191mi) WNW of Arawa, Papua New Guinea
347km (215mi) ENE of Kimbe, Papua New Guinea
842km (523mi) NE of Port Moresby, Papua New Guinea
- Event ID: usb000bid9
Derived from Event Data Source: USGS
Powered by QVSData
reply to post by PuterMan
Maybe they're all Olympified ?
And yes to more detailing on Japan please Muzzy. Activity hotting up north and south of last years' epic quake so good idea to log it and have it for the record , plus maybe a useful pattern could emerge ....
:
Maybe they're all Olympified ?
And yes to more detailing on Japan please Muzzy. Activity hotting up north and south of last years' epic quake so good idea to log it and have it for the record , plus maybe a useful pattern could emerge ....
:
edit on 28-7-2012 by slidingdoor because: (no reason given)
edit on 28-7-2012 by slidingdoor because: wine inspired
dyslexia
Heres my first (test) map using data from the National Research Institute for Earth Science and Disaster Prevention, High Sensitivity Seismograph
Network Laboratory, Japan. NIEC Hi-net
On the 24th July 2012 JST (Japan Standard Time)
NIEC recorded 461 earthquakes
211< Mag1
183 Mag1's
50 Mag 2's
15 Mag 3's
and 2 Mag 4's
I took out the
On the 24th July 2012 JST (Japan Standard Time)
NIEC recorded 461 earthquakes
211< Mag1
183 Mag1's
50 Mag 2's
15 Mag 3's
and 2 Mag 4's
I took out the
Ten quakes in Puerto Rico in one hour.
earthquake.usgs.gov...
Source: USGS
Increase in activity today compared to the last week.
Wonder if something's brewing???
Hmmm....
WOQ
earthquake.usgs.gov...
Source: USGS
Increase in activity today compared to the last week.
Wonder if something's brewing???
Hmmm....
WOQ
reply to post by wasobservingquietly
That's quite a cluster. Thanks for posting it, WOQ.
There is a wide range of depths given for such a tight cluster geographically. Depths ranging from 11km to 49km. Weird.
I'm still undecided whether these ionosperic maps are useful at "predicting" large quakes, but the current map does show a mildly anomalous reading over the Puerto Rico area.
(higher than it should be considering it is the middle of the night there--the strongest readings on the map are where the sun is heating the atmosphere--usually)
The ionospheric anomaly over the Tohoku earthquake region a few days prior to the March 11, 2011 was intriguing--so I watch these maps periodically.
edit on 7/28/2012 by Olivine because: caveat
reply to post by Olivine
Nevada's a little busy the last few days too.
www.seis.utah.edu...
Source: ANSS
Scroll down to the list. It has a lot more than show on the map.
WOQ
Nevada's a little busy the last few days too.
www.seis.utah.edu...
Source: ANSS
Scroll down to the list. It has a lot more than show on the map.
WOQ
new topics
-
The Good News According to Jesus - Episode 1
Religion, Faith, And Theology: 44 minutes ago -
HORRIBLE !! Russian Soldier Drinking Own Urine To Survive In Battle
World War Three: 2 hours ago -
Bobiverse
Fantasy & Science Fiction: 5 hours ago -
Florida man's trip overseas ends in shock over $143,000 T-Mobile phone bill
Social Issues and Civil Unrest: 5 hours ago -
Former Labour minister Frank Field dies aged 81
People: 8 hours ago -
SETI chief says US has no evidence for alien technology. 'And we never have'
Aliens and UFOs: 9 hours ago
top topics
-
President BIDEN Vows to Make Americans Pay More Federal Taxes in 2025 - Political Suicide.
2024 Elections: 14 hours ago, 16 flags -
Florida man's trip overseas ends in shock over $143,000 T-Mobile phone bill
Social Issues and Civil Unrest: 5 hours ago, 7 flags -
SETI chief says US has no evidence for alien technology. 'And we never have'
Aliens and UFOs: 9 hours ago, 6 flags -
Former Labour minister Frank Field dies aged 81
People: 8 hours ago, 4 flags -
Ode to Artemis
General Chit Chat: 15 hours ago, 3 flags -
This is our Story
General Entertainment: 12 hours ago, 3 flags -
Bobiverse
Fantasy & Science Fiction: 5 hours ago, 3 flags -
HORRIBLE !! Russian Soldier Drinking Own Urine To Survive In Battle
World War Three: 2 hours ago, 1 flags -
The Good News According to Jesus - Episode 1
Religion, Faith, And Theology: 44 minutes ago, 0 flags
active topics
-
President BIDEN Vows to Make Americans Pay More Federal Taxes in 2025 - Political Suicide.
2024 Elections • 71 • : DBCowboy -
"We're All Hamas" Heard at Columbia University Protests
Social Issues and Civil Unrest • 276 • : marg6043 -
So this is what Hamas considers 'freedom fighting' ...
War On Terrorism • 258 • : FlyersFan -
CIA botched its handling of sexual assault allegations, House intel report says
Breaking Alternative News • 8 • : lilzazz -
Police clash with St George’s Day protesters at central London rally
Social Issues and Civil Unrest • 44 • : xWorldxGonexMadx -
Should Biden Replace Harris With AOC On the 2024 Democrat Ticket?
2024 Elections • 48 • : marg6043 -
HORRIBLE !! Russian Soldier Drinking Own Urine To Survive In Battle
World War Three • 11 • : JooTunnels -
The Good News According to Jesus - Episode 1
Religion, Faith, And Theology • 0 • : randomuser2034 -
Florida man's trip overseas ends in shock over $143,000 T-Mobile phone bill
Social Issues and Civil Unrest • 11 • : pianopraze -
Who are the Russians?
New World Order • 202 • : twistedpuppy