It looks like you're using an Ad Blocker.
Please white-list or disable AboveTopSecret.com in your ad-blocking tool.
Thank you.
Some features of ATS will be disabled while you continue to use an ad-blocker.

Quake Watch 2012
page: 13share:
Just got a 4.61 off the New Brighton coast at 13k's deep.
Largest since last Saturday's 5.28 at 1:21am
Hope this isn't going to lead on to larger ones tonight or next couple of days, as warned by the Moon Man (12th to 15th increased risk)
Largest since last Saturday's 5.28 at 1:21am
Hope this isn't going to lead on to larger ones tonight or next couple of days, as warned by the Moon Man (12th to 15th increased risk)
reply to post by PuterMan
Oh, I see, that explains allot, since my program is showing the quake again! So this happens when they are changing the ID
So no need to put on my conspiracy hat
Oh, I see, that explains allot, since my program is showing the quake again! So this happens when they are changing the ID
So no need to put on my conspiracy hat
reply to post by PuterMan
No offence taken at all, actually I value your opinions and your posts are the main reason you won't be flamed back. You seem to have a good grasp on what is happening, I just wanted to throw a couple more tools to help people look at all possibilities. I have always been intrigued by plate tectonics and volcanism and just here to learn.When I have some more time I will be going back through all the threads to glean some more wisdom from the valued members of ATS. I have a lot more to contribute to this thread and will throw in a few eye opening articles, theories, and yes a few of them may be a little out there but all in the process of further knowledge and advancement. Thank you and have a nice day!!
No offence taken at all, actually I value your opinions and your posts are the main reason you won't be flamed back. You seem to have a good grasp on what is happening, I just wanted to throw a couple more tools to help people look at all possibilities. I have always been intrigued by plate tectonics and volcanism and just here to learn.When I have some more time I will be going back through all the threads to glean some more wisdom from the valued members of ATS. I have a lot more to contribute to this thread and will throw in a few eye opening articles, theories, and yes a few of them may be a little out there but all in the process of further knowledge and advancement. Thank you and have a nice day!!
On the up again?
Magnitude mb 5.0
Region NEAR EAST COAST OF HONSHU, JAPAN
Date time 2012-01-12 15:26:32.0 UTC
Location 36.96 N ; 141.75 E
Depth 40 km
Distances 78 km E Iwaki (pop 357,309 ; local time 00:26:32.6 2012-01-13)
90 km SE Namie (pop 21,866 ; local time 00:26:32.6 2012-01-13)
Source parameters not yet reviewed by a seismologist
Rainbows
Jane
Has anyone noticed the string of very shallow 4's, 3's and 2's from Mexico to Montana over the last few days?
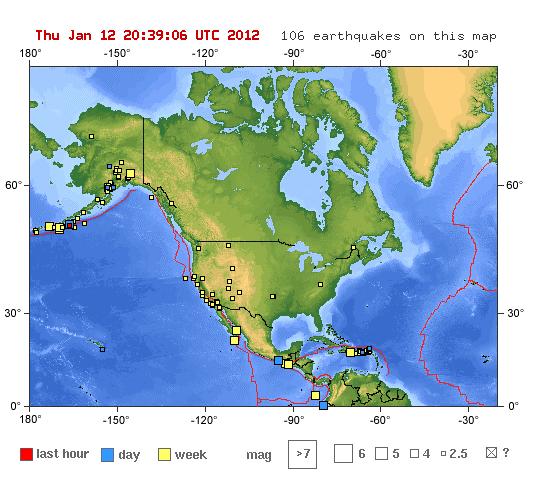
earthquake.usgs.gov...
I was wondering if any of the experts had any thoughts on this.
earthquake.usgs.gov...
I was wondering if any of the experts had any thoughts on this.
I posted a question last week about the amount of 5+ quakes north and east of Australia, but I got no response.
Does the amount of moderate quakes in this area sound any alarms on this bitchin' thread?
Does the amount of moderate quakes in this area sound any alarms on this bitchin' thread?
Oh CR*P!
Just woke up to the fact that today is FRIDAY 13th
That can't be good in a city that's getting around 18 quakes per day!
If we get thru today without a 5+ I'll start to calm down
Just woke up to the fact that today is FRIDAY 13th
That can't be good in a city that's getting around 18 quakes per day!
If we get thru today without a 5+ I'll start to calm down
reply to post by SpaceJockey1
Sorry I'm new to the thread.
Are you from NZ or Japan?
Sorry for asking but you mentioned it.
We don't feel many here in my part of Canada.
Sorry I'm new to the thread.
Are you from NZ or Japan?
Sorry for asking but you mentioned it.
We don't feel many here in my part of Canada.
reply to post by SpaceJockey1
Nah - we won't get a 5+ today... cause they only pop up when you least expect them and today would be just too predictable lol
Have to say I don't like the little ones popping up in Lincoln again, after having been all offshore for a while - that's the one I really worry about. Or that random little shake under lake Ellesmere the other day (11/1) - didn't like that either
I noticed those too...getting a bit too close to home
There's nobody around here at the moment so I can't get an informed second opinion.
Oh well, just have to go back to my fossils!
There's nobody around here at the moment so I can't get an informed second opinion.
Oh well, just have to go back to my fossils!
reply to post by Corruption Exposed
NZ (Christchurch) mate
Been too quite since that 4.69 last night...
We've had over 8000 quakes since 4th Sept 2010 (7.1 mag).
The one that killed 182 people here was a 6.3 on Feb 22nd 2011
NZ (Christchurch) mate
Been too quite since that 4.69 last night...
We've had over 8000 quakes since 4th Sept 2010 (7.1 mag).
The one that killed 182 people here was a 6.3 on Feb 22nd 2011
edit on 12-1-2012 by SpaceJockey1 because: added text
Frack. lost what i wrote cause i'm an idiot.
my head is full of glue
quakes are predictable. they will be more accurate in the future with relaible forecasts. it's math. giant's causeway is like a beehive. hexagons. bubbles make shape. geometry is the key. faults have right angle. volcano chains have arcs. all we need is the full equation.
There is a lull. Natural gas is at a low price. it needs to increase. oil is now increasing because of a plan to provoke Iran to help investment and start a new boom and expansion in gas fields.
If you though fracking was bad. The idiots are supersizing it like a bad McDonald's meal. Now we got super frack fracking, muther fruckers.
glue oozing out of my head.
business.financialpost.com...
Originally posted by Corruption Exposed
Has anyone noticed the string of very shallow 4's, 3's and 2's from Mexico to Montana over the last few days?
earthquake.usgs.gov...
I was wondering if any of the experts had any thoughts on this.
Might be due to this.
Some earthquakes expected along Rio Grande Rift in Colorado and New Mexico, new study says
www.physorg.com...
reply to post by kdog1982
Could be tell-tell....
I just watched an episode on the History Channel of How the Earth was Made on Yellowstone....
They stated that there will be signs to indicate an imminent eruption:
1. Increase in earthquakes (check)
2. Raise in land elevation (check)
3. Water changes (check)
4. Magma level increase (check)
All of things were verified to be happening as of 2009 by seismologists, and have scientists on the 'concerned' side....
Not fear mongering; just stating the facts.
This is quite interesting
reply to post by ButterCookie
1. Increase in earthquakes (NOT check) there is little activity.
2. Raise in land elevation (NOT check) there has been deflation.
3. Water changes (NOT check) None that I am aware of recently since the heating up of one area.
4. Magma level increase (NOT check) Eh? What magma level increase? Current theory has the 'plume' cooling.
Of course if you would like to provide sources to prove otherwise?
And subsequently proved not to be the case.
1. Increase in earthquakes (check)
2. Raise in land elevation (check)
3. Water changes (check)
4. Magma level increase (check)
1. Increase in earthquakes (NOT check) there is little activity.
2. Raise in land elevation (NOT check) there has been deflation.
3. Water changes (NOT check) None that I am aware of recently since the heating up of one area.
4. Magma level increase (NOT check) Eh? What magma level increase? Current theory has the 'plume' cooling.
Of course if you would like to provide sources to prove otherwise?
All of things were verified to be happening as of 2009 by seismologists
And subsequently proved not to be the case.
edit on 13/1/2012 by PuterMan because: (no reason given)
reply to post by kdog1982
Forgive me if my geography is wrong but are any of the quakes on that map actually anywhere near the Rio Grande?
I am also curious as to how there is spreading when the American plate is supposedly moving SW?
Forgive me if my geography is wrong but are any of the quakes on that map actually anywhere near the Rio Grande?
I am also curious as to how there is spreading when the American plate is supposedly moving SW?
reply to post by ButterCookie
reply to post by PuterMan
reply to post by PuterMan
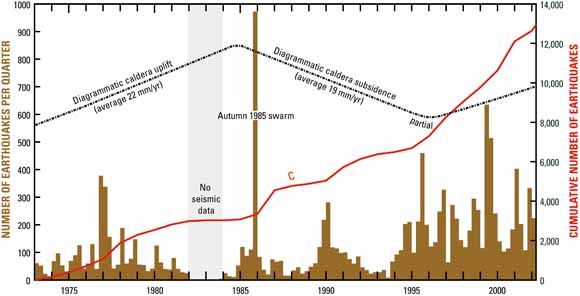
U.S. Geological Survey
Fact Sheet 100-03
2004
Tracking Changes in Yellowstone's Restless Volcanic System
The Yellowstone area is one of the most seismically active parts of the United States, but the frequency of earthquakes varies dramatically and is related to other events in this active volcanic system. Precise measurements of elevation made regularly since the 1970s document the rise and fall (shown diagrammatically here) of the ground surface in the Yellowstone Caldera, thought to be caused by movements of magma (molten rock) or hydrothermal (hot, watery) fluids beneath the surface. The spectacular earthquake swarm of late 1985 may have been caused by the escape of hydrothermal fluids through the impermeable rock layer above the magma reservoir, which also initiated an episode of subsidence in the caldera.
pubs.usgs.gov...
reply to post by this_is_who_we_are
Sorry, out of date. That was 2004.
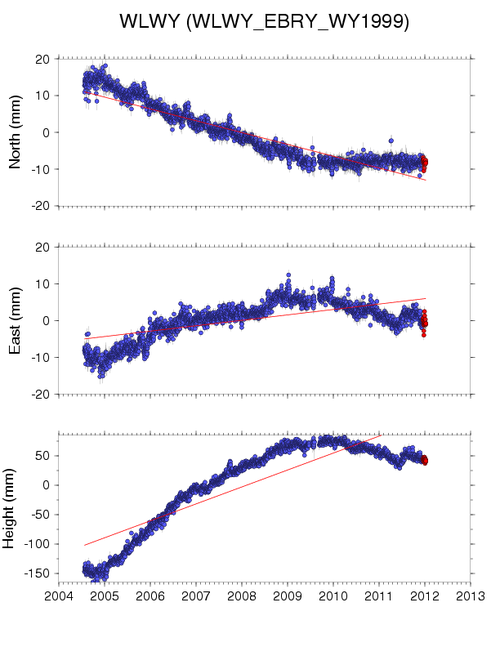
GPS
Peaked in 2009 and now going down.
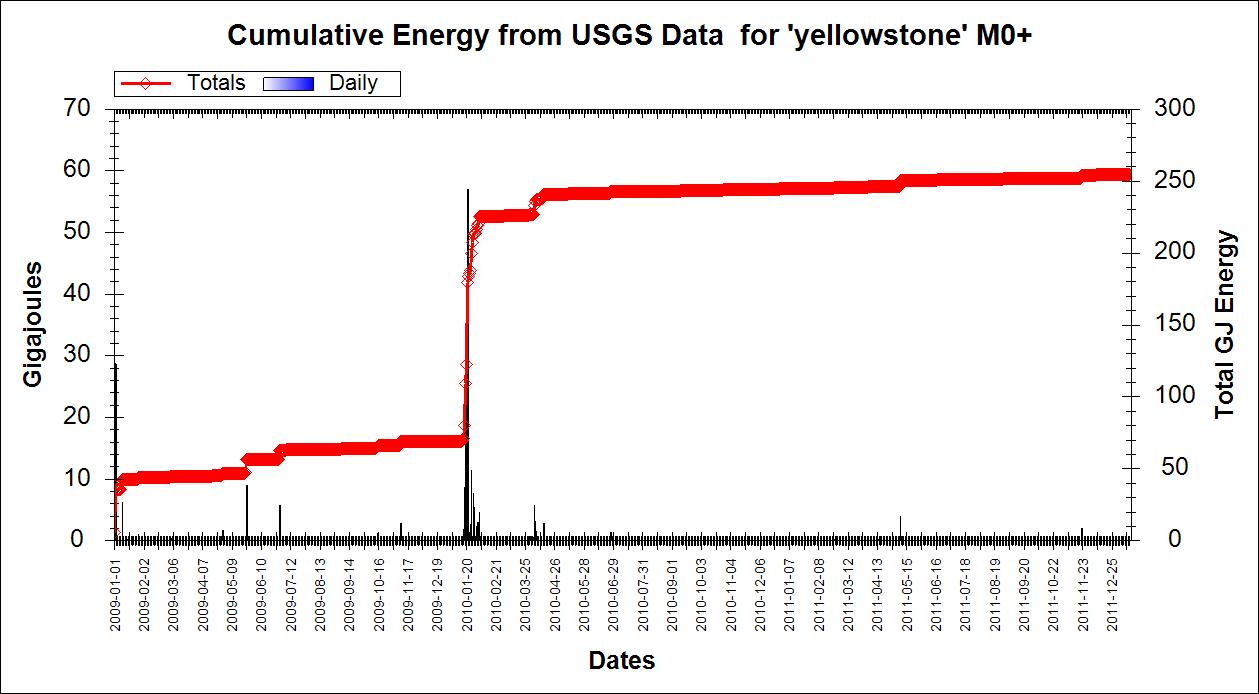
Cumulative energy since 01/01/2009
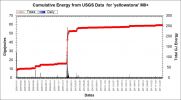
The WHOLE of that energy by the way over the three years is approximately the equivalent of a single Mag 4.4
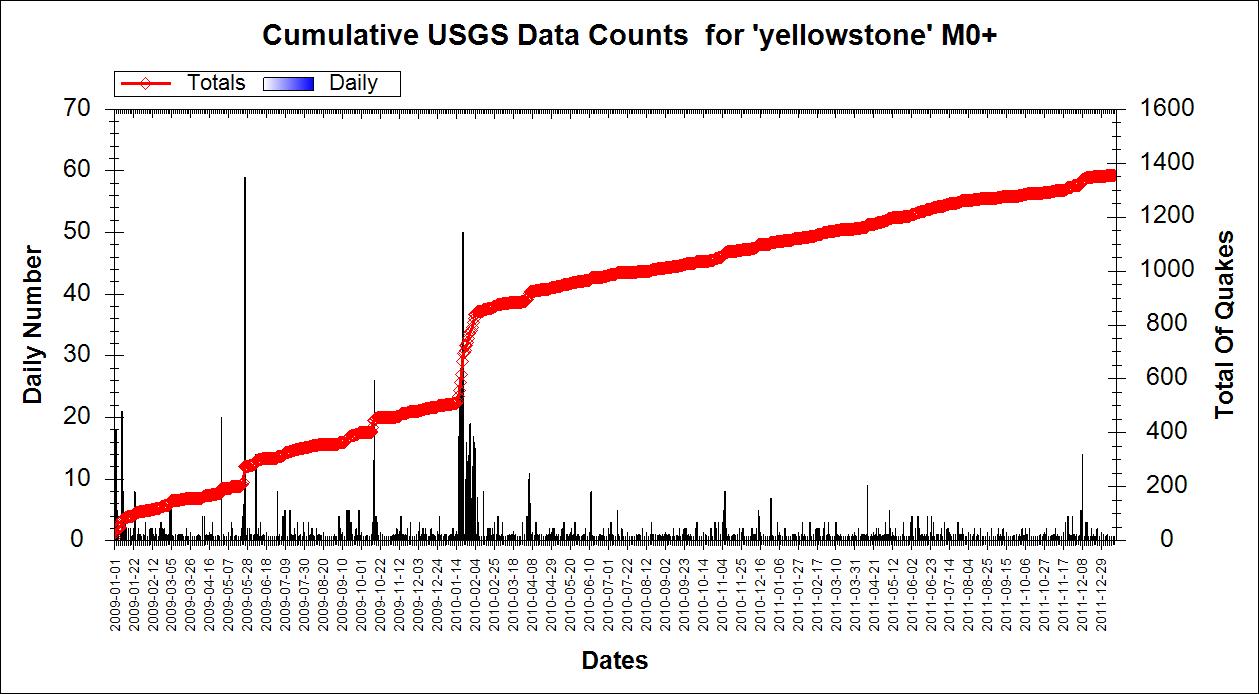
Cumulative numbers over the 3 years
I should add that the numbers on my graph are all above mag 1.0
The USGS graph includes quakes under 1.0 down to about Mag -0.3
Sorry, out of date. That was 2004.
GPS
Peaked in 2009 and now going down.
Cumulative energy since 01/01/2009
The WHOLE of that energy by the way over the three years is approximately the equivalent of a single Mag 4.4
Cumulative numbers over the 3 years
I should add that the numbers on my graph are all above mag 1.0
The USGS graph includes quakes under 1.0 down to about Mag -0.3
edit on 13/1/2012 by PuterMan because: (no reason given)
It looks like the far northern end of the Cascadia might have had a slip:
Mag 4.7 USGS event page
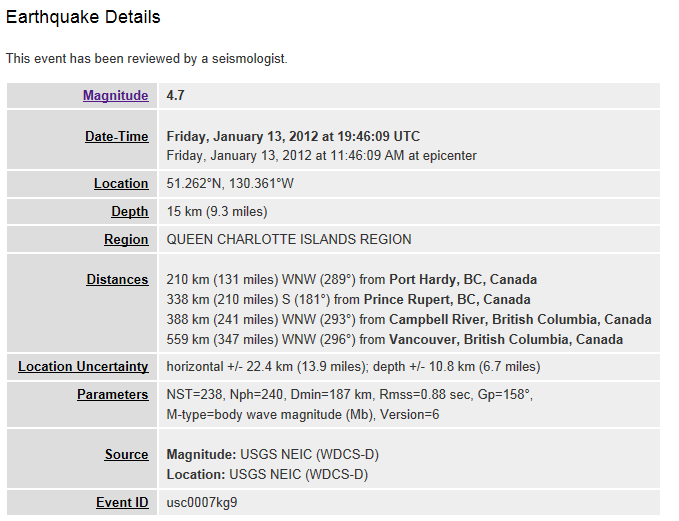
Made me nervous because I was watching the Rainier seismos in GEE. There was a tiny Mag 1.0 just south of the volcano about 22 minutes before these Mag 4.7 traces started scrolling. I thought something might have started cooking on the mountain.
Made me nervous because I was watching the Rainier seismos in GEE. There was a tiny Mag 1.0 just south of the volcano about 22 minutes before these Mag 4.7 traces started scrolling. I thought something might have started cooking on the mountain.
edit on 1/13/2012 by Olivine because: add
info & link
edit on 1/13/2012 by Olivine because: and spelling
Weird past 24 hours. I saw that too, was wondering when that area would get another jolt.
5 quakes South of Africa, 2 South Sandwich Isles, lots of action down South in the past 48 hrs. I see a lot of 2s. More recently a 4.5 @ 129km depth and then a 5.0 @ 113km depth in the Hindu Kush, Afghan region. The whole EQ vibe seems a bit off today, more action than usual all around, lots of small tremors near the West Coast, more than I could possibly count using EQ3D.
5 quakes South of Africa, 2 South Sandwich Isles, lots of action down South in the past 48 hrs. I see a lot of 2s. More recently a 4.5 @ 129km depth and then a 5.0 @ 113km depth in the Hindu Kush, Afghan region. The whole EQ vibe seems a bit off today, more action than usual all around, lots of small tremors near the West Coast, more than I could possibly count using EQ3D.
edit on 13/1/12 by murkraz because: (no reason given)
new topics
-
SETI chief says US has no evidence for alien technology. 'And we never have'
Aliens and UFOs: 3 minutes ago -
This is our Story
General Entertainment: 2 hours ago -
President BIDEN Vows to Make Americans Pay More Federal Taxes in 2025 - Political Suicide.
2024 Elections: 5 hours ago -
Ode to Artemis
General Chit Chat: 5 hours ago -
Ditching physical money
History: 9 hours ago -
One Flame Throwing Robot Dog for Christmas Please!
Weaponry: 9 hours ago -
Don't take advantage of people just because it seems easy it will backfire
Rant: 9 hours ago -
VirginOfGrand says hello
Introductions: 10 hours ago -
Should Biden Replace Harris With AOC On the 2024 Democrat Ticket?
2024 Elections: 11 hours ago
top topics
-
University student disciplined after saying veganism is wrong and gender fluidity is stupid
Education and Media: 13 hours ago, 13 flags -
President BIDEN Vows to Make Americans Pay More Federal Taxes in 2025 - Political Suicide.
2024 Elections: 5 hours ago, 10 flags -
Police clash with St George’s Day protesters at central London rally
Social Issues and Civil Unrest: 16 hours ago, 9 flags -
TLDR post about ATS and why I love it and hope we all stay together somewhere
General Chit Chat: 17 hours ago, 7 flags -
Should Biden Replace Harris With AOC On the 2024 Democrat Ticket?
2024 Elections: 11 hours ago, 6 flags -
One Flame Throwing Robot Dog for Christmas Please!
Weaponry: 9 hours ago, 5 flags -
Don't take advantage of people just because it seems easy it will backfire
Rant: 9 hours ago, 4 flags -
Ditching physical money
History: 9 hours ago, 3 flags -
God lived as a Devil Dog.
Short Stories: 15 hours ago, 3 flags -
VirginOfGrand says hello
Introductions: 10 hours ago, 2 flags
active topics
-
University student disciplined after saying veganism is wrong and gender fluidity is stupid
Education and Media • 27 • : Consvoli -
SETI chief says US has no evidence for alien technology. 'And we never have'
Aliens and UFOs • 0 • : Consvoli -
-@TH3WH17ERABB17- -Q- ---TIME TO SHOW THE WORLD--- -Part- --44--
Dissecting Disinformation • 637 • : burritocat -
The Reality of the Laser
Military Projects • 33 • : ADVISOR -
Terrifying Encounters With The Black Eyed Kids
Paranormal Studies • 71 • : FlyersFan -
This is our Story
General Entertainment • 1 • : Encia22 -
whistleblower Captain Bill Uhouse on the Kingman UFO recovery
Aliens and UFOs • 17 • : vance2 -
DerBeobachter - Electric Boogaloo 2
Introductions • 13 • : DerBeobachter2 -
One Flame Throwing Robot Dog for Christmas Please!
Weaponry • 7 • : OzBiker -
President BIDEN Vows to Make Americans Pay More Federal Taxes in 2025 - Political Suicide.
2024 Elections • 4 • : 727Sky