It looks like you're using an Ad Blocker.
Please white-list or disable AboveTopSecret.com in your ad-blocking tool.
Thank you.
Some features of ATS will be disabled while you continue to use an ad-blocker.

Quake Watch 2012
page: 109share:
reply to post by skitzspiricy
This is a reply I gave to another member, so maybe it will help.
The Banda Aceh area of the 2004 event had a subsequent 8.5 and whilst the seismicity from the event may go on for some time, I don't expect anything major there in the immediate future. This arc however extends over thousands of kilometres so just because one area is done for the present does not mean it all is.
When the original 9.1 went off the geologists did say that the more Northerly part still had stress, and I would imagine that this latest area was the one they were meaning, but maybe not.
The strike/slip event recently was very different to the mega-thrust of 2004 and of course in a different plate area being the opposite side of a junction.
If this was relating to the (almost) North/ South junction then there still exists potential for a mega-thrust on the other side ( the side of the recent ones )
The is some interesting information in this article
Looking at this again I used to be uncertain now I am not so sure so apologies to BO if this seems to be a change.
A pattern seems to be emerging and I don't really know how best to explain it.

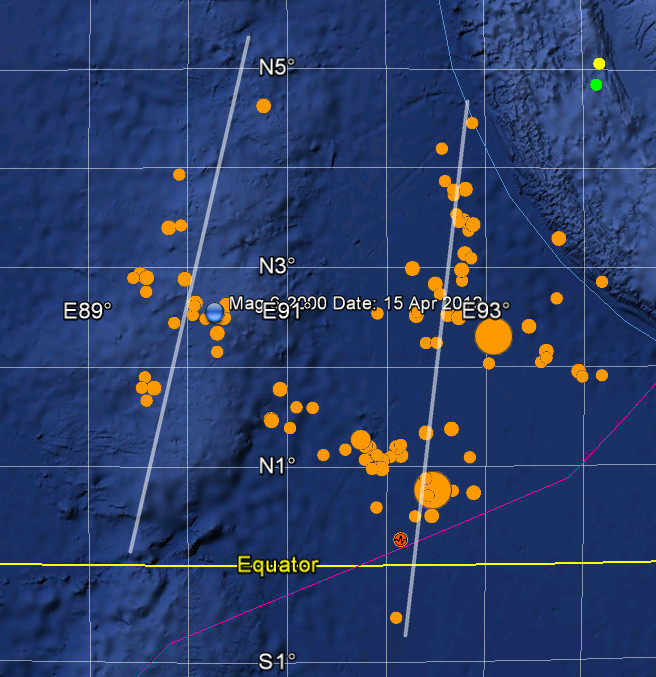
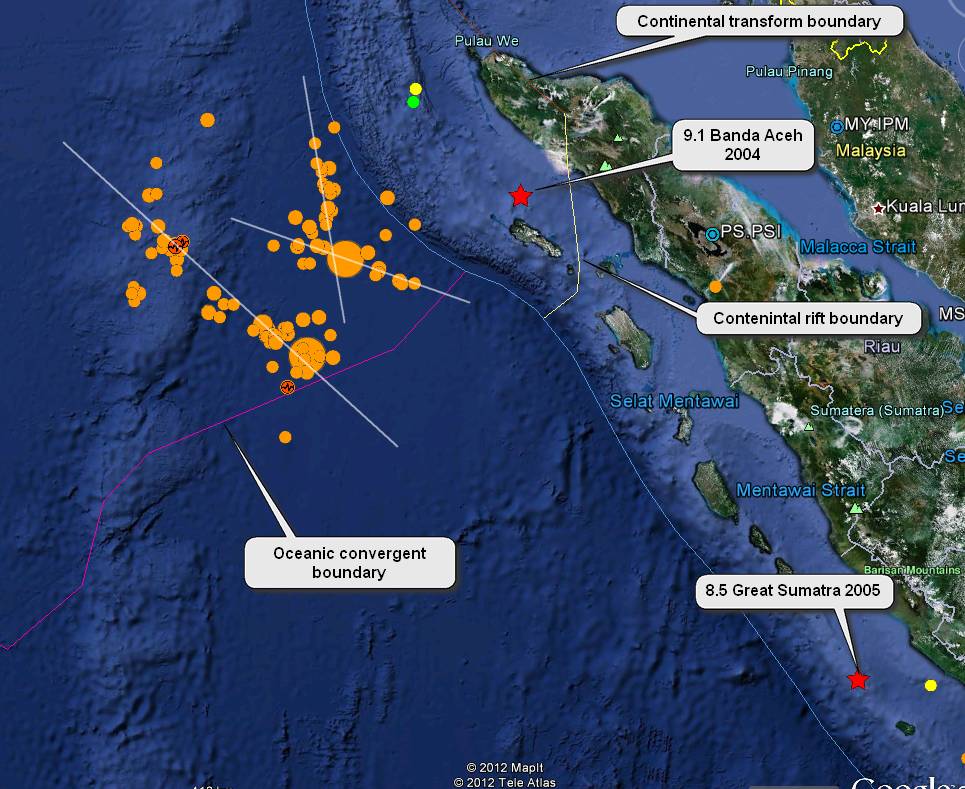
Is it my imagination or is there a definite 'line' where I have drawn the white lines? (The X could be interpreted as a straight line perhaps with quakes falling either side)
Thinking out loud here, and looking for some input from the experts (John), if this was as is said a strike/slip rupture then would that not run in a line with the convergent oceanic boundary? I drew this to illustrate where I would have thought the quakes would lie. The angle of this is purely illustrative and may be closer to a transform joint)
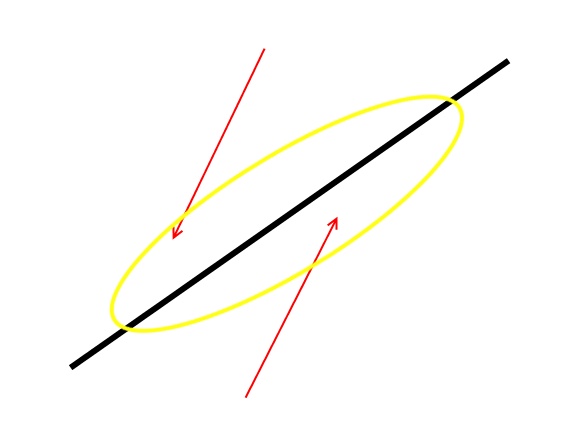
Problems of terminology here in that a 'convergent' boundary can be a subduction sone or a 'collision' boundary but I have to assume that since in Google Earth they are labelled separately then the main arc is the convergent subduction boundary and the south west pointing element is the convergent collision boundary.
Now have a read of this learned paper Neotectonics of the Sumatran Fault. This paper is mainly concerned with the fault running down the spine of Sumatra but is relevant and has many good illustrations.
From that document I have extracted this map of the faults contained therein.
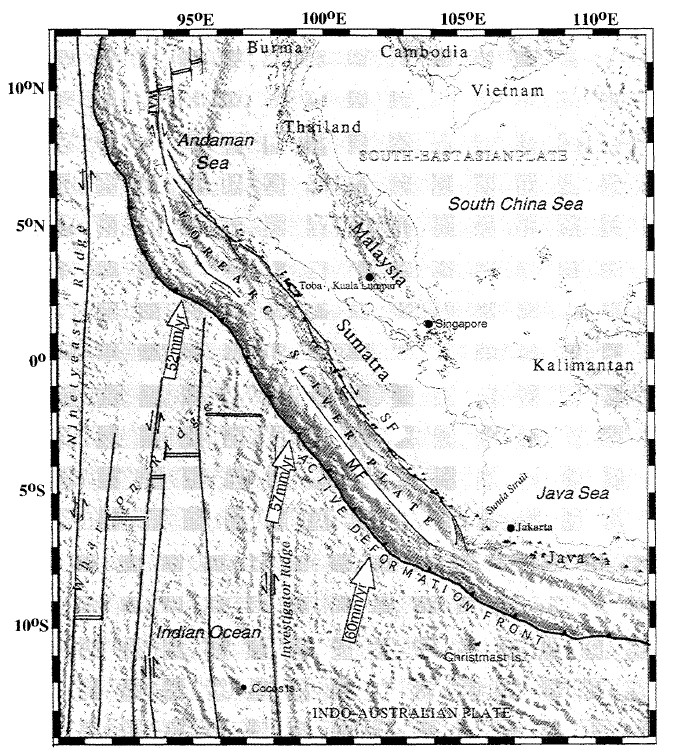
In order that you can see the position of the current earthquakes I have attempted an overlay of the Google Earth mapping onto this image above. (Unfortunately curved earth images and flat earth images are difficult to match precisely but I have attempted to get the registration as close as I can.
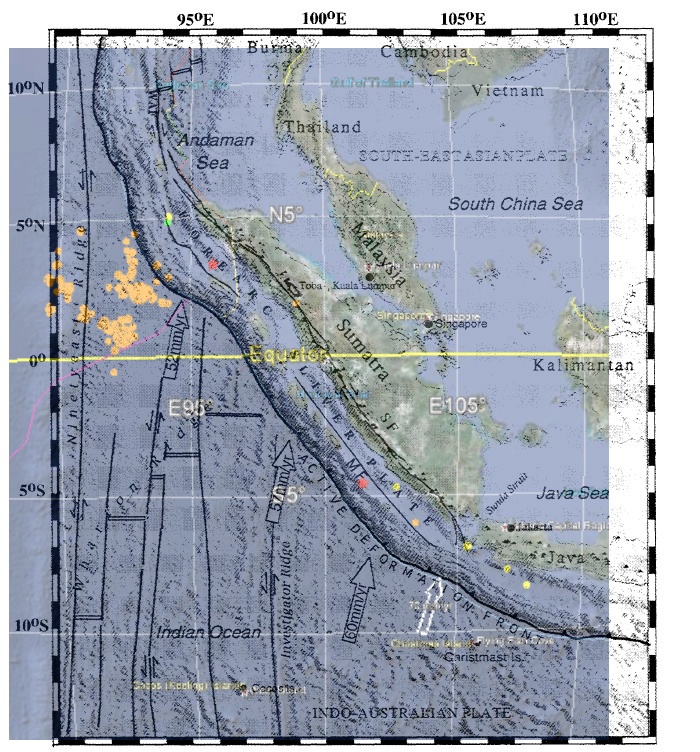
These, whilst close to a convergent boundary on GE, do not seem to match the learned document at all! You can see the feint line of the GE boundary and the positions of the 9.1 and 8.5
I am not sure if this is wild uneducated speculation or not but it seems to me that the lines (as drawn by me) if 'real' may in fact be indicating a slab pull by the subducting area, but if that was the case why would the two bigger quakes be strike slip?
There is a possible alternative alignment that does not seem as 'neat', but the Mother Earth is not prone to being neat just to suit us!
This alternate alignment then fits in with the slip movement indicated for the Ninetyeast Ridge as indicated but leaves the other possible alignment still sitting in an area unmarked for faults, but is above and therefore could be an extension to the fault immediately south.
The GE oceanic transform boundary not being shown in the paper does make this a little confusing.
This is a reply I gave to another member, so maybe it will help.
The Banda Aceh area of the 2004 event had a subsequent 8.5 and whilst the seismicity from the event may go on for some time, I don't expect anything major there in the immediate future. This arc however extends over thousands of kilometres so just because one area is done for the present does not mean it all is.
When the original 9.1 went off the geologists did say that the more Northerly part still had stress, and I would imagine that this latest area was the one they were meaning, but maybe not.
The strike/slip event recently was very different to the mega-thrust of 2004 and of course in a different plate area being the opposite side of a junction.
If this was relating to the (almost) North/ South junction then there still exists potential for a mega-thrust on the other side ( the side of the recent ones )
The is some interesting information in this article
Looking at this again I used to be uncertain now I am not so sure so apologies to BO if this seems to be a change.
A pattern seems to be emerging and I don't really know how best to explain it.
Is it my imagination or is there a definite 'line' where I have drawn the white lines? (The X could be interpreted as a straight line perhaps with quakes falling either side)
Thinking out loud here, and looking for some input from the experts (John), if this was as is said a strike/slip rupture then would that not run in a line with the convergent oceanic boundary? I drew this to illustrate where I would have thought the quakes would lie. The angle of this is purely illustrative and may be closer to a transform joint)
Problems of terminology here in that a 'convergent' boundary can be a subduction sone or a 'collision' boundary but I have to assume that since in Google Earth they are labelled separately then the main arc is the convergent subduction boundary and the south west pointing element is the convergent collision boundary.
Now have a read of this learned paper Neotectonics of the Sumatran Fault. This paper is mainly concerned with the fault running down the spine of Sumatra but is relevant and has many good illustrations.
From that document I have extracted this map of the faults contained therein.
In order that you can see the position of the current earthquakes I have attempted an overlay of the Google Earth mapping onto this image above. (Unfortunately curved earth images and flat earth images are difficult to match precisely but I have attempted to get the registration as close as I can.
These, whilst close to a convergent boundary on GE, do not seem to match the learned document at all! You can see the feint line of the GE boundary and the positions of the 9.1 and 8.5
I am not sure if this is wild uneducated speculation or not but it seems to me that the lines (as drawn by me) if 'real' may in fact be indicating a slab pull by the subducting area, but if that was the case why would the two bigger quakes be strike slip?
There is a possible alternative alignment that does not seem as 'neat', but the Mother Earth is not prone to being neat just to suit us!
This alternate alignment then fits in with the slip movement indicated for the Ninetyeast Ridge as indicated but leaves the other possible alignment still sitting in an area unmarked for faults, but is above and therefore could be an extension to the fault immediately south.
The GE oceanic transform boundary not being shown in the paper does make this a little confusing.
reply to post by muzzy
Oops! — File Not Found (404) for the SNZO link
Have they zapped this and are using a new one? The USGS site is changing rapidly as the new format comes on stream
This is the link from my program: New Zealand, South Karori [IU]
No need to look Muzzy - I see the problem - just a typo
Your link has "Seismic_Data/telemetry_data /SNZO_24hr."
It should be "Seismic_Data/telemetry_data/SNZO_24hr."
No space after _data
edit on 15/4/2012 by PuterMan because: (no reason given)
reply to post by ericblair4891
Mexico responding to Guatemala perhaps?
You did not say what point it proved.
Mexico responding to Guatemala perhaps?
You did not say what point it proved.
reply to post by PuterMan
VERY MUCH appreciate the graphics with this answer in the thread, PuterMan.
Very helpful.
I have been wanting to ask . . . and finally figured out a way to articulate it maybe hearably . . .
1. Taking into account the known movements of various sides of faults etc. . . .
2. Taking into account the lay of the land on the ocean floor . . .
3. [are there any updated terrain, contour graphics available on an ongoing basis? I assume the undersea stuff is fairly dated???]
4. As a weaver . . . if I have cloth on the loom or on a table . . . and move part of it in a given way . . . I can anticipate results of that movement on adjacent parts of the cloth . . . and I can anticipate results of said movement on even some further distant areas of the cloth.
5. ARE THERE ANY--LAYERS OF EARTH EXPERTS--OR TERRAIN/CONTOUR EXPERTS or some such geologists or LAYERS experts of maybe any kind . . . who could sort of . . . think outside the box a bit in a collaborative effort about such things???
6. i.e. shouldn't it be possible to look at some such areas . . . say in Sumatra or Christchurch NZ . . . or off the No CAL/ Oregon/Washington coast . . . particularly the juncture of the 3 plates off the Oregon coast???
and sort of pick up on the trends of the 'cloth' movement and
anticipate
A) what parts are likely to buckle
B) what parts are likely to descend
C) what parts are likely to rise in what rough proportions and what relative speeds
D) what parts are likely to break apart
It just seems like a cluster of interested, thoughtful . . . maybe trained group could come up with some hypotheses that we could then watch over some months to years and see therefore what came of them.
Maybe this is old hat to geologists but I've never read of any such conjectures or predictions.
????
or are all such conjectures merely the absurd fantasies of a psych prof?
reply to post by BO XIAN
Hi BO,
I am sure (fairly) that no geologist would deny that stress buildup or release in on area can affect stress buildup or release in another. People often talk about a fault rupture putting pressure on further down the fault, and there is no reason why large plate movements could not also do the same.
Obviously the whole of the crust is connected, and my DB would say the whole thing is part of the cake and when the crust moves as the cake rises all areas are affected. This applies equally if you are an expanding earth adherent when it is particularly relevant, or if you believe that the size of the Earth never changes and the plates play bumper cars with each other and decide to go floaty floaty all over the planet. (As a complete aside has anyone ever calculated the kinetic energy of the Indian plate against the energy required to create the Himalayas? There is a task for someone.)
There are so many parameters involved in trying to create a complete model of the crust of the planet that I doubt it could be done properly, not that that would stop them trying after all the same applies to climate.
Were it possible to do so then I would imagine that you would have in effect an earthquake prediction system on a global scale. I don't think it could ever be done as you would have to model all the workings of the interior of the planet as well, and then factor in all the gravitational effects from the Moon, the Sun, Jupiter, Saturn, The galactic Black hole and Nibiru, not to mention Elenin of course.
Having done all of that the electric universe people would then question whether you had included the plasma, interplanetary magnetism, blah blah blah et al and you would have to start all over again.
A little tongue in cheek but you get my drift I am sure.
Hi BO,
It just seems like a cluster of interested, thoughtful . . . maybe trained group could come up with some hypotheses that we could then watch over some months to years and see therefore what came of them.
Maybe this is old hat to geologists but I've never read of any such conjectures or predictions.
????
or are all such conjectures merely the absurd fantasies of a psych prof?
I am sure (fairly) that no geologist would deny that stress buildup or release in on area can affect stress buildup or release in another. People often talk about a fault rupture putting pressure on further down the fault, and there is no reason why large plate movements could not also do the same.
Obviously the whole of the crust is connected, and my DB would say the whole thing is part of the cake and when the crust moves as the cake rises all areas are affected. This applies equally if you are an expanding earth adherent when it is particularly relevant, or if you believe that the size of the Earth never changes and the plates play bumper cars with each other and decide to go floaty floaty all over the planet. (As a complete aside has anyone ever calculated the kinetic energy of the Indian plate against the energy required to create the Himalayas? There is a task for someone.)
There are so many parameters involved in trying to create a complete model of the crust of the planet that I doubt it could be done properly, not that that would stop them trying after all the same applies to climate.
Were it possible to do so then I would imagine that you would have in effect an earthquake prediction system on a global scale. I don't think it could ever be done as you would have to model all the workings of the interior of the planet as well, and then factor in all the gravitational effects from the Moon, the Sun, Jupiter, Saturn, The galactic Black hole and Nibiru, not to mention Elenin of course.
Having done all of that the electric universe people would then question whether you had included the plasma, interplanetary magnetism, blah blah blah et al and you would have to start all over again.
A little tongue in cheek but you get my drift I am sure.
reply to post by PuterMan
I'm pressed for time, but this movie from Miaki Ishii at Harvard seems to give a clear answer why the aftershocks have such a complicated pattern.
www.seismology.harvard.edu...
It looks like there are two faults involved that strike NW-SE, one 200km SW of the other. That strike follows the strike of one of the nodal planes, from, for example, Goran Ekstrom's group
earthquake.usgs.gov...
In the movie, the M8.6 breaks first the NE fault, then moves to the SW fault at about 8:40:20. The M8.2 event extends the rupture farther SE on the more SW fault.
As far as vertical vs horizontal motion, these are strike-slip faults, which is where the fault is vertical and the two sides of the fault move sideways relative to each other.
In subduction events, which are called thrust or reverse mechanisms, the fault angles downward, often inclined about 30° down from horizontal, and the motion is purely convergent. This means mostly horizontal motion of the plates moving toward and past each other, with a lesser component of sinking in the downgoing plate and uplift of the overriding plate.
With regarding to these events loading the surrounding faults, the strongest loading is on the closest faults, and the very strongest loading is on the adjacent unbroken segments along the fault that just broke. The 2004 event was on the subduction zone, and loaded (greatly) nearby parts of that fault, some of which have since broken in M8.5+ events.
This latest event is some distance from the subduction zone, but will still perturb the stress on the subduction zone. I have not seen estimates of the amount of stress added, but I would not be surprised to see further subduction quake activity in the near future.
We saw 2009 and 2010 have a rather good increase in 7.0 and greater quakes, but I'm going to say that 2012 will be a relatively slower year with 16
7.0 or greater.
reply to post by PuterMan
No idea how that happened
lately I have been typing my replies and posts on Notepad first to try and reduce the number of spelling and grammar mistakes before pasting into the ATS edit box, Notepad in reduced window size in Word Wrap format and the address dropped a line, didn't change to Word Wrap off before copying and pasting it.
Thats all I can think of.
Obviously it ain't working (reducing the number of spelling and grammar mistakes) (
Originally posted by JohnVidale
This latest event is some distance from the subduction zone, but will still perturb the stress on the subduction zone. I have not seen estimates of the amount of stress added, but I would not be surprised to see further subduction quake activity in the near future.
Then if that's the case, why couldn't we see the same thing happening in Cascadia? The recent activity has not been directly on the subduction zone itself, but at some distance out to sea. So to draw a parallel, then couldn't these recent events off Oregon and Vancouver also be causing some stress loading on the zone itself? Or on the locked zone?
And if that's the case and true, then maybe perhaps things aren't going to be so OK? I mean I guess that's one way you could look at it. On the other hand, it could just all be reaction to the last big Cascadia rupture, as portions near the zone ends release the previous stress loads placed on them from the larger ruptures long ago.
I tend to think that these recent quakes in Sumatra are probably late reactions to the 2004 9.1. But there is something very curious about the patterns of rupture. It appears to me that two separate areas ruptured with their own contained areas of aftershocks for each. I am seeing the patterns a bit different than PM though. What is curious to me is the apparent hook type features on the northern sides of both rupture areas, that hook back towards shore, if you'll look at the maps. With the way both those rupture areas seem to be spreading northwest, they seem to be breaking new ground. I would not be all too surprised to see another massive quake come from this area soon.
And I am also not entirely sold on the slip strike definition of these quakes, because there were some small tsunamis generated. How can that displacement occur on a slip strike boundary, and yet still generate any tsunami?
reply to post by TrueAmerican
The predominant strike-slip action is well-documented. There could still be some vertical action buried in an M8.6 that's hard to resolve, and even pure strike slip has a little vertical, with compressive quadrants uplifting, and dilational quadrants dropping.
If there were an M8.6 off our coast, I'd stay away from the beach for a while. The M6 we had just packs much less punch, and I think it was somewhat further away.
Certainly a lot of stress has been redistributed as well as dissipated, and the odds of earthquakes in that part of the world just took a big step up for a while.
Tying the timing of this quake to the 2004 (and subsequent M8+ aftershocks) probably is right.
reply to post by JohnVidale
It seems I was sort of right about the lines then.
You say loaded greatly. How is that determined and could it also have unloaded under different circumstances?
With regarding to these events loading the surrounding faults, the strongest loading is on the closest faults, and the very strongest loading is on the adjacent unbroken segments along the fault that just broke. The 2004 event was on the subduction zone, and loaded (greatly) nearby parts of that fault, some of which have since broken in M8.5+ events.
It seems I was sort of right about the lines then.
You say loaded greatly. How is that determined and could it also have unloaded under different circumstances?
reply to post by Xtrozero
The numbers for the last two and a half years might look high compared with the two decades previously, but they have actually been declining since 2007.
and nothing compared to the period 1948 through 1951.
1968 through 1970 also seen a spike similar to now, but there is no indication based on the last 100 years data that this current high trend will get bigger, or even continue. .
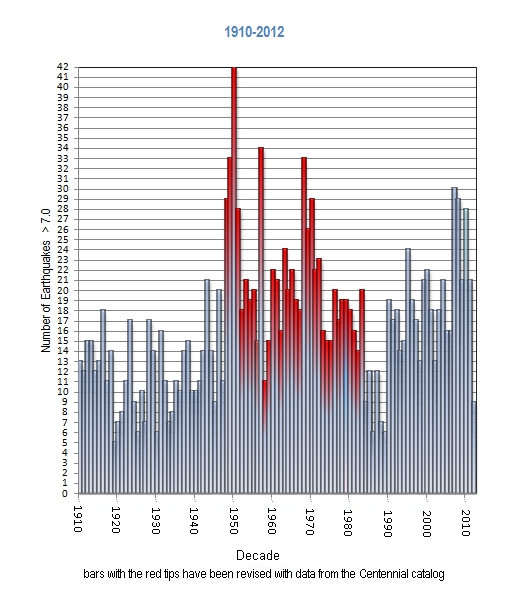
As can be seen by the red highlighting, the data the graph is based on is still being reviewed and merged with the USGS Centennial List 1900-2002, maybe the 1980s will have a few surprises yet, but based on the review so far it would be safe to add 6 more per year average, up until 2004 when the data is reasonably accurate with EMSC and Geofon used for cross referencing.
Major World Earthquakes 314-2012
16 ? thats 1 below the 100 year annual average.
If I had time I'd have a look at Mag 6 -7 as well and see whats happening there, but that is harder to do accurately as many 6's are aftershocks of 7 - 9 magnitude quakes.
It is always possible the trend could go - more biguns 8+ and more 6's, with less 7's
The numbers for the last two and a half years might look high compared with the two decades previously, but they have actually been declining since 2007.
and nothing compared to the period 1948 through 1951.
1968 through 1970 also seen a spike similar to now, but there is no indication based on the last 100 years data that this current high trend will get bigger, or even continue. .
As can be seen by the red highlighting, the data the graph is based on is still being reviewed and merged with the USGS Centennial List 1900-2002, maybe the 1980s will have a few surprises yet, but based on the review so far it would be safe to add 6 more per year average, up until 2004 when the data is reasonably accurate with EMSC and Geofon used for cross referencing.
Major World Earthquakes 314-2012
16 ? thats 1 below the 100 year annual average.
If I had time I'd have a look at Mag 6 -7 as well and see whats happening there, but that is harder to do accurately as many 6's are aftershocks of 7 - 9 magnitude quakes.
It is always possible the trend could go - more biguns 8+ and more 6's, with less 7's
edit on 15-4-2012 by muzzy because: (no reason
given)
reply to post by PuterMan
The stress redistribution from a given model of fault slip can be calculated. It's not simple - stress is a tensor - but has some intuitive aspects. Generally, if a fault segment unloads with motion in an earthquake, a fraction of the load is passed to the adjacent unbroken segments along the same fault. This leads to unzipping sequences of earthquakes, such as has been seen on the North Anatolian fault in Turkey in the last century.
Some nearby faults also do unload due to an earthquake, but the general rule is loading pumps up the earthquake rate dramatically, unloading drops the rate where few events were likely in the next week anyway, so overall the rate of earthquakes only goes up for a while when stress is redistributed, even if equal areas were loaded and unloaded.
reply to post by JohnVidale
Thanks John.
Is this within the realms of possibility for mere mortals or does it require use of the Philosophers Stone?
Thanks John.
The stress redistribution from a given model of fault slip can be calculated.
Is this within the realms of possibility for mere mortals or does it require use of the Philosophers Stone?
reply to post by muzzy
Nothing puzzling about Mr Muzzy. For there to be an average of 17, which is what you are saying, there have to be numbers above and below.
This year could be below. If it is above the average will go up. Simple statistics.
16 ? thats 1 below the 100 year annual average
Nothing puzzling about Mr Muzzy. For there to be an average of 17, which is what you are saying, there have to be numbers above and below.
This year could be below. If it is above the average will go up. Simple statistics.
One quake that has always interested me in the Indonesian scheme of things is this one
g.co...
USGS only gave it a 7.3Mw and put it 242km further south west on the island of Sumatra.
Not a lot of data available about this quake, but perhaps it was the first sign things were about to break along the Sumatra Forearc Sliver Plate (name from Putermans map)
edit: my gut feeling is that that location ( both USGS's and Geofons) was an unusual one.
g.co...
Date/Time: 2004/7/25 14:34:21 UTC
Lat: -0.5 Long: 105.1
Location: Indonesia: Lingga is. Coast, Sumatra
Magnitude: 8.1 Mw
Depth: - km
Source: German Research Centre for Geosciences (GFZ)
USGS only gave it a 7.3Mw and put it 242km further south west on the island of Sumatra.
Not a lot of data available about this quake, but perhaps it was the first sign things were about to break along the Sumatra Forearc Sliver Plate (name from Putermans map)
edit: my gut feeling is that that location ( both USGS's and Geofons) was an unusual one.
edit on 15-4-2012 by muzzy because: (no reason given)
reply to post by PuterMan
yep , I'm thinking when I finally review 1900-1947 and 1984-2012 the stats will show the average will be more in the low 20's per year.
What was the USGS estimated average again? I can't find it right away USGS is a mess right now ( as you noted)
yep , I'm thinking when I finally review 1900-1947 and 1984-2012 the stats will show the average will be more in the low 20's per year.
What was the USGS estimated average again? I can't find it right away USGS is a mess right now ( as you noted)
edit on 15-4-2012 by muzzy
because: (no reason given)
reply to post by muzzy
The page is still there, just not easy to find any longer. FAQ > Statistics I think it was
earthquake.usgs.gov...
Answer 15
The page is still there, just not easy to find any longer. FAQ > Statistics I think it was
earthquake.usgs.gov...
Answer 15
Originally posted by JohnVidale
Some nearby faults also do unload due to an earthquake, but the general rule is loading pumps up the earthquake rate dramatically, unloading drops the rate where few events were likely in the next week anyway, so overall the rate of earthquakes only goes up for a while when stress is redistributed, even if equal areas were loaded and unloaded.
So are you talking about shear stress or compressional stress? I understand certain rock types exhibit different retention and elasticity characteristics, for different kinds of compressional or shear stress. And this is where things can get real complicated real fast, as different rheology plays a part in all this, depending on exactly where we are talking about- and the known rock types in that area... Pretty fascinating subject, if you have a lifetime or two to study it...
I wonder what portion of each of these stress types is actually just dissipated, without additional load to nearby faults. Again I suppose that must depend entirely on the area makeup. And on the type of slip that occurs, the orientation of the faulting mechanism, and degree of slip.
Yup. In over my head.
new topics
-
University of Texas Instantly Shuts Down Anti Israel Protests
Education and Media: 43 minutes ago -
Any one suspicious of fever promotions events, major investor Goldman Sachs card only.
The Gray Area: 2 hours ago -
God's Righteousness is Greater than Our Wrath
Religion, Faith, And Theology: 7 hours ago -
Electrical tricks for saving money
Education and Media: 10 hours ago -
VP's Secret Service agent brawls with other agents at Andrews
Mainstream News: 11 hours ago
top topics
-
VP's Secret Service agent brawls with other agents at Andrews
Mainstream News: 11 hours ago, 10 flags -
Cats Used as Live Bait to Train Ferocious Pitbulls in Illegal NYC Dogfighting
Social Issues and Civil Unrest: 15 hours ago, 8 flags -
Nearly 70% Of Americans Want Talks To End War In Ukraine
Political Issues: 12 hours ago, 4 flags -
Electrical tricks for saving money
Education and Media: 10 hours ago, 4 flags -
Sunak spinning the sickness figures
Other Current Events: 12 hours ago, 3 flags -
Late Night with the Devil - a really good unusual modern horror film.
Movies: 14 hours ago, 2 flags -
Any one suspicious of fever promotions events, major investor Goldman Sachs card only.
The Gray Area: 2 hours ago, 2 flags -
The Good News According to Jesus - Episode 1
Religion, Faith, And Theology: 17 hours ago, 1 flags -
God's Righteousness is Greater than Our Wrath
Religion, Faith, And Theology: 7 hours ago, 0 flags -
University of Texas Instantly Shuts Down Anti Israel Protests
Education and Media: 43 minutes ago, 0 flags
active topics
-
Reason of the Existence
The Gray Area • 20 • : belkide -
Black mirror, what happened.
Television • 20 • : seekshelter -
Any one suspicious of fever promotions events, major investor Goldman Sachs card only.
The Gray Area • 5 • : BeyondKnowledge3 -
Nearly 70% Of Americans Want Talks To End War In Ukraine
Political Issues • 29 • : andy06shake -
God's Righteousness is Greater than Our Wrath
Religion, Faith, And Theology • 25 • : andy06shake -
Russia Ukraine Update Thread - part 3
World War Three • 5730 • : Arbitrageur -
VP's Secret Service agent brawls with other agents at Andrews
Mainstream News • 43 • : Hakaiju -
Everest-sized ‘Devil comet’ Pons-Brooks Visible Now
Space Exploration • 17 • : Compendium -
Nakedeye Mother of Dragons Comet Is Here!
Space Exploration • 5 • : Compendium -
HORRIBLE !! Russian Soldier Drinking Own Urine To Survive In Battle
World War Three • 38 • : BernnieJGato