It looks like you're using an Ad Blocker.
Please white-list or disable AboveTopSecret.com in your ad-blocking tool.
Thank you.
Some features of ATS will be disabled while you continue to use an ad-blocker.

What is going on with this weather???
page: 4share:
Originally posted by juleol
reply to post by timidgal
It is called cycles... It is not the first time this has happened and wont be the last.
Most folks don't realize that 11 years ago there was no ATS, or place to discuss topics such as this. Thankfully in 11 years we have all this easily accessible data to look back on.
And as of 0622 local time we north of Moscow are having the best, large-flaked snowfall of this year and -1 C with heavy wind gusts up to 14 m/s.
Usually Winter comes in early November, but it's now December and the temperatures are still barely below zero. Seems like a weird, but good weather
to me. Though being a Russian I couldn't dislike temperatures below -15 C more. You can't go anywhere without freezing your tail off. So do we get
to see OP's data on possible temperature anomalies around the world soon?
Thanks to everyone who participated in this thread. We had posters from all over the world including many across the United States (California, a few
from Colorado, Northeastern Connecticut, DC, Florida, southern Illinois, Louisiana, a few from Michigan, Minnesota, Missouri, a few from New York, a
few from Pennsylvania, South Caroline, Tennessee, a few from Texas, Virginia, Washington state and a nonspecific part of the Pacific Northwest) as
well as several from across the globe including Australia, Canada, Norway, Russia, Sweden and several from the UK.
For those who gave specific data about actual temperatures in their areas on or around 11.28.2011 (the date of my OP), I'll respond in the subsequent post below with the actual high/low temps in their area for 11.28.2011 versus average temps on that date across the last many years, (courtesy of a great website Weather Underground, provided by Phage).
Most people didn't provide their geographical specifics but contributed to the thread in other ways - some positive (thanks for the great sources of data relative to different theories from WakeUpRiseUp, yourboycal2, davidgrouchy and Phage ** and a special to RumET in Moscow who has been on a personal crusade for the past 10 months to keep a weather diary detailing the temperature and weather pressure every hour - wow**) and some that were not so positive or irrelevant to the topic at hand, which I’m overlooking since they serve no purpose to this discussion.
There were a few posters - in Washington State, the Pacific NW, Mid Missouri, Dallas, New Orleans and at least one poster in the UK - who said that temperatures were more or less around the average for this time of year. There was only one, in Houston, who said it was actually colder than average (although the stats below show a few other areas as well). The large majority said that it was mildly to severely warmer than usual and to that end, there were a number of comments about plants and trees re-blooming, bees coming back out of their early winter hibernation, the need to sleep with windows opened or air conditioners on and how, in general, various species of mammal, insect and fauna seem to be discombobulated by the unusualness of the weather. It's certainly not the first time such an occurrence has happened and I'm sure it's not going to be the last; however, what stood out the most was the vast majority of posters who commented on the violability of the weather and how the fluctuations they're experiencing are extreme and unpredictable - in some instances from week to week, in some from year to year (as pointed out by Hellhound604 who noted that his/her local press has reported that in 2011 Norway experienced the hottest November in the last 150 years compared to last November, which was the coldest on record for the last 100 years) and in at least one instance, a severe change which occurred over the course of a few hours (as noted by HappyBunny in PA who experienced a 20 degree drop in temperature since lunchtime on the day of his/her posting although this could have been attributable to a cold front having moved in).
This was an interesting experiment and I thank everyone who took the time to post. Regardless of why you think it's happening (El Nino, La Nina, weather cycles, time cycles, solar anomalies, some type of natural rebalancing process, etc.) or other unnatural reasons (global warming, weather manipulation, etc.), we can safely say that MOST of us are experiencing unusual warming trends and increased levels of volatility/unpredictability in our weather patterns which are not confined to any particular region. According to NOAA, as reflected on the table here, the period of December 2010 to October 2011, proved to be either colder than usual or average; however, in relation to what has been experienced here in the Northeast portion of the US and reported by many others in other areas, this data would be contrary to actual experience and would also rule out some type of El Nino/La Nina event since last April when the temperatures more or less normalized according to this table (if I'm reading the stats correctly). Again, this seems to be contrary to what many believe to be the cause of the unusual weather. It will be interesting to see what the November stats show which have not yet been posted.
To paraphrase casinoed, who was kind enough to provide specifics relative to different regions of Sweden, something “weird” is definitely afoot and it’s being experienced across the entire globe at noticeable levels. Whether due to natural or unnatural reasons, it's something that warrants continuous discussion and a permanent spotlightt since the ramifications can ultimately be disasterous.
The following data is compiled from the daily almanac provided on the Weather Underground website for
11.28.2011. Listed are the approximate locations indicated by specific posters.
For those who indicated a general location (such as state, country or geographic region only), I had to improvise and select a city that seemed to fit the description.
In all instances, the stats are indicated in both Fahrenheit and Celsius (with the appropriate georgraphical measurement being used first) so that we can all see some of the vast disparities.
The statistics are relfected as follows:
1. The first set of numbers represent the high/low temps on the specific date, 11.28.2011, and
2. the second set represents the average high/low temps for November 28th over the span of many years.
Bold data reflects higher than normal temps and Bold Italic data reflects lower than normal temps. Areas with normal temps have no special formatting.
La Canada, CA = 81/49 and 56/45 (+27.2/+9 and +18.3/+6.1 C)
Colorado Springs, CO = 67/27 and 45/19 (+19.4/+1.1 and +7.2/-7.2 C)
Denver, CO = 63/30 and 45/22 (+17.2/-1.1 and +7.2/-5.6 C)
North Haven, CT = 63/46 and 48/28 (+17.2/+7.8 and +8.9/-2.2 C)
Washington, DC = 71/51 and 53/37 (+21.7/+10.6 and +11.7/+2.8 C)
Ponte Vedra, FL = 75/53 and 67/53 (+23.9/+11.7 and +19.4/+11.7 C)
Carbondale, IL = 39/37 and 51/31 (+3.9/+2.8 and +10.6/-0.6 C)
New Orleans, LA = 60/40 and 64/47 (+15.6/+4.4 and +17.8/+8.3 C)
Ann Arbor, MI = 41/34 and 42/27 (+5/+1.1 and +5.6/-2.8 C)
]Jefferson City, MI = 37/32 and 46/26 (+2.8/0 and +7.8/-3.3 C)
St. Cloud, MN = 42/20 and 31/15 (+5.6/-6.7 and -0.6/-9.4 C)
New York, NY = 72/52 and 41/30 (+22.2/+11.1 and +5/-1.1 C)
Schenectady, NY = 60/48 and 43/28 (+15.6/+8.9 and +6.1/-2.2 C)
Syracuse, NY = 62/45 and 43/29 (+16.7/+7.2 and +6.1/-1.7 C)
Portland, OR = 47/37 and 49/38 (+8.3/+2.8 and +9.4/+3.3 C)
Philadelphia, PA = 71/50 and 49/33 (+21.7/+10 and +9.4/+0.6)
Pittsburgh, PA = 63/53 and 54/34 (+17.2/+11.7 and +12.2/0 C)
Columbia, SC = 74/47 and 64/41 (+23.3/+8.3 and +17.8/+5 C)
Memphis, TN = 39/33 and 57/39 (+3.9/+0.6 and +13.9/+3.9 C)
Dallas, TX = 57/36 and 58/29 (+13.9/+2.2 and +14.4/-1.7 C)
Houston, TX = 58/34 and 68/48 (+14.4/+1.1 and +20/+8.9 C)
Richmond, VA = 72/55 and 57/36 (+22.2/+12.8 and +13.9/+2.8 C)
Seattle, WA = 48/37 and 46/36 (+8.9/+2.8 and +7.8/+2.8 C)
Granite Downs, Australia = +37.8/+18.9 and no average listed (100/66 F)
Quebec, Canada = +10.6/-2.2 and -4.4/-12.8 (51/28 and 24/9 F)
Falmouth, England = +12.8/+8.9 and +8.3/+4.4 (55/48 and 47/40 F)
London, England = +12.8/0 and +7.2/-3.3 (55/32 and 45/26 F)
Haugesund, Norway = +8.9/+5 and +3.9/0 (48/41 and 39/32 F)
Moscow, Russia = +5/+0.6 and -4.4/-10 (41/33 and 24/15 F)
Stockholm, Sweden = +5.6/+0.6 and +0.6/-3.3 (42/33 and 33/26 F)
edit on 12/5/2011 by timidgal because: (no reason given)
Here in the UK we have only just started getting cold weather, I see the first frost this morning while going to work!.. This weather should have been
here in early November...strange! Also I remember taking my girl trick or treating last Halloween it was freezing, scarf, woolyhat job. This year I
was in a t shirt!
jay
jay
reply to post by ototheb85
Just awoke to the biggest hail stones, I have ever seen, was about an inch deep after 3 mins.
My cat was covered in them and not very happy with me lol.
Just awoke to the biggest hail stones, I have ever seen, was about an inch deep after 3 mins.
My cat was covered in them and not very happy with me lol.
im in australia its should be hot and i mean hot around dec in its 30s 40s but not this year im in long pants and have a jumper on dam its cold lol
reply to post by ototheb85
Yes Iam, you in the south? Got lime in that pint of lager have you? or is ot shandy?
Yes Iam, you in the south? Got lime in that pint of lager have you? or is ot shandy?
edit on 5-12-2011 by boymonkey74 because: (no reason
given)
reply to post by boymonkey74
Oh they just mentioned the hales stones on the radio 1 news, Haha and I drink Guinness and Jamison mate, no fruit in my drinks.:-)
and yeah just north of london
Oh they just mentioned the hales stones on the radio 1 news, Haha and I drink Guinness and Jamison mate, no fruit in my drinks.:-)
and yeah just north of london
edit on 5-12-2011 by ototheb85 because: (no reason given)
The weather here is going to be hot again. Today and tomorrow it will be sunshine with high temperatures tying or breaking records around my area.
81°F (27.2°C) in my town but 85°F (29.4°C) in the neighboring town with lows at 60°F (15.6°C), they are saying it could be even warmer tomorrow
and again on Wednesday as the cold front moves in. Thursday though the highs will be struggling to reach 61° (16.1°C), which is a lot better imo, I
need a break from the awful summer we had and so far this break is not happening.
Thank you so much for compiling the data OP. I know it can be a lot of hard work. Pleas keep in mind though that Weather Underground measures
temperature inside the Moscow's island of heat. Thus the values are somewhat higher then at my location. If you need a good reference for
temperatures, use Metar data for UUEE airport I'd also like to use this opportunity for sending a "Svææær hei!" to my comrades in Norway. I
miss the humid and mild coastal climate of that beautiful country. And I miss the autumn storms where the sea waves go high.
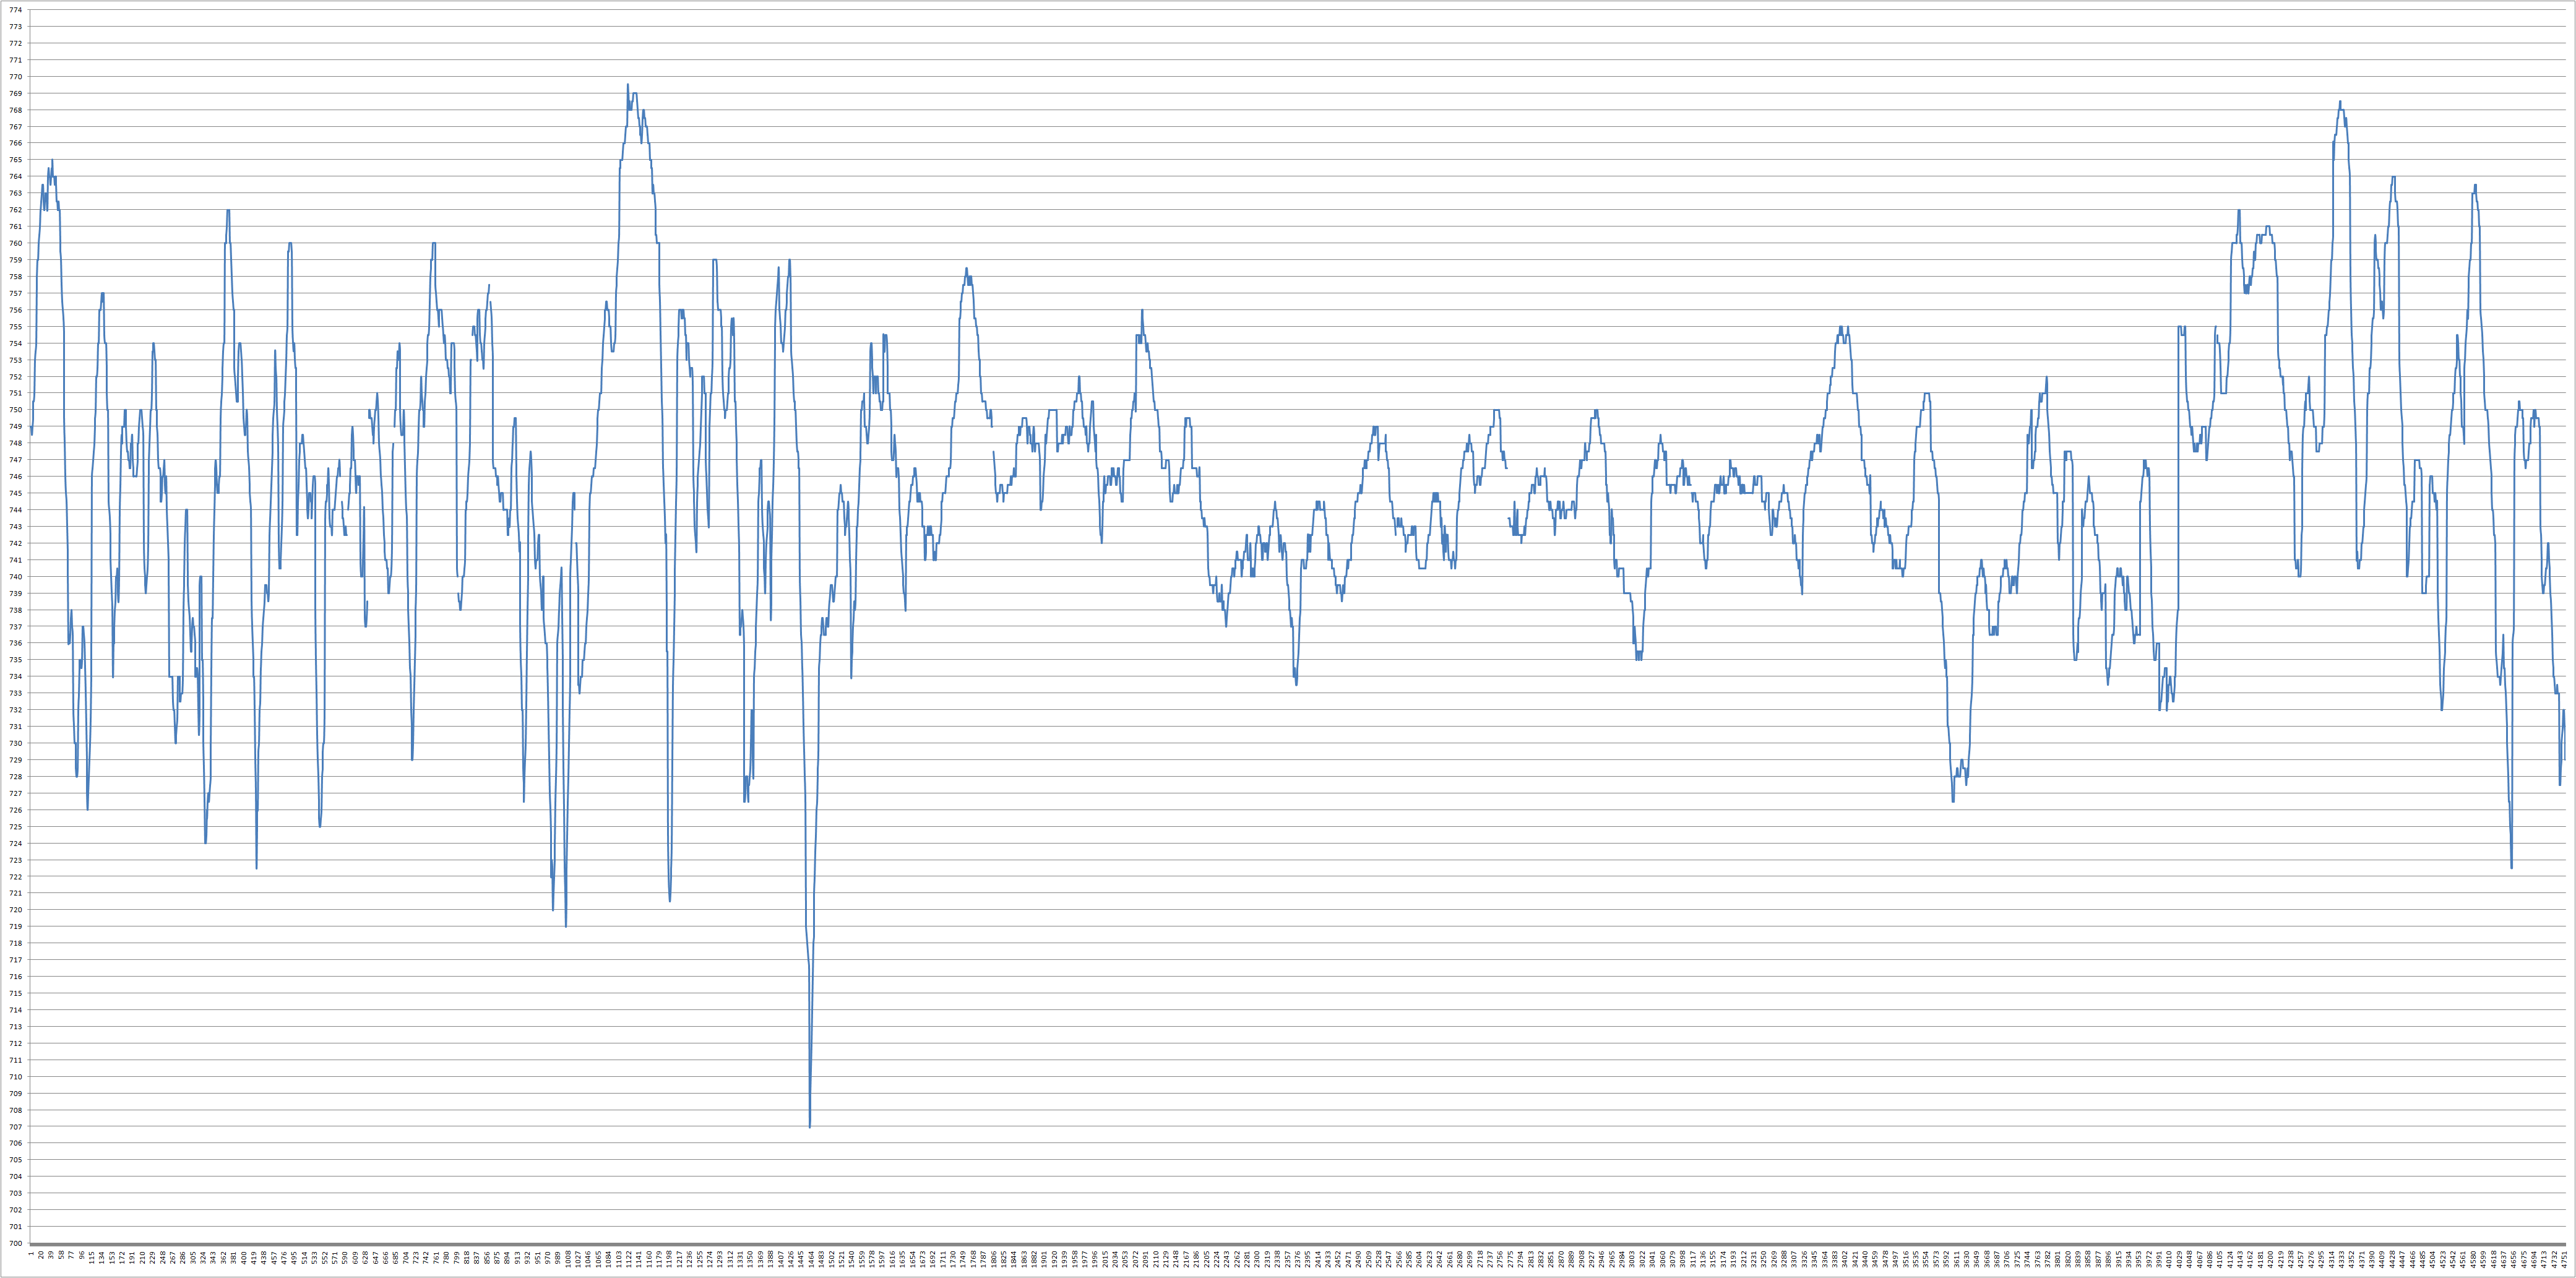
Today we've had the warmest day in the last couple of months I'd say, the high has been a whopping +4.5 C with the low being +2 C which is a large change from 2 inches of snow and zero degrees yesterday. And it's a +7 C anomaly over the top of the warmth spectrum. We've also had some high gales and our air pressure was rather low. A graph follows showing the air pressure north of Moscow at my observation point with a spring (mechanic, not season of the year) barometer with the measuring units being mmHG (Millimeters Quicksilver (Mercury) / Torr )
The data is compiled from April till today, and it's a very large image (dimension wise) as usual. I hope it'll fit in my image area on ATS. The lowest air pressure of the measuring period was 707 mmHg and the highest was 769.5 mmHg, which is a jump of almost 70 millimeters of Quicksilver. For conversion rates to mbar one needs to input ' * Torr in mbar' into Google search. It's rather quirky, but it would give one a good idea of how the climate has been the last months north of Moscow. So here it is, the mother of all air pressure charts done in Excel! It
does have more gaps then my temperature graph due to the sheer task of watching the pressure each hour manually. An observation I've made is that the
pressure never fell faster then 1,8 mmHg/h and never rose quicker then 1,5 mmHg/h.
It
does have more gaps then my temperature graph due to the sheer task of watching the pressure each hour manually. An observation I've made is that the
pressure never fell faster then 1,8 mmHg/h and never rose quicker then 1,5 mmHg/h.
So it's not by any means any scientific proof of anything. Just a hobby of mine... gone somewhat obsessive and crazy, but I enjoy it, and it doesn't harm anything but my fingers tapping on the barometer glass. Alright back to watching snooker and listening to the heavy rain pitter outside. By the way, heard there was a Thundersnow event in Poland yesterday.
Addendum 1: Excel hung up rendering the smooth graph. Over 4700 single points of data.
Addendum 2: After some percussive maintenance Excel up and running and image added to my post.
Today we've had the warmest day in the last couple of months I'd say, the high has been a whopping +4.5 C with the low being +2 C which is a large change from 2 inches of snow and zero degrees yesterday. And it's a +7 C anomaly over the top of the warmth spectrum. We've also had some high gales and our air pressure was rather low. A graph follows showing the air pressure north of Moscow at my observation point with a spring (mechanic, not season of the year) barometer with the measuring units being mmHG (Millimeters Quicksilver (Mercury) / Torr )
The data is compiled from April till today, and it's a very large image (dimension wise) as usual. I hope it'll fit in my image area on ATS. The lowest air pressure of the measuring period was 707 mmHg and the highest was 769.5 mmHg, which is a jump of almost 70 millimeters of Quicksilver. For conversion rates to mbar one needs to input ' * Torr in mbar' into Google search. It's rather quirky, but it would give one a good idea of how the climate has been the last months north of Moscow. So here it is, the mother of all air pressure charts done in Excel!
 It
does have more gaps then my temperature graph due to the sheer task of watching the pressure each hour manually. An observation I've made is that the
pressure never fell faster then 1,8 mmHg/h and never rose quicker then 1,5 mmHg/h.
It
does have more gaps then my temperature graph due to the sheer task of watching the pressure each hour manually. An observation I've made is that the
pressure never fell faster then 1,8 mmHg/h and never rose quicker then 1,5 mmHg/h. So it's not by any means any scientific proof of anything. Just a hobby of mine... gone somewhat obsessive and crazy, but I enjoy it, and it doesn't harm anything but my fingers tapping on the barometer glass. Alright back to watching snooker and listening to the heavy rain pitter outside. By the way, heard there was a Thundersnow event in Poland yesterday.
Addendum 1: Excel hung up rendering the smooth graph. Over 4700 single points of data.
Addendum 2: After some percussive maintenance Excel up and running and image added to my post.
The temperature will drop 50°F (28°) within 18 hours here because of this powerful cold front moving through; it is quite incredible for Florida.
The high temperature is 81° (27°) here today, so far it has reached 80° (27°), but will be at 31° (-1°) at 7am tomorrow morning and a high
tomorrow of only 59° (15°). Wind here is gusting upwards of 35mph too and will increase overnight so who knows what the wind chill will be.
new topics
-
Is the origin for the Eye of Horus the pineal gland?
General Conspiracies: 48 minutes ago -
Man sets himself on fire outside Donald Trump trial
Mainstream News: 59 minutes ago -
Biden says little kids flip him the bird all the time.
2024 Elections: 1 hours ago -
The Democrats Take Control the House - Look what happened while you were sleeping
US Political Madness: 1 hours ago -
Sheetz facing racial discrimination lawsuit for considering criminal history in hiring
Social Issues and Civil Unrest: 1 hours ago -
In an Historic First, In N Out Burger Permanently Closes a Location
Mainstream News: 3 hours ago -
MH370 Again....
Disaster Conspiracies: 4 hours ago -
Are you ready for the return of Jesus Christ? Have you been cleansed by His blood?
Religion, Faith, And Theology: 6 hours ago -
Chronological time line of open source information
History: 7 hours ago -
A man of the people
Diseases and Pandemics: 9 hours ago
top topics
-
Israeli Missile Strikes in Iran, Explosions in Syria + Iraq
World War Three: 17 hours ago, 19 flags -
In an Historic First, In N Out Burger Permanently Closes a Location
Mainstream News: 3 hours ago, 14 flags -
The Democrats Take Control the House - Look what happened while you were sleeping
US Political Madness: 1 hours ago, 8 flags -
Thousands Of Young Ukrainian Men Trying To Flee The Country To Avoid Conscription And The War
Other Current Events: 14 hours ago, 7 flags -
Iran launches Retalliation Strike 4.18.24
World War Three: 17 hours ago, 6 flags -
12 jurors selected in Trump criminal trial
US Political Madness: 17 hours ago, 4 flags -
4 plans of US elites to defeat Russia
New World Order: 10 hours ago, 4 flags -
A man of the people
Diseases and Pandemics: 9 hours ago, 4 flags -
Man sets himself on fire outside Donald Trump trial
Mainstream News: 59 minutes ago, 4 flags -
Biden says little kids flip him the bird all the time.
2024 Elections: 1 hours ago, 3 flags
active topics
-
Thousands Of Young Ukrainian Men Trying To Flee The Country To Avoid Conscription And The War
Other Current Events • 25 • : twistedpuppy -
Silent Moments --In Memory of Beloved Member TDDA
Short Stories • 46 • : Encia22 -
Man sets himself on fire outside Donald Trump trial
Mainstream News • 8 • : BernnieJGato -
12 jurors selected in Trump criminal trial
US Political Madness • 73 • : ImagoDei -
The Democrats Take Control the House - Look what happened while you were sleeping
US Political Madness • 15 • : matafuchs -
Are you ready for the return of Jesus Christ? Have you been cleansed by His blood?
Religion, Faith, And Theology • 17 • : TheValeyard -
Israeli Missile Strikes in Iran, Explosions in Syria + Iraq
World War Three • 100 • : Astrocometus -
Biden says little kids flip him the bird all the time.
2024 Elections • 5 • : TheValeyard -
President BIDEN Warned IRAN Not to Attack ISRAEL - Iran Responded with a Military Attack on Israel.
World War Three • 46 • : ImagoDei -
"We're All Hamas" Heard at Columbia University Protests
Social Issues and Civil Unrest • 131 • : marg6043