It looks like you're using an Ad Blocker.
Please white-list or disable AboveTopSecret.com in your ad-blocking tool.
Thank you.
Some features of ATS will be disabled while you continue to use an ad-blocker.

The Up To The Minute Thread To Post Your Chem/Contrail Sightings.
page: 1share:
I know this has been threaded on before but I have every intention of posting one picture everytime I see a day of trails.
I wanted to give those who see Contrails/Chemtrails in the skies nearby a chance to post in a general thread dedicated to the sightings. I am not creating this thread for the purpose of debate but rather just a place to record your sightings. I don't care if a person is not convinced or simply doesn't believe in them. I do think however it will be intersting to see what patterns, if any , start to come out of this data. Pictures would be great. and preferred if possible but not required. These are just suggestions. I don't make the rules. Thanks alot and 1 or 2 pics maximum would be a safe guess I think. I will post one from this morning around 8:00 a.m.to get the thread started. Thanks everyone.
PS. If you can record the approx time of day/night you saw the trails and where. thx again..
I saw two earlier this morning today. Now it is raining and is going to supposedly end around 3:00 tomorrow.
Is there a place where I can find exactly what is in those chemtrails?
Is there a place where I can find exactly what is in those chemtrails?
I edited this post because on an afterthought I am not going to answer questions about the possible contents of jet exhaust. I want to stay on topic
and the topic is in my thread opening. There are plenty of threads where the paticulars or possibilities of various contents can be
discussed.
edit on 20-11-2011 by CherubBaby because: off topic.
reply to post by PunchingBag80
which alledged " chemtrails ? "
that is the logical fallacy of " chemtrails " - you are assuming they are real - then asking whats in them
if you mean the contrails left by jet traffic [ the persistance of which is determined by meteorological conditions - not chemical composition ] then the answer is simple
CO2 [ carbon dioxide ] -
H2O [ water vapour ]
HxCy [ hydrocarbons , from partial combustion of fuel and lubricant leaks ]
oxides of nitrogen
oxides of sulphur
Is there a place where I can find exactly what is in those chemtrails?
which alledged " chemtrails ? "
that is the logical fallacy of " chemtrails " - you are assuming they are real - then asking whats in them
if you mean the contrails left by jet traffic [ the persistance of which is determined by meteorological conditions - not chemical composition ] then the answer is simple
CO2 [ carbon dioxide ] -
H2O [ water vapour ]
HxCy [ hydrocarbons , from partial combustion of fuel and lubricant leaks ]
oxides of nitrogen
oxides of sulphur
reply to post by CherubBaby
Awesome idea for a thread CB. I have plenty of pics from previous sightings but I haven't seen many the last few days due to the constant cloud cover.
They are spraying here quite often though. I will make sure to post pictures with my sightings when possible.
I saw a black chemtrail for the first time ever. I know some people claim it to be shadow induced but I know this was not the fact as the ones I saw were situated in different areas getting different angles of sunlight.
Great idea. Could you also keep a log of the which days you see trails, and which you don't? Maybe even do it in a spreadsheet so graphs can be
generated, etc. Then after a year we can see if there's some kind of pattern, or unusual frequency.
I would suggest using a spreadsheet, with one column being the date, the next being the maximum number of contrails you see in the sky at once, and maybe the 3rd could link to the photo, or the post on ATS?
Here's an example spreadsheet on the free Google Docs. It's editable.
docs.google.com...
To make the date column:
- In cell A1 type Date
- In cell A2, enter the start date, like 11/20/2011
- in cell A3 type =A2+1
- Copy A3
- Highlight A4 down to the bottom
- paste A3 into that.
That should work the same in Excel or OpenOffice, if you want to do it offline.
That should give you some actual statistics to work with. After a few months you can cross-reference it with weather reports. Then if there's something actually going on, you'll have the scientific evidence to convince people.
reply to post by CherubBaby
I like the idea of this thread, as we have been getting a lot of this around here.
Where and what time is your pic, to use your idea of location and time?
I like the idea of this thread, as we have been getting a lot of this around here.
PS. If you can record the approx time of day/night you saw the trails and where. thx again..
Where and what time is your pic, to use your idea of location and time?
reply to post by 1SawSomeThings
Morning everyone. The picture I posted in the opening of this thread is dated and the time was approx 8-9 am. I am in Las Vegas Nv. It is now approx 750 am . I took this picture at 710.am this morning in Las Vegas Nv.
I like this picture. The jet is landing .
Morning everyone. The picture I posted in the opening of this thread is dated and the time was approx 8-9 am. I am in Las Vegas Nv. It is now approx 750 am . I took this picture at 710.am this morning in Las Vegas Nv.
I like this picture. The jet is landing .
It's about 8:00 pm on the 20th of Nov in Las Vegas,Nv. I cant take a picture of the sky that is clear with my camera because of the darkness . I can
however see the sky with my eyes and the trails continue as I post this. In the mrning I will repost unless something changes that is dramatic.
reply to post by CherubBaby
What kind of camera do you have? Generally you can still take a photo of the night sky by adjusting settings.
What kind of camera do you have? Generally you can still take a photo of the night sky by adjusting settings.
These are from 7 am EST Kingston, Ontario.
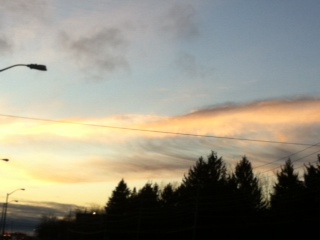
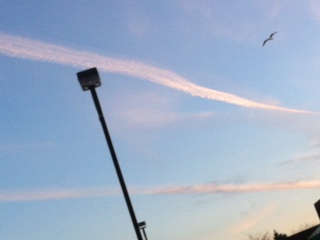
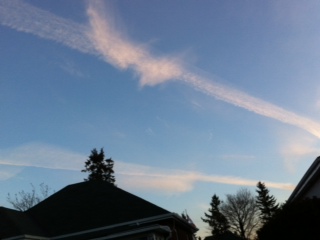
This last picture is not very clear but if you look real close you can see several chemtrails, they almost look like power lines.
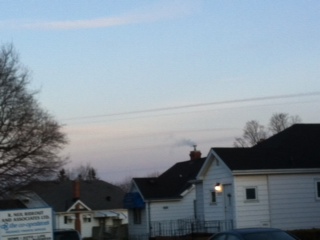
This last picture is not very clear but if you look real close you can see several chemtrails, they almost look like power lines.
edit on 21-11-2011 by Corruption Exposed because: (no reason given)
reply to post by Uncinus
Thought I would check in and say I didn't have time to click a pic today but the sky had nice natural clouds . Puff spots of them here and there .
I also wanted to address the "Camera" issue. I am a Veteran of The USMC. I own night vision. Have used night vision. I think I know how to use "My" camera. Thx for the offer. I really want this thread to stay on topic PLZ..
Nice cumulus clouds here in LA too.
I'm not sure night vision exactly translates to consumer camera. I was just trying to help.
Anyway, good project. I hope you keep a daily log. While day to day observatios are interesting, they are very inconclusive by themselves.
I'm not sure night vision exactly translates to consumer camera. I was just trying to help.
Anyway, good project. I hope you keep a daily log. While day to day observatios are interesting, they are very inconclusive by themselves.
Reply to post by CherubBaby
Glad you created this thread. Do not have pics, yet, but for a few weeks there has been alot of trails over eastern NC. I posted in a thread a week or so ago regarding a Z (or N) in the sky one night while I was at work. I understand the concept of contrails but what I do not understand is why the sky is full of them one day and not the next, and the temp is pretty much equal both days. I will attempt to find out what flights are flying over the next time theres tons of them in the sky at once. Been happening quite a bit lately, as many as 15 in the sky at once. Maybe it is normal for fall temps, but I do not recall it being this bad EVER, and I take Jesus' advice and keep an eye on the sky. Hopefully I will have pics later this week. Peace.
Posted Via ATS Mobile: m.abovetopsecret.com
Glad you created this thread. Do not have pics, yet, but for a few weeks there has been alot of trails over eastern NC. I posted in a thread a week or so ago regarding a Z (or N) in the sky one night while I was at work. I understand the concept of contrails but what I do not understand is why the sky is full of them one day and not the next, and the temp is pretty much equal both days. I will attempt to find out what flights are flying over the next time theres tons of them in the sky at once. Been happening quite a bit lately, as many as 15 in the sky at once. Maybe it is normal for fall temps, but I do not recall it being this bad EVER, and I take Jesus' advice and keep an eye on the sky. Hopefully I will have pics later this week. Peace.
Good morning all. It's 9:00 a.m.PST and I have to say once again I am dumbfounded. I went out at 7:45 am and the sky was totally clear !! No trails
at all. I can in and had a cup of coffee and at 8:30 am I thought about this thread so I went and looked and here is what the sky had become in 45
mins ,,
and this one,
and this,
You have to be joking me...
PS I will possibly repost because they are hammering it now.
and this one,
and this,
You have to be joking me...
PS I will possibly repost because they are hammering it now.
I think it's very likely that that is pre-existing clouds (or contrail clouds) that simply blew over your location. Nothing coming out of the back of
a plane is going to spread like that in 45 minutes.
reply to post by Uncinus
Thank you but what you think is not really the issue . The issue is that you are off topic again.
Thank you but what you think is not really the issue . The issue is that you are off topic again.
Well, the topic is "Chem/Contrail Sightings", and for that to work you need to be able to distinguish it from normal clouds.
So if you post photos of things that look like normal clouds, and you did not see them form, then how do you know they are Chem/Contrails?
So if you post photos of things that look like normal clouds, and you did not see them form, then how do you know they are Chem/Contrails?
new topics
-
Iran launches Retalliation Strike 4/18/24
World War Three: 12 minutes ago -
Israeli Missile Strikes in Iran, Explosions in Syria + Iraq
World War Three: 43 minutes ago -
George Knapp AMA on DI
Area 51 and other Facilities: 6 hours ago -
Not Aliens but a Nazi Occult Inspired and then Science Rendered Design.
Aliens and UFOs: 6 hours ago -
Louisiana Lawmakers Seek to Limit Public Access to Government Records
Political Issues: 8 hours ago -
The Tories may be wiped out after the Election - Serves them Right
Regional Politics: 9 hours ago -
So I saw about 30 UFOs in formation last night.
Aliens and UFOs: 11 hours ago
top topics
-
BREAKING: O’Keefe Media Uncovers who is really running the White House
US Political Madness: 13 hours ago, 25 flags -
George Knapp AMA on DI
Area 51 and other Facilities: 6 hours ago, 19 flags -
Biden--My Uncle Was Eaten By Cannibals
US Political Madness: 14 hours ago, 18 flags -
"We're All Hamas" Heard at Columbia University Protests
Social Issues and Civil Unrest: 14 hours ago, 7 flags -
Louisiana Lawmakers Seek to Limit Public Access to Government Records
Political Issues: 8 hours ago, 7 flags -
Israeli Missile Strikes in Iran, Explosions in Syria + Iraq
World War Three: 43 minutes ago, 6 flags -
So I saw about 30 UFOs in formation last night.
Aliens and UFOs: 11 hours ago, 5 flags -
Do we live in a simulation similar to The Matrix 1999?
ATS Skunk Works: 12 hours ago, 3 flags -
Not Aliens but a Nazi Occult Inspired and then Science Rendered Design.
Aliens and UFOs: 6 hours ago, 3 flags -
The Tories may be wiped out after the Election - Serves them Right
Regional Politics: 9 hours ago, 3 flags
active topics
-
Iran launches Retalliation Strike 4/18/24
World War Three • 2 • : nerbot -
Israeli Missile Strikes in Iran, Explosions in Syria + Iraq
World War Three • 11 • : Unknownparadox -
It has begun... Iran begins attack on Israel, launches tons of drones towards the country
World War Three • 882 • : matafuchs -
British TV Presenter Refuses To Use Guest's Preferred Pronouns
Education and Media • 62 • : fringeofthefringe -
So I saw about 30 UFOs in formation last night.
Aliens and UFOs • 21 • : BrotherKinsMan -
President BIDEN Warned IRAN Not to Attack ISRAEL - Iran Responded with a Military Attack on Israel.
World War Three • 42 • : WeMustCare -
MULTIPLE SKYMASTER MESSAGES GOING OUT
World War Three • 36 • : Irishhaf -
Candidate TRUMP Now Has Crazy Judge JUAN MERCHAN After Him - The Stormy Daniels Hush-Money Case.
Political Conspiracies • 386 • : WeMustCare -
-@TH3WH17ERABB17- -Q- ---TIME TO SHOW THE WORLD--- -Part- --44--
Dissecting Disinformation • 535 • : cherokeetroy -
African "Newcomers" Tell NYC They Don't Like the Free Food or Shelter They've Been Given
Social Issues and Civil Unrest • 15 • : marg6043