It looks like you're using an Ad Blocker.
Please white-list or disable AboveTopSecret.com in your ad-blocking tool.
Thank you.
Some features of ATS will be disabled while you continue to use an ad-blocker.

So you're gonna tell me this is normal?
page: 2share:
reply to post by ELahrairah
Agreed. Weather has been happening longer on this planet than we have been recording and studying it. How can they say this is not normal when there is not enough data (200 + years worth, US army operated the first national weather service in 1878) to conclusivley say that this is not normal. Weather has been going on for billions of years this could easily just be cyclical.
Agreed. Weather has been happening longer on this planet than we have been recording and studying it. How can they say this is not normal when there is not enough data (200 + years worth, US army operated the first national weather service in 1878) to conclusivley say that this is not normal. Weather has been going on for billions of years this could easily just be cyclical.
Originally posted by Watts
radar.weather.gov...
Pick if you missed it:
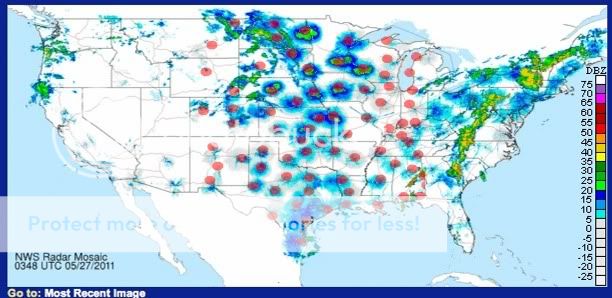
There's no way anyone can get me to believe this is normal. I've never seen radar returns like that until this year.
Local radar isn't an explanation for obvious reasons. I fit it was due to local radar, all cloud/precipitation would look like that on the entire map.

Radar returns centered around radar stations.
www.srh.noaa.gov...
[atsimg]http://files.abovetopsecret.com/images/member/68232cc93dcb.jpg[/atsimg]
I can't say its HAARP but I can say its not normal. To disagree is to be blind.
Funny you should say that. The coloring was recently changed to be more accessible to the colorblind. Which might be why it looks odd to you.
www.srh.noaa.gov...
Where is the old "black background" version?
In the "Standard Version" of the radar display, the background color was changed from black to white for accessibility reasons. The black background was less friendly to those with colorblindness. In fact the black background with green and red data (highways and county lines) is impossible for the 1 in 20 males to use. The white background complies with Section 508 accessibility requirements - which cannot be said for the black background.
I everyone. Ill like to post a new thread on the chemtrail but since I dont have yet 20 post, I can't create a new subject. I'am a true believer of
geoengineering. With all the documentation we have now, we can say it's a fact. Not a conspiracy. The question is more how and why.
I read an article on the french canadian broadcasting website this morning about the presence of bacteria in the ailstone. After a few research I found a link in english on the bbc website: www.bbc.co.uk...
The bacteria is call Pseudomonas syringae. You can find it everywhere on the earth. But one thing bring my attention to this bacteria.
The Pseudomonas syringae has the ability of Ice nucleating. This is not a big news. They actually use this bacteria for a while to create snow for ski resort. So, this ability it's well known. Wiki link : en.wikipedia.org...
I'am living in Quebec, Canada (that why my english it's so basic, yes, I'am a frenchy ), this spring, we had a lot of unusual ailstone here. I tough this was really weird because we don't have the habit of ailstone so often here. So when a saw this article, this fact came to my mind.
My hypothesis is they probably put some Pseudomonas syringae in the chemtrail cocktail to doing more easily cloud and rain in high altitude. When it's fell down, most of the time, the ailstone melt to simple rain. But often, they don't and that's why we can see more and more ailstone.
Anybody can do a better job and a new thread on this topic for me? I think we can find something with this new bacteria. Maybe it's presence is increase last few years... Or the illness on some trees increase too... I would like to have your comment and your contribution on this one.
Thanx to all atsers.
reply to post by Uncinus
In fact, if you overlay the two (in central US, since the maps geographically diverge quite a bit to the west and east)...
They line-up exactly.
In fact, if you overlay the two (in central US, since the maps geographically diverge quite a bit to the west and east)...
They line-up exactly.
Originally posted by weedwhacker
reply to post by Watts
I see you (conveniently??) cut off the title, on top of the image, on the website:
Base Reflectivity
Do you understand that there are, every year, more and more improved Doppler Radar installations being built?
DO you realize that a Doppler Radar antenna is located on the ground?
Do you understand, then, why the limit of the radar's ability to scan the area will be roughly circular? With a specif radius (depending on ground clutter, and terrain....obstructions, and slope?
Did you consider that, perhaps, this is possibly a new format, for the NWS site, in the means they display information??
Prior to starting a thread, with the veiled "OMG" in the title....would it behoove a responsible ATS member to do the least bit of research, and consider many of those (few) ideas, above??
Excellent points,all.
Why sensationalize something that is perfectly understandable?
Base Reflectivity
This is a display of echo intensity (reflectivity) measured in dBZ (decibels of Z, where Z represents the energy reflected back to the radar). "Reflectivity" is the amount of transmitted power returned to the radar receiver. Base Reflectivity images are available at several different elevation angles (tilts) of the antenna and are used to detect precipitation, evaluate storm structure, locate atmospheric boundaries and determine hail potential.
The base reflectivity image currently available on this website is from the lowest "tilt" angle (0.5°). This means the radar's antenna is tilted 0.5° above the horizon.
The maximum range of the "short range" (S Rng) base reflectivity product is 124 nm (about 143 miles) from the radar location. This view will not display echoes that are more distant than 124 nm, even though precipitation may be occurring at greater distances. To determine if precipitation is occurring at greater distances, select the "long range" (L Rng) view (out to 248 nm/286 mi), select an adjacent radar, or link to the National Reflectivity Mosaic.
weather.noaa.gov...
Base Reflectivity -- One of the three fundamental quantities (along with base [radial] velocity and spectrum width) that a Doppler radar measures. Reflectivity is related to the power, or intensity, of the reflected radiation that is sensed by the radar antenna. Base reflectivity is expressed on a logarithmic scale in units called dBZ. The term "base" refers to the product being "basic", with little advanced processing performed on the data. Base reflectivity is related to rainfall intensity (e.g., drop size and rainfall rate) and hail size (for large values of reflectivity).
www.teachmefinance.com...
In other words, Spring weather.
deny ignorance.
jw
edit on 27-5-2011 by jdub297 because: sp
reply to post by CLPrime
NO...they don't "diverge"!!!!
Dude (or, dudette)......the title was "reflectivity" of cloud coverage!!!
HINT: Doppler Radar will NOT paint anything, when nothing is there!!!
The 'overlay' is clear......the locations are obvious, and on any given day, weather is different....isn't it? Day-to-day, area-by-area, region-by-region......
Get it, yet?
reply to post by Watts
I forgot to answer your original question:
Yes!
deny ignorance.
jw
I forgot to answer your original question:
So you're gonna tell me this is normal?
Yes!
deny ignorance.
jw
reply to post by weedwhacker
"Dude" will do.
And, I think you misunderstood what I meant by "diverge"... maybe I wasn't as clear as I should've been.
When you overlay the radar station map and the current radar map, the geography of the US diverges to the west and east - that is, the radar station map bends upward at the sides, so the states (and all other locations) don't match up. In the middle, however, the maps are relatively lined up... and, luckily, the area in question is in the central US, so this is the only region that matters.
If you overlay the two maps yourself, you'll see what I mean. When you stretch the radar station map to make, say, Texas and the Great Lakes on one line up with Texas and the Great Lakes on the other, then both California and Maine on the radar station map end up being to the north of where they are on the current radar map. Hence, they diverge to the west and east.
So, I only included the radar station locations for the central US, where the two maps are able to be overlaid. And, in this region, the radar station locations and the locations of the "anomalous" radar returns line up.
reply to post by CLPrime
I looked, yet again......the "blue" stuff was the "reflectivity"....from the title of the graphic, remember?
OK....the pale pink circles all coincide with the locations, on the over-lay. NOT all places, where the Doppler Radar facilities were sited, had cloud coverage to *paint* returns!
Understand?
That was a *snap-shot* of a moment in time.
Getting clear?
The sites (in case you haven't understood, yet) with NO cloud coverage have NO *blue* areas. Also, not all Doppler locations had compete sky coverage, all around the 360° radius.
Make sense??
reply to post by weedwhacker
I understand just fine. I don't think you understand what I'm saying. All I'm saying is that the two maps don't have the same projection (you know...like, Mercator, Equal-Area, etc.), so, when I overlaid them, I couldn't match up both maps over the entire United States (not the locations of the stations or whatever...the maps, themselves). Because the radar station map uses more of a curved projection for its map than the live radar map, the two can only be matched up in the middle, where both maps are more-or-less horizontal.
If that still isn't clear, maybe someone who actually understands what I'm saying can explain it better than I am.
Or, maybe I should've just not mentioned that I had to cut off the sides of the radar station map (which is really all I'm saying), because my point is the same regardless... where there is an "anomalous" return on the live radar, there is a corresponding radar station (ETA: which means it's a normal, everyday artifact of the Doppler radar).
edit on 27-5-2011 by CLPrime because: (no reason given)
Yeah, it's normal. You are looking at a char that is showing Base reflectivity.
okfirst.mesonet.org...
Here, read and learn.
okfirst.mesonet.org...
Here, read and learn.
Originally posted by Watts
I've never seen radar returns like that until this year.
How long have you been watching radar in a daily basis?
There's nothing obviously abnormal there to me, but I don't look at US radar so I may be wrong. In any case, why do you think it is strange?
Originally posted by CLPrime
reply to post by weedwhacker
I understand just fine. I don't think you understand what I'm saying. All I'm saying is that the two maps don't have the same projection (you know...like, Mercator, Equal-Area, etc.), so, when I overlaid them, I couldn't match up both maps over the entire United States (not the locations of the stations or whatever...the maps, themselves). Because the radar station map uses more of a curved projection for its map than the live radar map, the two can only be matched up in the middle, where both maps are more-or-less horizontal.
See the FAQ. Yes, they use an odd projection, sounds like just raw lat/long for X and Y.
www.srh.noaa.gov...
Why is the image squashed? What projection is this?
The images appear elongated because of the Geographic Coordinate System (GCS) way of displaying the information. In order for GIS-based programs to ingest the Doppler radar data, the information is displayed in an UN-projected format. This means the display of information, intended for a spherical earth, becomes distorted when the image is viewed on a flat surface.
new topics
-
Supreme Court Oral Arguments 4.25.2024 - Are PRESIDENTS IMMUNE From Later Being Prosecuted.
Above Politics: 40 minutes ago -
Krystalnacht on today's most elite Universities?
Social Issues and Civil Unrest: 49 minutes ago -
Chris Christie Wishes Death Upon Trump and Ramaswamy
Politicians & People: 1 hours ago -
University of Texas Instantly Shuts Down Anti Israel Protests
Education and Media: 3 hours ago -
Any one suspicious of fever promotions events, major investor Goldman Sachs card only.
The Gray Area: 5 hours ago -
God's Righteousness is Greater than Our Wrath
Religion, Faith, And Theology: 10 hours ago
top topics
-
VP's Secret Service agent brawls with other agents at Andrews
Mainstream News: 14 hours ago, 11 flags -
Nearly 70% Of Americans Want Talks To End War In Ukraine
Political Issues: 15 hours ago, 5 flags -
Sunak spinning the sickness figures
Other Current Events: 15 hours ago, 5 flags -
Electrical tricks for saving money
Education and Media: 13 hours ago, 4 flags -
Late Night with the Devil - a really good unusual modern horror film.
Movies: 17 hours ago, 3 flags -
Krystalnacht on today's most elite Universities?
Social Issues and Civil Unrest: 49 minutes ago, 3 flags -
Supreme Court Oral Arguments 4.25.2024 - Are PRESIDENTS IMMUNE From Later Being Prosecuted.
Above Politics: 40 minutes ago, 3 flags -
Any one suspicious of fever promotions events, major investor Goldman Sachs card only.
The Gray Area: 5 hours ago, 2 flags -
University of Texas Instantly Shuts Down Anti Israel Protests
Education and Media: 3 hours ago, 2 flags -
Chris Christie Wishes Death Upon Trump and Ramaswamy
Politicians & People: 1 hours ago, 1 flags
active topics
-
Hate makes for strange bedfellows
US Political Madness • 46 • : network dude -
University of Texas Instantly Shuts Down Anti Israel Protests
Education and Media • 65 • : FlyersFan -
The Reality of the Laser
Military Projects • 48 • : 5thHead -
Nearly 70% Of Americans Want Talks To End War In Ukraine
Political Issues • 69 • : SchrodingersRat -
Supreme Court Oral Arguments 4.25.2024 - Are PRESIDENTS IMMUNE From Later Being Prosecuted.
Above Politics • 1 • : network dude -
Candidate TRUMP Now Has Crazy Judge JUAN MERCHAN After Him - The Stormy Daniels Hush-Money Case.
Political Conspiracies • 744 • : Threadbarer -
Truth Social goes public, be careful not to lose your money
Mainstream News • 129 • : matafuchs -
Krystalnacht on today's most elite Universities?
Social Issues and Civil Unrest • 2 • : marg6043 -
Remember These Attacks When President Trump 2.0 Retribution-Justice Commences.
2024 Elections • 56 • : WeMustCare -
British TV Presenter Refuses To Use Guest's Preferred Pronouns
Education and Media • 148 • : Consvoli