It looks like you're using an Ad Blocker.
Please white-list or disable AboveTopSecret.com in your ad-blocking tool.
Thank you.
Some features of ATS will be disabled while you continue to use an ad-blocker.

Are Earthquakes Really on the Increase? Study and facts
page: 134
share:
Shortly after Fukushima's earthquake in Japan, I did some technical research on seismology, which is a fascinating science and, more than ever, a
topical subject.
I particularly wanted to find out about the history of seismology and determine whether there were reliable and verifiable statistical datas.
So, I noticed that among the various websites and specialized forums addressing the issue, one of the most a recurring question is: "Has earthquake activity been increasing?"
Then, searching in USGS website if there's some informations, here's what I've found: (comments and notes are on the bottom page)
USGS datas
1- Are Earthquakes Really on the Increase?
source 1
source 2
2- Earthquake Facts and Statistics
source
3- Earthquake Facts and Statistics Graphs
I won't reproduce all the graphs that can be seen here, anyway, and in order to better understand in
one glance statistical issues, I've done a compiled graph "C":

ANSS datas
While most of the people knows USGS, ANSS (Advanced National Seismic System), which first 80 ANSS strong motion instruments were installed in San Francisco (40), Salt Lake City (20)
and Seattle (20) in 2000, is widely unknown from general public; however this organization also produce lots of datas, maps and lists compiled in catalogs for seismologists and
earthquake engineers, for teachers and the general public as well.
source
Mission:
1- ANSS Catalog Caveats (USA)
Full presentation here
Extract:
2- ANSS Composite Earthquake Catalog
This worldwide catalog serves as a basis for my statistical study about earthquakes possible increasing, see footnotes below.
source
------------------------------------------------------------------------------------------------------------------------------------------------------ -----------------------
Footnotes
(1) "earthquakes of magnitude 7.0 or greater have remained fairly constant throughout this century"
The graph "C" (see above), shows for the USGS datas between 1980 and 2011 an average increasing of the 7.0>7.99EQ of 7% (R2). Earthquakes above 8.0 have been neglected, since the
numbers of events is not enough significally.
Using ANSS datas from 1900 to 2011 give these graphs "D" and "E":
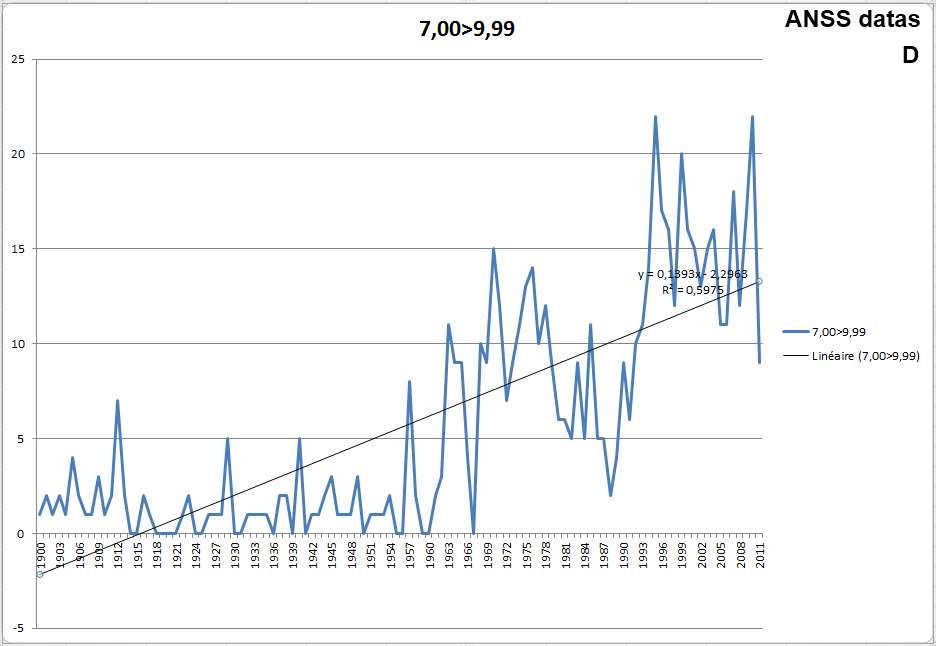
The graph "D" shows for the ANSS datas between 1900 and 2011 an average increasing of the 7.0+EQ of almost 60%. We could logically saying that it is probably mainly due to the
lack of sismograph at the beginning of the century, especially in inhabited areas; however, the globally and internationally detected earthquakes with a magnitude greater than 7.0
may suggest that these large earthquakes were all detected relatively quickly during this century.
Even if we limit the data, beginning from the 90s, we still can see an increase, albeit smaller (7%), but still present nonetheless:
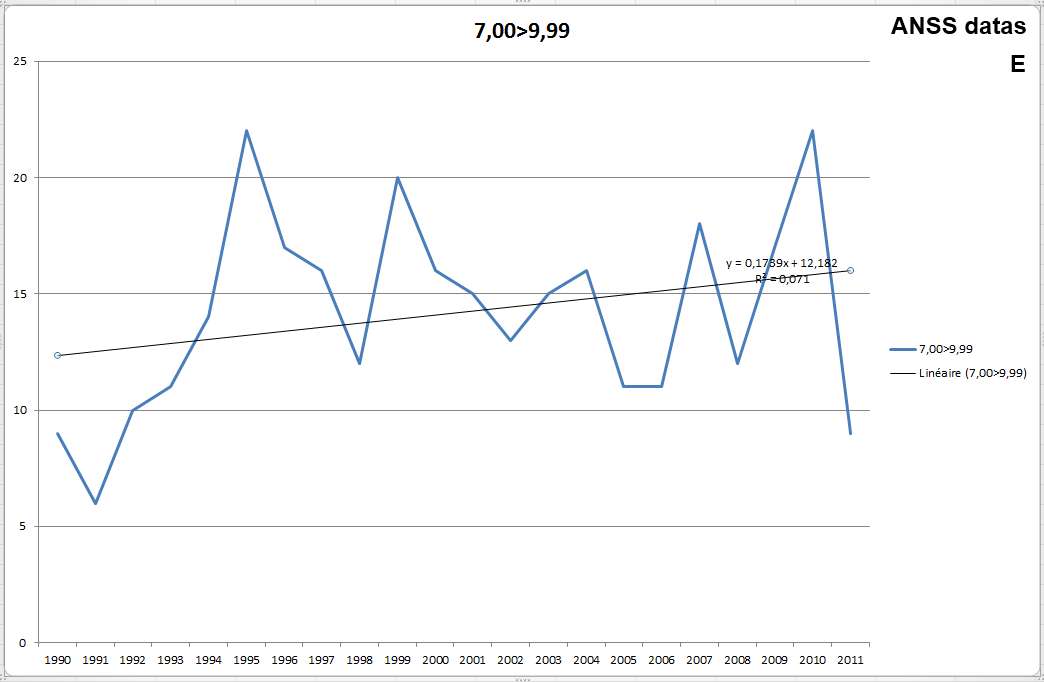
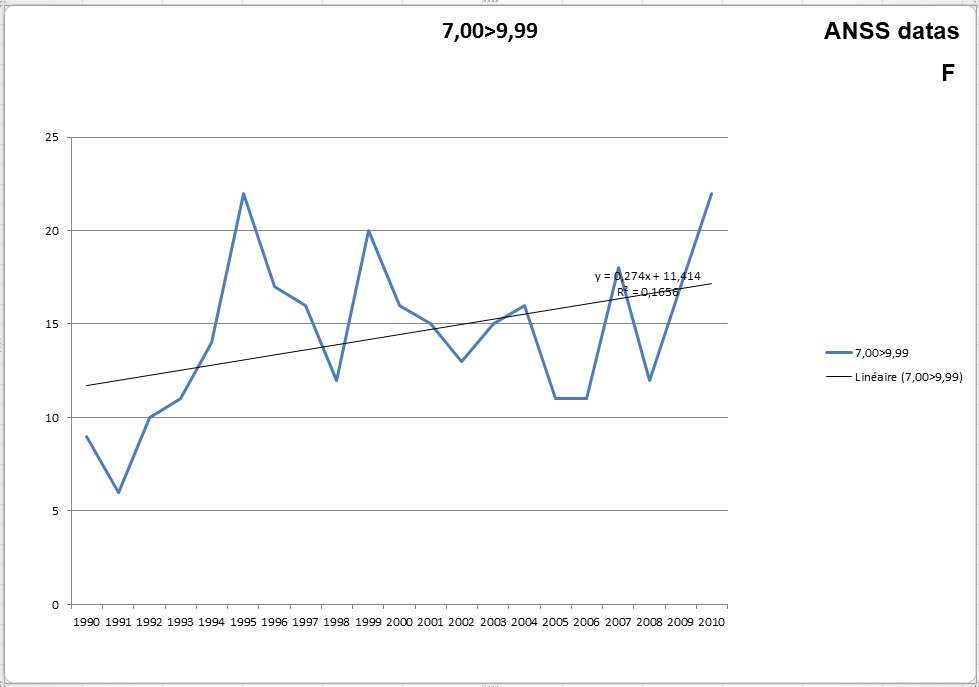
If we don't take account of the year 2011, the increase is even more important (16.5%), see graph "F":
(2) "earthquakes of magnitude 7.0 or greater [...] have actually seemed to decrease in recent years"
In fact, it depends what exactly means "recent years"....Firstly, let's not taking account of the 2011 datas, since the year is not complete yet.
If we start the stats before 1980, both USGS and ANSS datas show exactly the opposite, but, as I said above, this could be due to the lack of seismograph to cover the whole globe.
If we start the stats in 1980 using USGS datas, the percentage of earthquakes increase above 7.0 is of 20%, see graph "G":

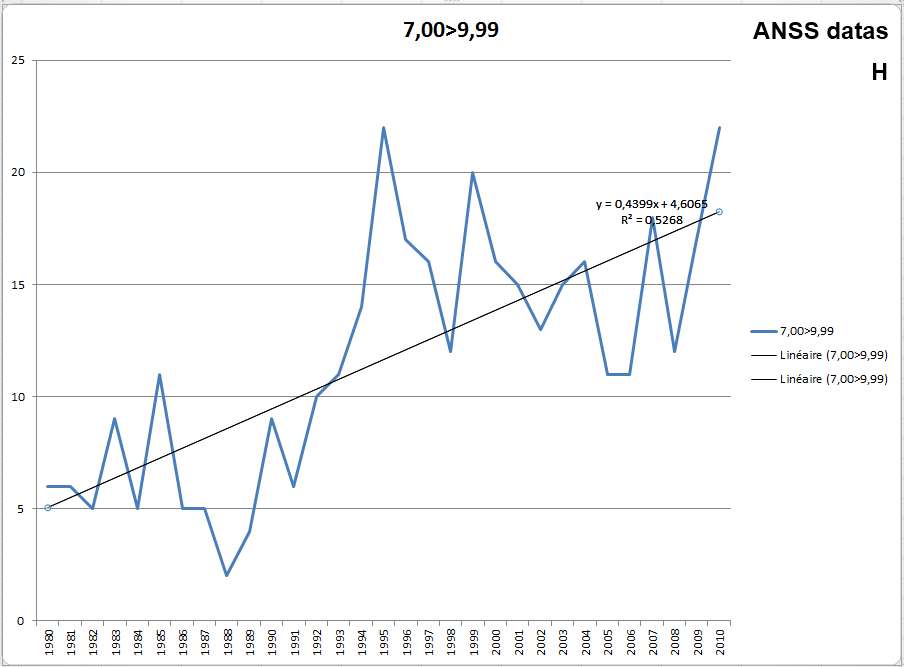
If we start the stats in 1980 using ANNS datas, we obtain this graph ("H") that speaks for itself:
If we start the stats in 1990 using ANSS datas, the graph (see above) "F", we have an increase of 16.5%
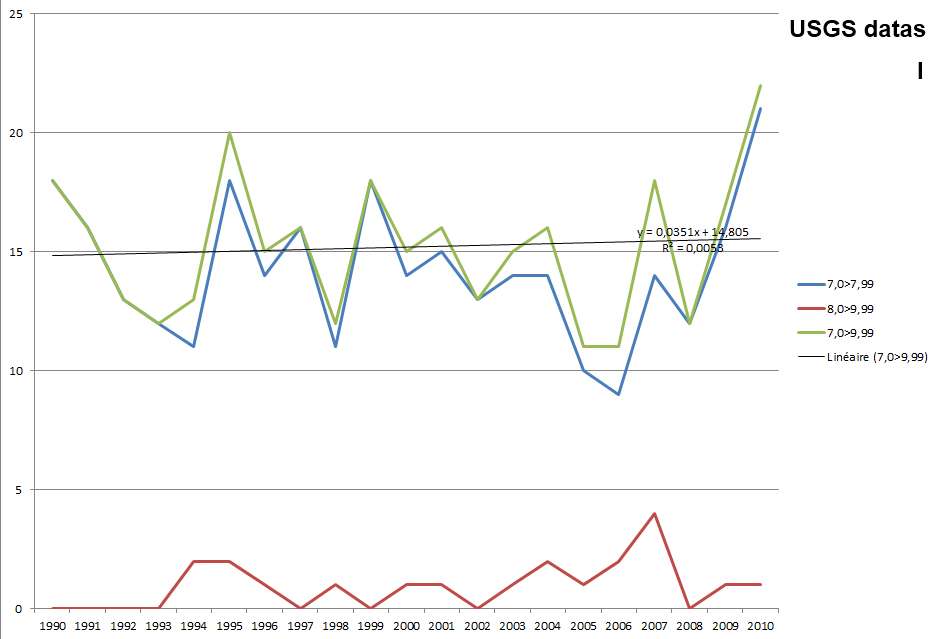
If we start the stats in 1990 using USGS datas, here are the results (+5%): (graph "I")
On a side note, and as of today, for the increasing curve of the total sum of the worl-wide earthquakes since 1990 to come back to zero, one need to have only three more earthquakes 7.0+ before
the end of the 2011 year (for a total of 12, which is a very "poor" year) and the same for 2012.
CONCLUSION for (1) and (2):
Whatever the circumstances and the data used, the increase in the number of earthquakes above 7.0 is significant and can not be due to the lack of detection means.
This is absolutely not what we can read on USGS presentations pages. Why?
(3) In spite of all my research, I wasn't able to find anywhere historics datas about the world-wide sismographs numbers and position. Knowing these datas could have made my work
easier, especially for the determination of the detection capacities through the decades. Any valuable information will be appreciated!
(4) One of the many examples of discrepancies between various USGS datas. One source said that there are actually more than 4.000 stations all around the world, and another said that
there are more than 8.000...
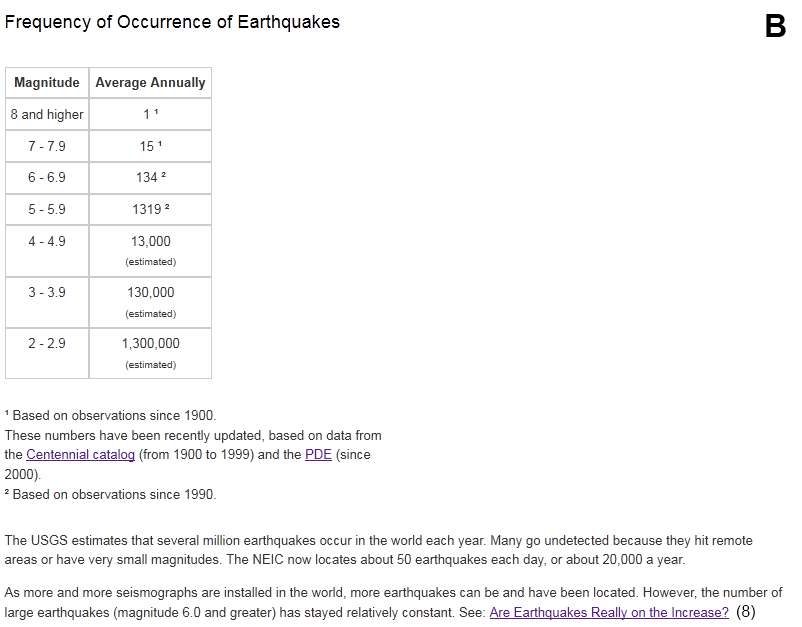
(5) "According to long-term records (since about 1900), we expect about 17 [source 1] (or 18 [source 2)] major earthquakes (7.0 - 7.9) and one great earthquake (8.0 or above)
in any given year"
USGS do not explain how these numbers have been determined and a simple mean of all the earthquakes that occured since 1900 gives very different results (graph "J"):
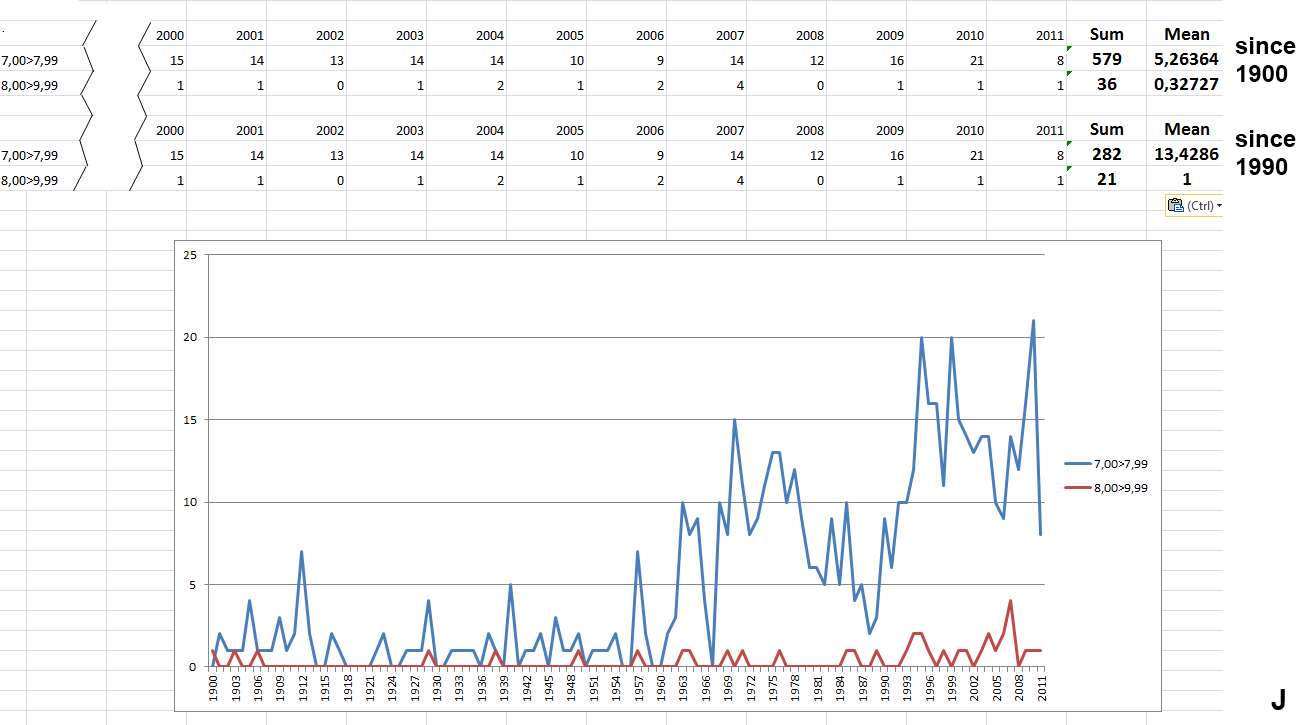
Note that in order to have one great earthquake occurrence in any given year, one have to begin the stats in 1990, however that also gives 13.4 occurrence for major earthquakes (7.0>7.99),
which is far below "about 17 (or 18)".
(6) "However, let's take a look at what has happened in the past 32 years, from 1969 through 2001, so far. Our records show that 1992, and 1995-1997 were the only years that we
have reached or exceeded the long-term average number of major earthquakes since 1971. In 1970 and in 1971 we had 20 and 19 major earthquakes, respectively, but in other
years the total was in many cases well below the 18 per year which we may expect based on the long-term average."
- ANSS worl-wide datas shows respectively 15 and 11 major earthquakes for 1970 and 1971, not 20 and 19. Knowing that ANSS datas are, for the most part, built on USGS datas (see "sources"),
why the discrepancies?
- USGS do not explain why it takes 1971 as the beginning of the calculation of the long-term average number of major earthquakes, and also do not explain why it ends in 2001.
- Anyway, using either USGS or ANSS datas, and according to my notes point (5) above, using the average number I've found since 1900 (5.26), most of the recent years shows more
major earthquakes occurrence. And using the average number since 1990 (13.42), there are 11 years between 1990 and 2010 with more major earthquakes.
CONCLUSION for (3) to (6):
USGS and ANSS datas are often inaccurates or incomplete and contradict themselves, at least for what we can see in the public pages.
There's no explanations on how the average number for major earthquakes occurrence have been found and (using USGS and ANSS datas alone) I wasn't able to find these numbers.
However, we will see in note (8) that the use of different catalogs (Centennial and PDE) by USGS could explain these long-term average numbers
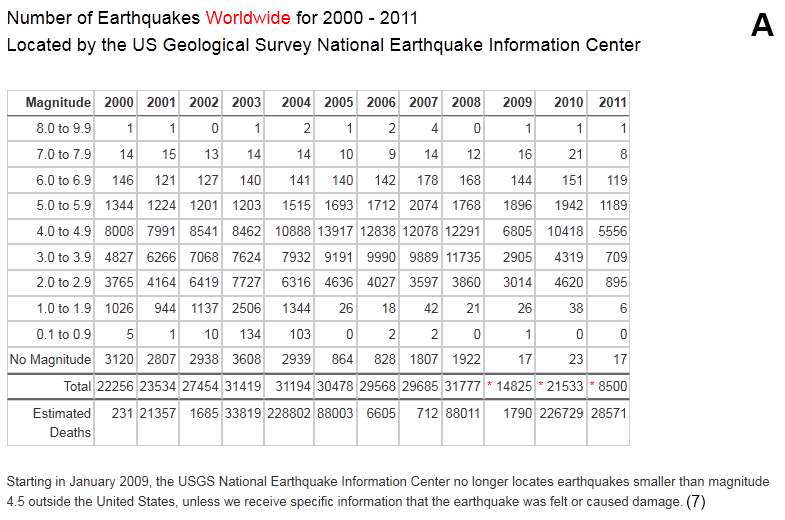
(7) Let's take a look at the chart below, and especially at the bottom page note:

Now is this modification can be clairly seen? Let's see it with the graph "K":
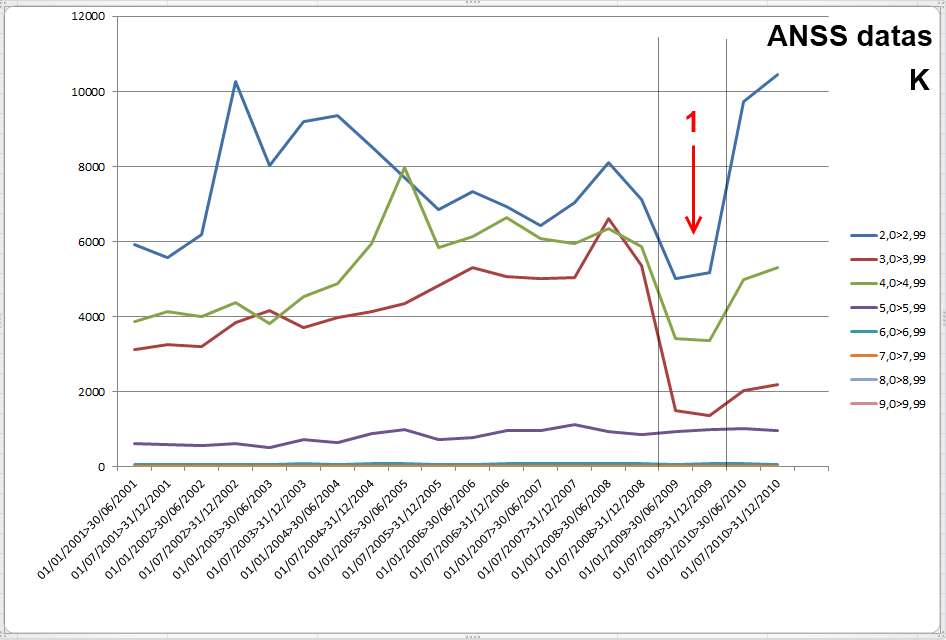
Yes, we can clearly see at point "1" that there are less datas for earthquakes between 2.0 and 4.99, however, very shortly after that (one year) two of the three curves reached
again (and even overtook for the earthquakes between 2.0 and 2.99) their levels before the modifications. Is it due to seismograph improvement solely?
Here, again, no explanations from USGS so far...
(8) The use of both Centennial (presentation here and datas here)
and PDE (presentation here) catalogs.
Work still in progress
(9) Here are USGS datas between 1980 and 2011 taken from this page and exposed in the graph "C",
that clearly show an increase for the earthquakes greater than 6.0 (and the 2011 year is not over yet).
(10) [...]Beginning in the 1980s, events at the higher magnitude levels begin to show some stability. For example, here are year-by-year histograms for the 1980s and 1990s, showing the variations in numbers of events of magnitude 4 and higher. While the number of magnitude 4.0-4.9 events gradually evolves, the number of magnitude 5 and higher events has remained relatively stable on the year to year basis.[...]
To check this affirmation, I used ANSS datas for the USA (without the 2011 year) and applied a lineary curve trend to earthquakes >5.00:
Work still in progress
I particularly wanted to find out about the history of seismology and determine whether there were reliable and verifiable statistical datas.
So, I noticed that among the various websites and specialized forums addressing the issue, one of the most a recurring question is: "Has earthquake activity been increasing?"
Then, searching in USGS website if there's some informations, here's what I've found: (comments and notes are on the bottom page)
USGS datas
1- Are Earthquakes Really on the Increase?
"We continue to be asked by many people throughout the world if earthquakes are on the increase. Although it may seem that we are having more earthquakes, earthquakes
of magnitude 7.0 or greater have remained fairly constant throughout this century (1) and, according to our records, have actually seemed to decrease in recent years.(2)
A partial explanation may lie in the fact that in the last twenty years, we have definitely had an increase in the number of earthquakes we have been able to locate each year.
This is because of the tremendous increase in the number of seismograph stations in the world (3) and the many improvements in global communications.
In 1931, there were about 350 stations operating in the world; today, there are more than 8.000 stations [source 1] (or 4.000 stations [source 2]) (4) and the data now comes
in rapidly from these stations by electronic mail, internet and satellite.
This increase in the number of stations and the more timely receipt of data has allowed us and other seismological centers to locate earthquakes more rapidly and to locate
many small earthquakes which were undetected in earlier years.
The NEIC now locates about 20,000 earthquakes each year or approximately 50 per day. Also, because of the improvements in communications and the increased interest in the
environment and natural disasters, the public now learns about more earthquakes.
According to long-term records (since about 1900), we expect about 17 [source 1] (or 18 [source 2)] (5) major earthquakes (7.0 - 7.9) and one great earthquake (8.0 or above)
in any given year."
However, let's take a look at what has happened in the past 32 years, from 1969 through 2001, so far. Our records show that 1992, and 1995-1997 were the only years that we
have reached or exceeded the long-term average number of major earthquakes since 1971. In 1970 and in 1971 we had 20 and 19 major earthquakes, respectively, but in other
years the total was in many cases well below the 18 per year which we may expect based on the long-term average.(6)
source 1
source 2
2- Earthquake Facts and Statistics
source
3- Earthquake Facts and Statistics Graphs
I won't reproduce all the graphs that can be seen here, anyway, and in order to better understand in
one glance statistical issues, I've done a compiled graph "C":
ANSS datas
While most of the people knows USGS, ANSS (Advanced National Seismic System), which first 80 ANSS strong motion instruments were installed in San Francisco (40), Salt Lake City (20)
and Seattle (20) in 2000, is widely unknown from general public; however this organization also produce lots of datas, maps and lists compiled in catalogs for seismologists and
earthquake engineers, for teachers and the general public as well.
source
Mission:
The mission of ANSS is to provide accurate and timely data and information products for seismic events, including their effects on buildings and structures, employing modern
monitoring methods and technologies.
1- ANSS Catalog Caveats (USA)
Full presentation here
Extract:
[...]Beginning in the 1980s, events at the higher magnitude levels begin to show some stability. For example, here are year-by-year histograms for the 1980s and 1990s,
showing the variations in numbers of events of magnitude 4 and higher. While the number of magnitude 4.0-4.9 events gradually evolves, the number of magnitude 5 and higher
events has remained relatively stable on the year to year basis.(10)[...]
2- ANSS Composite Earthquake Catalog
The ANSS (Advanced National Seismic System) composite catalog is a world-wide earthquake catalog that is created by merging the master earthquake catalogs from contributing
ANSS institutions and then removing duplicate solutions for the same event. The ANSS earthquake catalog grew out of the efforts of the CNSS (Council of the National Seismic
System). It was previously called the CNSS earthquake catalog.
This worldwide catalog serves as a basis for my statistical study about earthquakes possible increasing, see footnotes below.
source
------------------------------------------------------------------------------------------------------------------------------------------------------ -----------------------
Footnotes
(1) "earthquakes of magnitude 7.0 or greater have remained fairly constant throughout this century"
The graph "C" (see above), shows for the USGS datas between 1980 and 2011 an average increasing of the 7.0>7.99EQ of 7% (R2). Earthquakes above 8.0 have been neglected, since the
numbers of events is not enough significally.
Using ANSS datas from 1900 to 2011 give these graphs "D" and "E":
The graph "D" shows for the ANSS datas between 1900 and 2011 an average increasing of the 7.0+EQ of almost 60%. We could logically saying that it is probably mainly due to the
lack of sismograph at the beginning of the century, especially in inhabited areas; however, the globally and internationally detected earthquakes with a magnitude greater than 7.0
may suggest that these large earthquakes were all detected relatively quickly during this century.
Even if we limit the data, beginning from the 90s, we still can see an increase, albeit smaller (7%), but still present nonetheless:
If we don't take account of the year 2011, the increase is even more important (16.5%), see graph "F":
(2) "earthquakes of magnitude 7.0 or greater [...] have actually seemed to decrease in recent years"
In fact, it depends what exactly means "recent years"....Firstly, let's not taking account of the 2011 datas, since the year is not complete yet.
If we start the stats before 1980, both USGS and ANSS datas show exactly the opposite, but, as I said above, this could be due to the lack of seismograph to cover the whole globe.
If we start the stats in 1980 using USGS datas, the percentage of earthquakes increase above 7.0 is of 20%, see graph "G":
If we start the stats in 1980 using ANNS datas, we obtain this graph ("H") that speaks for itself:
If we start the stats in 1990 using ANSS datas, the graph (see above) "F", we have an increase of 16.5%
If we start the stats in 1990 using USGS datas, here are the results (+5%): (graph "I")
On a side note, and as of today, for the increasing curve of the total sum of the worl-wide earthquakes since 1990 to come back to zero, one need to have only three more earthquakes 7.0+ before
the end of the 2011 year (for a total of 12, which is a very "poor" year) and the same for 2012.
CONCLUSION for (1) and (2):
Whatever the circumstances and the data used, the increase in the number of earthquakes above 7.0 is significant and can not be due to the lack of detection means.
This is absolutely not what we can read on USGS presentations pages. Why?
(3) In spite of all my research, I wasn't able to find anywhere historics datas about the world-wide sismographs numbers and position. Knowing these datas could have made my work
easier, especially for the determination of the detection capacities through the decades. Any valuable information will be appreciated!
(4) One of the many examples of discrepancies between various USGS datas. One source said that there are actually more than 4.000 stations all around the world, and another said that
there are more than 8.000...
(5) "According to long-term records (since about 1900), we expect about 17 [source 1] (or 18 [source 2)] major earthquakes (7.0 - 7.9) and one great earthquake (8.0 or above)
in any given year"
USGS do not explain how these numbers have been determined and a simple mean of all the earthquakes that occured since 1900 gives very different results (graph "J"):
Note that in order to have one great earthquake occurrence in any given year, one have to begin the stats in 1990, however that also gives 13.4 occurrence for major earthquakes (7.0>7.99),
which is far below "about 17 (or 18)".
(6) "However, let's take a look at what has happened in the past 32 years, from 1969 through 2001, so far. Our records show that 1992, and 1995-1997 were the only years that we
have reached or exceeded the long-term average number of major earthquakes since 1971. In 1970 and in 1971 we had 20 and 19 major earthquakes, respectively, but in other
years the total was in many cases well below the 18 per year which we may expect based on the long-term average."
- ANSS worl-wide datas shows respectively 15 and 11 major earthquakes for 1970 and 1971, not 20 and 19. Knowing that ANSS datas are, for the most part, built on USGS datas (see "sources"),
why the discrepancies?
- USGS do not explain why it takes 1971 as the beginning of the calculation of the long-term average number of major earthquakes, and also do not explain why it ends in 2001.
- Anyway, using either USGS or ANSS datas, and according to my notes point (5) above, using the average number I've found since 1900 (5.26), most of the recent years shows more
major earthquakes occurrence. And using the average number since 1990 (13.42), there are 11 years between 1990 and 2010 with more major earthquakes.
CONCLUSION for (3) to (6):
USGS and ANSS datas are often inaccurates or incomplete and contradict themselves, at least for what we can see in the public pages.
There's no explanations on how the average number for major earthquakes occurrence have been found and (using USGS and ANSS datas alone) I wasn't able to find these numbers.
However, we will see in note (8) that the use of different catalogs (Centennial and PDE) by USGS could explain these long-term average numbers
(7) Let's take a look at the chart below, and especially at the bottom page note:
Now is this modification can be clairly seen? Let's see it with the graph "K":
Yes, we can clearly see at point "1" that there are less datas for earthquakes between 2.0 and 4.99, however, very shortly after that (one year) two of the three curves reached
again (and even overtook for the earthquakes between 2.0 and 2.99) their levels before the modifications. Is it due to seismograph improvement solely?
Here, again, no explanations from USGS so far...
(8) The use of both Centennial (presentation here and datas here)
and PDE (presentation here) catalogs.
Work still in progress
(9) Here are USGS datas between 1980 and 2011 taken from this page and exposed in the graph "C",
that clearly show an increase for the earthquakes greater than 6.0 (and the 2011 year is not over yet).
(10) [...]Beginning in the 1980s, events at the higher magnitude levels begin to show some stability. For example, here are year-by-year histograms for the 1980s and 1990s, showing the variations in numbers of events of magnitude 4 and higher. While the number of magnitude 4.0-4.9 events gradually evolves, the number of magnitude 5 and higher events has remained relatively stable on the year to year basis.[...]
To check this affirmation, I used ANSS datas for the USA (without the 2011 year) and applied a lineary curve trend to earthquakes >5.00:
Work still in progress
edit on 22-5-2011 by elevenaugust because: (no reason given)
edit on 22-5-2011 by elevenaugust
because: (no reason given)
I already saw most of that data from various sources but good work anyway!
S&F
My personal opinion is that earthquakes are on the increase but not as much as many people think here on this site.
S&F
My personal opinion is that earthquakes are on the increase but not as much as many people think here on this site.
How dare you post actual data on ATS! Star and flag for excellent research. Incidentally, seismic research is a new field, so we only have a
century's worth of data. A hundred years is nothing, geologically speaking. The data we have may or may not be "typical" in the grand scheme of
things. The hysteria that keeps cropping up here is based on people's subjective impression; they don't remember hearing about many earthquakes back
when they were growing up in the 1960s or 70s, and now they hear about them every day. This is because cable TV and the internet did not exist thirty
or forty years ago.
reply to post by elevenaugust
Very interesting exploratory data analysis, but I have two concerns/questions about your conclusions:
1. You've created linear best-fit lines for your data. What's the basis for you modeling this phenomenon of increased seismic activity as being linear? Especially when...
2. The R^2 values for your trend lines are, to put it lightly, atrocious. If they're not in the neighborhood of 0.8 or greater, it's extremely hard to draw any kind of conclusion. Most of yours aren't even above 0.5, and you have two that are below 0.1. It's more likely that 2010 is at the upper end of the distribution of seismic activity and that's skewing your numbers, especially since linear regression tends to weight points toward the ends of the data sets. Run a standard deviation on each of the magnitude groups presented in the raw data for the last 10 years and tell me how many of those points fall outside of even one standard deviation, keeping in mind that 2-3 standard deviations is more normal depending on your confidence limit.
I believe this balogna. While it may be true, I feel they left out key things.
Its nice to not see fear mongering, but what about the intensity of these earthquakes?
Surely the fukishima earthquake was larger than anything we've seen in a loooooong time. It was not only extremely intense, but long duration.
What about WHERE the earthquakes are occuring geographically? There might be the same amount occuring, but are they now appearing in more dangerous areas than before? What about the heavily increased volcanic activity?
What about the dying crops, and the chemical food engineering of whats left of them?
The list could go on. While I don't wish to scare people, I get very frustrated seeing this new, 'Weather Channel, everything is A-OK, extreme weather desensitization' attitude. We don't have to run to the hills crying, but we can't just blantantly lie to ourselves, and everyone else. The earth, as a whole, is going through some serious changes. We should grow up, control ourselves, and work together to do whatever would be most effective to help ourselves.
A lot of excellent information.. I do think earthquakes are mostly cyclical events .. areas tend to get major earthquakes on a cycle that is somewhat
predictable, not to the day.. month or even year .. but vaguely predictable.. ( Every 20 years or so for example ) ..
This perception of the frequency going up ( and it might be to a degree as the data shows ) ... has a lot to do with how times have changed.. we kind of talked about this where I work in one of our meetings, off topic discussion there but one of our older employees talked about how when he was a kid.. news was whatever was on television, we were given news that the networks thought mattered, and that was almost always local to wherever you were... you didn't hear about the warring in the middle east that's been going on for centuries very often, you didn't hear about earthquakes in another country very often.. but that's very much because of how news was available.. When the internet became popular we could suddenly see the world.. news and information is now everywhere and you can be overloaded with it actually.. but this allows us now to see constantly what is going on around the world .. it creates, I think, a false impression that things have suddenly gotten way worse.. we didn't know how bad it's already been
Earthquakes and natural disasters are similar.. Japan gets major earthquakes .. but I believe they are on around a 20 year cycle for something like that which means a lot of us were kids, or not even born which makes it hard to have proper perspective
edit on 22-5-2011 by miniatus because:
(no reason given)
reply to post by elevenaugust
S & F for the analytical work you put into this subject; one that is on a lot of minds as of late.
2nd
S & F for the analytical work you put into this subject; one that is on a lot of minds as of late.
2nd
reply to post by elevenaugust
Presumably as you point out, the apparent increase is due to better equipment.
Is Extreme Weather the New Normal?
www.reuters.com...
Major Population Centers May Be At Risk From Earthquakes; Building Codes Must Reflect New Seismic Data
www.sciencedaily.com...
Cost Of Natural Disasters $109 Billion In 2010: U.N
planetark.org...
Presumably as you point out, the apparent increase is due to better equipment.
Is Extreme Weather the New Normal?
www.reuters.com...
Heavy rains, deep snowfalls, monster floods and killing droughts are signs of a "new normal" of extreme U.S. weather events fueled by climate change, scientists and government planners said on Wednesday.
Major Population Centers May Be At Risk From Earthquakes; Building Codes Must Reflect New Seismic Data
www.sciencedaily.com...
The authors noted an apparent increase in seismic activity due to better seismological instrumentation to record earthquakes.
Cost Of Natural Disasters $109 Billion In 2010: U.N
planetark.org...
"With more extreme weather events, and more earthquakes in urban areas, the state of repair or disrepair in urban areas is really critical," she said.
edit on 22-5-2011 by newcovenant because: (no reason given)
Originally posted by elevenaugust
(8) The use of both Centennial (presentation here and datas here)
and PDE (presentation here) catalogs....
I used Centennial catalog for the years between 1900 and 2006, and here are the results:

NOTES:
- For the 7.0>7.99 earthquakes, there's a slight decrease, (+/-7%) for the given period. This is compatible with what USGS said: "earthquakes of magnitude 7.0 or greater have remained fairly constant throughout this century (see 1 precedent post) but is still questionnable for the "recent years": and, according to our records, have actually seemed to decrease in recent years."(see 2 precedent post)
- Then, ANSS datas are either incomplete or inaccurate. One can wonder the utility of such a world-wide catalog if it can't be used as a basis in any research!
- This sentence: "As more and more seismographs are installed in the world, more earthquakes can be and have been located. However, the number of large earthquakes (magnitude 6.0 and greater) has stayed relatively constant" is not completely true, as 6.0>6.99 EQ curves on the graph above shows a very important increasing, probably due to the evolution of the seismograph implantation around the world.
- PDE catalog (used by USGS for their statistics since 2000) is only avalaible until the end of the 2009 year, I'm still working on it, but there's no more annual report, only monthly, so it will take a while before I'll be able to update the graph.
---------------------------------------------------------------------------------------------------------------------------------------------------
Originally posted by elevenaugust
(10) [...]Beginning in the 1980s, events at the higher magnitude levels begin to show some stability. For example, here are year-by-year histograms for the 1980s and 1990s, showing the variations in numbers of events of magnitude 4 and higher. While the number of magnitude 4.0-4.9 events gradually evolves, the number of magnitude 5 and higher events has remained relatively stable on the year to year basis.[...]
To check this affirmation, I used ANSS datas for the USA (without the 2011 year) and applied a lineary curve trend to earthquakes >5.00
Work still in progress
new topics
-
When an Angel gets his or her wings
Conspiracies in Religions: 23 minutes ago -
Comparing the theology of Paul and Hebrews
Religion, Faith, And Theology: 1 hours ago -
Pentagon acknowledges secret UFO project, the Kona Blue program | Vargas Reports
Aliens and UFOs: 2 hours ago -
Boston Dynamics say Farewell to Atlas
Science & Technology: 2 hours ago -
I hate dreaming
Rant: 2 hours ago -
Man sets himself on fire outside Donald Trump trial
Mainstream News: 4 hours ago -
Biden says little kids flip him the bird all the time.
2024 Elections: 5 hours ago -
The Democrats Take Control the House - Look what happened while you were sleeping
US Political Madness: 5 hours ago -
Sheetz facing racial discrimination lawsuit for considering criminal history in hiring
Social Issues and Civil Unrest: 5 hours ago -
In an Historic First, In N Out Burger Permanently Closes a Location
Mainstream News: 7 hours ago
top topics
-
In an Historic First, In N Out Burger Permanently Closes a Location
Mainstream News: 7 hours ago, 14 flags -
The Democrats Take Control the House - Look what happened while you were sleeping
US Political Madness: 5 hours ago, 13 flags -
A man of the people
Medical Issues & Conspiracies: 12 hours ago, 8 flags -
Biden says little kids flip him the bird all the time.
2024 Elections: 5 hours ago, 8 flags -
Man sets himself on fire outside Donald Trump trial
Mainstream News: 4 hours ago, 7 flags -
Pentagon acknowledges secret UFO project, the Kona Blue program | Vargas Reports
Aliens and UFOs: 2 hours ago, 4 flags -
4 plans of US elites to defeat Russia
New World Order: 14 hours ago, 4 flags -
Sheetz facing racial discrimination lawsuit for considering criminal history in hiring
Social Issues and Civil Unrest: 5 hours ago, 3 flags -
Are you ready for the return of Jesus Christ? Have you been cleansed by His blood?
Religion, Faith, And Theology: 10 hours ago, 3 flags -
MH370 Again....
Disaster Conspiracies: 8 hours ago, 2 flags
active topics
-
Election Year 2024 - Interesting Election-Related Tidbits as They Happen.
2024 Elections • 67 • : WeMustCare -
The Democrats Take Control the House - Look what happened while you were sleeping
US Political Madness • 53 • : Mahogani -
Candidate TRUMP Now Has Crazy Judge JUAN MERCHAN After Him - The Stormy Daniels Hush-Money Case.
Political Conspiracies • 401 • : WeMustCare -
So I saw about 30 UFOs in formation last night.
Aliens and UFOs • 36 • : Arbitrageur -
Thousands Of Young Ukrainian Men Trying To Flee The Country To Avoid Conscription And The War
Other Current Events • 48 • : Consvoli -
12 jurors selected in Trump criminal trial
US Political Madness • 110 • : DontTreadOnMe -
A man of the people
Medical Issues & Conspiracies • 10 • : Astrocometus -
When an Angel gets his or her wings
Conspiracies in Religions • 0 • : BrotherKinsMan -
-@TH3WH17ERABB17- -Q- ---TIME TO SHOW THE WORLD--- -Part- --44--
Dissecting Disinformation • 545 • : cherokeetroy -
Man sets himself on fire outside Donald Trump trial
Mainstream News • 31 • : watchitburn
34