It looks like you're using an Ad Blocker.
Please white-list or disable AboveTopSecret.com in your ad-blocking tool.
Thank you.
Some features of ATS will be disabled while you continue to use an ad-blocker.

Geiger Counter readings - Updated: Radioactive fallout wave travelling across U.S?
page: 5share:
reply to post by muzzleflash
The jet stream is at 30,000+ feet over Japan. Very little, if any, material is carried that high. Even less would settle back to the surface at any particular location. The minute amount of material which has been detected on the west coast would have been carried by lower level winds.
A surface high pressure area developing to the northeast of Japan or a low pressure area to the northwest would create easterly low level winds which would carry fallout to the west. It is that which poses a danger, not the jet stream.
edit on 3/20/2011 by Phage because: (no reason
given)
Oh, and I almost left out...
Omaha, NE - Beta Gross 40 CPM at 9:20pm (my time)
Omaha, NE - Beta Gross 74 CPM at 5:25am (my time)
I'm not suggesting there is cause for alarm, I'm just thinking there might be something to the theory of radiation traveling all the way over here. I haven't noticed any other substantial changes, but I'll keep watching...
I got a lot of screenshots, maybe I can post them later when I get up.
But the places we were watching earlier that were really high, have been falling back down rapidly.
And the places due East of those locations, are slowly getting exposed as the "wave" apparently hits them, and are starting to raise above 100.
After seeing this progress for over 8hours + of watching closely over a dozen sites, I now see there is a direct correlative pattern forming.
This is the fallout cloud. I am pretty damn convinced at this point. It really is happening right now.
It is over the Dakotas, Nebraska, Kansas, and in *theory* Oklahoma but no available readings from Oklahoma currently.
You can claim all your denial you want, but you cannot explain this away so easily. There is like 100 of these meters nation wide. COINCIDENTALLY the only ones showing readings are forming a North to South wave-line that is crossing the US from West to East. It is really slow, like maybe 15-30mph tops.
I am confident that we can say this fallout wave is real, it is detectable RIGHT NOW, and the theory will almost certainly hold up to scrutiny and the meters further east will go up when the ones that are high now will decrease. It's a repeating pattern, and estimates based on it are proving accurate. You can predict the next city that will have high readings because it's due East of the hot spot.
You can claim whatever you want, but I am thanking the EPA.GOV for giving me updated information to watch this thing hit my country. And I will be seeking shelter, taking good showers, etc when this thing gets near my location tomorrow. I need to take precautions because I am directly in the fallout pathway.
If you don't believe this, watch the EPA readings and check all the sites, and watch it change exactly as predicted. It worked for me over the last 8-10hour period.
If you don't want to watch the evidence before your eyes, don't.
I am posting this information for any Americans/Canadians who want to watch this thing pass through their neighborhoods. Keep yourself informed, because the MSM is IGNORING this 100%.
I should also add that Wichita has stayed about the same all night, while the numbers to the north went up. This is kinda oddly consistent with the
jetstream diagram posted above.
Wichita, KS
Beta Gross 64 CPM at 9:18pm (my time)
Beta Gross 62 CPM at 3:40am (my time)
Beta Gross 63 CPM at 6:42am (my time)
Wichita, KS
Beta Gross 64 CPM at 9:18pm (my time)
Beta Gross 62 CPM at 3:40am (my time)
Beta Gross 63 CPM at 6:42am (my time)
This woman has very interesting information on geiger counters and readings they give. Also, she touches on the potassium iodide topic a little.
Yeah, this is very alarming data. Muzz, I'd like to see your final results.
Originally posted by Phage
reply to post by muzzleflash
The jet stream is at 30,000+ feet over Japan. Very little, if any, material is carried that high. Even less would settle back to the surface at any particular location. The minute amount of material which has been detected on the west coast would have been carried by lower level winds.
A superheated column of air will rise to the jet stream, IF these reactors meltdown, or lose any cooling for a long period of time.
If (very unlikely) there is a complete meltdown, literally tons of radioactive particulates could reach the jet stream.
In WWII the Japanese released balloons from Japan after studying the Jet stream, with the intent to start fires in the west coast USA using incendiary devices attached to these balloons... It took only 2 days for them to reach Oregon from Japan.
As long as things are stable, and cooling is maintained at these damaged reactors, then we have nothing to worry about in the western USA.
To assume that the worst can't happen, is completely foolish, and ignorant.
Phage, could you also answer this question:
And also respond to FF's comment about how super heated air will travel into the jet stream:
Originally posted by Phage
I'm far more concerned about Japan, Korea, and China than I am about North America or elsewhere in this crisis.
Originally posted by muzzleflash
Why? Isn't the Jet stream carrying the largest amounts of the fallout cloud over the pacific ocean directly towards North America and then onwards to Europe? Appears that's the case.
Now I do expect the wind to shift south of Fukushima soon, directly towards Tokyo, but it will still bend out towards the pacific yet again.
I don't even think the wind can go towards China from Fukushima. If so, I will admit ignorance on the subject but I am almost pretty sure the wind does not go that direction. (Jet Streams)
Yeah I checked again to make sure.
www.wunderground.com...
How could you have missed this Phage? There's no way China or Korea are down wind from this thing.
And also respond to FF's comment about how super heated air will travel into the jet stream:
Originally posted by Fractured.Facade
Originally posted by Phage
reply to post by muzzleflash
The jet stream is at 30,000+ feet over Japan. Very little, if any, material is carried that high. Even less would settle back to the surface at any particular location. The minute amount of material which has been detected on the west coast would have been carried by lower level winds.
A superheated column of air will rise to the jet stream, IF these reactors meltdown, or lose any cooling for a long period of time.
If (very unlikely) there is a complete meltdown, literally tons of radioactive particulates could reach the jet stream.
In WWII the Japanese released balloons from Japan after studying the Jet stream, with the intent to start fires in the west coast USA using incendiary devices attached to these balloons... It took only 2 days for them to reach Oregon from Japan.
As long as things are stable, and cooling is maintained at these damaged reactors, then we have nothing to worry about in the western USA.
To assume that the worst can't happen, is completely foolish, and ignorant.
edit on 20-3-2011 by v1rtu0s0 because: (no reason given)
reply to post by muzzleflash
I'm 100% with you on this Muzzle...I disagreed with you on an earlier post on another thread...I take it back. My foot is in my mouth.....
I'm 100% with you on this Muzzle...I disagreed with you on an earlier post on another thread...I take it back. My foot is in my mouth.....
Woke up to some high readings again.
224 Tuscon!
101 Alberquerque!
153 SD Pierre!
109 San Angelo!
Even Spokane was over 80 but its dropping now, near Canada.
AZ: TUCSON
Map data ©2011 Europa Technologies, INEGI - Terms of Use
Map
Satellite
Hybrid
1000 mi
1000 km
Monitor Information:
Fixed Monitor Location: AZ: TUCSON
Measurement Start Date/Time: 03/20/2011 12:08:09 PM
Measurement End Date/Time: 03/20/2011 01:08:17 PM
Beta Gross Count Rate (CPM): 224
Gamma Energy Range 2 Gross(CPM): 4329
Gamma Energy Range 3 Gross(CPM): 2641
Gamma Energy Range 4 Gross(CPM): 675
Gamma Energy Range 5 Gross(CPM): 369
Gamma Energy Range 6 Gross(CPM): 197
Gamma Energy Range 7 Gross(CPM): 288
Gamma Energy Range 8 Gross(CPM): 108
Gamma Energy Range 9 Gross(CPM): 51
Gamma Energy Range 10 Gross(CPM): 51
224 Tuscon!
Fixed Monitor Location: NM: ALBUQUERQUE
Measurement Start Date/Time: 03/20/2011 12:51:22 PM
Measurement End Date/Time: 03/20/2011 01:51:30 PM
Beta Gross Count Rate (CPM): 101
Gamma Energy Range 2 Gross(CPM): 3352
Gamma Energy Range 3 Gross(CPM): 2008
Gamma Energy Range 4 Gross(CPM): 587
Gamma Energy Range 5 Gross(CPM): 318
Gamma Energy Range 6 Gross(CPM): 197
Gamma Energy Range 7 Gross(CPM): 234
Gamma Energy Range 8 Gross(CPM): 142
Gamma Energy Range 9 Gross(CPM): 58
Gamma Energy Range 10 Gross(CPM): 70
101 Alberquerque!
Fixed Monitor Location: SD: PIERRE
Measurement Start Date/Time: 03/20/2011 12:33:02 PM
Measurement End Date/Time: 03/20/2011 01:33:09 PM
Beta Gross Count Rate (CPM): 153
Gamma Energy Range 2 Gross(CPM): 2874
Gamma Energy Range 3 Gross(CPM): 1750
Gamma Energy Range 4 Gross(CPM): 444
Gamma Energy Range 5 Gross(CPM): 271
Gamma Energy Range 6 Gross(CPM): 138
Gamma Energy Range 7 Gross(CPM): 164
Gamma Energy Range 8 Gross(CPM): 103
Gamma Energy Range 9 Gross(CPM): 40
Gamma Energy Range 10 Gross(CPM): 45
153 SD Pierre!
Fixed Monitor Location: TX: SAN ANGELO
Measurement Start Date/Time: 03/20/2011 01:03:37 PM
Measurement End Date/Time: 03/20/2011 02:03:44 PM
Beta Gross Count Rate (CPM): 109
Gamma Energy Range 2 Gross(CPM): 1683
Gamma Energy Range 3 Gross(CPM): 1089
Gamma Energy Range 4 Gross(CPM): 315
Gamma Energy Range 5 Gross(CPM): 160
Gamma Energy Range 6 Gross(CPM): 92
Gamma Energy Range 7 Gross(CPM): 107
Gamma Energy Range 8 Gross(CPM): 69
Gamma Energy Range 9 Gross(CPM): 34
Gamma Energy Range 10 Gross(CPM): 47
109 San Angelo!
Fixed Monitor Location: WA: SPOKANE
Measurement Start Date/Time: 03/20/2011 12:42:33 PM
Measurement End Date/Time: 03/20/2011 01:42:41 PM
Beta Gross Count Rate (CPM): 73
Gamma Energy Range 2 Gross(CPM): 3897
Gamma Energy Range 3 Gross(CPM): 2295
Gamma Energy Range 4 Gross(CPM): 695
Gamma Energy Range 5 Gross(CPM): 337
Gamma Energy Range 6 Gross(CPM): 206
Gamma Energy Range 7 Gross(CPM): 228
Gamma Energy Range 8 Gross(CPM): 124
Gamma Energy Range 9 Gross(CPM): 42
Gamma Energy Range 10 Gross(CPM): 53
Even Spokane was over 80 but its dropping now, near Canada.
edit on 20-3-2011 by Unity_99 because: (no reason given)
reply to post by Unity_99
Anyone else having trouble getting the EPS's RadNet Map View to work?
Wanted to check the morning numbers but can't load.
cdxnode64.epa.gov...
Anyone else having trouble getting the EPS's RadNet Map View to work?
Wanted to check the morning numbers but can't load.
cdxnode64.epa.gov...
I'm glad of this forum, where people post so much info. will someone make this simple for me to get my head round? The mox fuel produces alpha
radiation I believe. Is it correct that there are only certain geiger counters that detact alpha? Are all the charts and things taking this into
account?
Sorry if this is a gormless question.
Sorry if this is a gormless question.
That must be the reason the radiation levels have been staying low near us, in Westcoast BC.
reply to post by Absum!
Mine are working. I often refresh the page at the top of my browser. I couldn't get into their beta though. Today the option is missing to do so for me. It can take a few attempts to get it change, and sometimes it lags. I recheck high figures. Thats quite a lot of particles causing that radiation. And its like getting X-rayed many times in an hour. Also their particles drop out into the weather system and water, soil, lifestock, milk, and vegetation.
Mine are working. I often refresh the page at the top of my browser. I couldn't get into their beta though. Today the option is missing to do so for me. It can take a few attempts to get it change, and sometimes it lags. I recheck high figures. Thats quite a lot of particles causing that radiation. And its like getting X-rayed many times in an hour. Also their particles drop out into the weather system and water, soil, lifestock, milk, and vegetation.
edit on 20-3-2011 by Unity_99 because: (no reason given)
Monitor Information:
Fixed Monitor Location: SD: RAPID CITY
Measurement Start Date/Time: 03/20/2011 09:58:27 AM
Measurement End Date/Time: 03/20/2011 10:58:35 AM
Beta Gross Count Rate (CPM): 201
Gamma Energy Range 2 Gross(CPM): 2430
Gamma Energy Range 3 Gross(CPM): 1625
Gamma Energy Range 4 Gross(CPM): 469
Gamma Energy Range 5 Gross(CPM): 253
Gamma Energy Range 6 Gross(CPM): 142
Gamma Energy Range 7 Gross(CPM): 178
Gamma Energy Range 8 Gross(CPM): 99
Gamma Energy Range 9 Gross(CPM): 38
Gamma Energy Range 10 Gross(CPM): 40
I just looked at this thread and where I am is reading currently at about 120 Beta Gross Count Rate. Who knows what the cutoff danger limit is??? What is it normally ??
edit on 20-3-2011 by xxPUSH0Noo because: added something
WHOA ! This cannot be right .. look right now on RadNet !
Fixed Monitor Location: FL: JACKSONVILLE
Measurement Start Date/Time: 03/20/2011 02:03:10 PM
Measurement End Date/Time: 03/20/2011 03:03:18 PM
Beta Gross Count Rate (CPM): 466
Gamma Energy Range 2 Gross(CPM): 1289
Gamma Energy Range 3 Gross(CPM): 799
Gamma Energy Range 4 Gross(CPM): 257
Gamma Energy Range 5 Gross(CPM): 133
Gamma Energy Range 6 Gross(CPM): 82
Gamma Energy Range 7 Gross(CPM): 105
Gamma Energy Range 8 Gross(CPM): 70
Gamma Energy Range 9 Gross(CPM): 36
Gamma Energy Range 10 Gross(CPM): 53
Am I missing something? Please explain to me how this works!
_javascript:icon('')
Monitor Information:
Fixed Monitor Location: NC: RALEIGH
Measurement Start Date/Time: 03/20/2011 02:14:02 PM
Measurement End Date/Time: 03/20/2011 03:14:10 PM
Beta Gross Count Rate (CPM): 221642
Gamma Energy Range 2 Gross(CPM): 4781
Gamma Energy Range 3 Gross(CPM): 2653
Gamma Energy Range 4 Gross(CPM): 740
Gamma Energy Range 5 Gross(CPM): 389
Gamma Energy Range 6 Gross(CPM): 259
Gamma Energy Range 7 Gross(CPM): 286
Gamma Energy Range 8 Gross(CPM): 186
Gamma Energy Range 9 Gross(CPM): 57
Gamma Energy Range 10 Gross(CPM): 72
edit on 20-3-2011 by xxPUSH0Noo because: added
edit on 20-3-2011 by xxPUSH0Noo
because: bold
reply to post by v1rtu0s0
I did answer muzzleflash and so did FF.
There has been no catastrophic breach of the containment vessels. If there is, there is a chance that some material would make it to the jet stream. Such an event is unlikely.
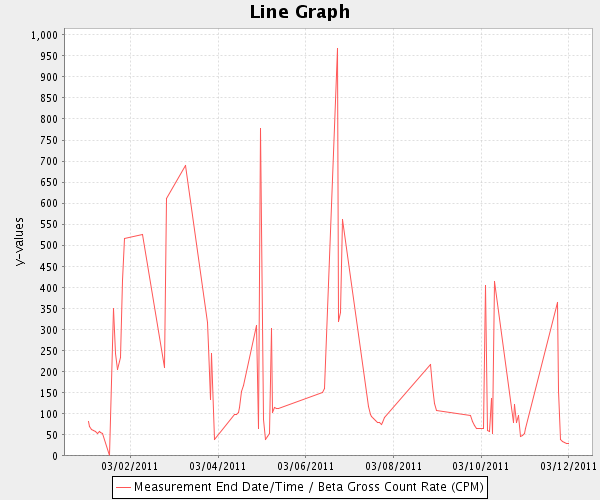
And once again it seems to be necessary to point out that the EPA monitors are showing normal fluctuations in background radiation. They are not showing high levels. They are not recording the effects of fallout. You cannot look at a snapshot and say "ooooh! High levels!". You must look at historical counts.
Here are the counts before the earthquake and tsunami.
Billings, Montana
Tucson, Arizona:
[atsimg]http://files.abovetopsecret.com/images/member/3c96d66be2aa.png[/atsimg]
Rapid City, South Dakota:
[atsimg]http://files.abovetopsecret.com/images/member/6e69271aa3cb.png[/atsimg]
Colorado Springs:
[atsimg]http://files.abovetopsecret.com/images/member/c4c6f41677ba.png[/atsimg]
Just to be sure, Amarillo from 2009:
[atsimg]http://files.abovetopsecret.com/images/member/18f9cd3eede2.png[/atsimg]
Jacksonville, Florida:
[atsimg]http://files.abovetopsecret.com/images/member/9bcdf994f767.png[/atsimg]
Raleigh, NC. Seems to have a calibration problem. Data is only available since March 18th and it's been showing those same high levels since then. So if there's a "wave of fallout" moving across North America it somehow got to North Carolina first.
[atsimg]http://files.abovetopsecret.com/images/member/5bc68caf599d.png[/atsimg]
I did answer muzzleflash and so did FF.
There has been no catastrophic breach of the containment vessels. If there is, there is a chance that some material would make it to the jet stream. Such an event is unlikely.
And once again it seems to be necessary to point out that the EPA monitors are showing normal fluctuations in background radiation. They are not showing high levels. They are not recording the effects of fallout. You cannot look at a snapshot and say "ooooh! High levels!". You must look at historical counts.
Here are the counts before the earthquake and tsunami.
Billings, Montana
Tucson, Arizona:
[atsimg]http://files.abovetopsecret.com/images/member/3c96d66be2aa.png[/atsimg]
Rapid City, South Dakota:
[atsimg]http://files.abovetopsecret.com/images/member/6e69271aa3cb.png[/atsimg]
Colorado Springs:
[atsimg]http://files.abovetopsecret.com/images/member/c4c6f41677ba.png[/atsimg]
Just to be sure, Amarillo from 2009:
[atsimg]http://files.abovetopsecret.com/images/member/18f9cd3eede2.png[/atsimg]
Jacksonville, Florida:
[atsimg]http://files.abovetopsecret.com/images/member/9bcdf994f767.png[/atsimg]
Raleigh, NC. Seems to have a calibration problem. Data is only available since March 18th and it's been showing those same high levels since then. So if there's a "wave of fallout" moving across North America it somehow got to North Carolina first.
[atsimg]http://files.abovetopsecret.com/images/member/5bc68caf599d.png[/atsimg]
edit on 3/20/2011 by Phage because: (no reason given)
There is going to be a lot of disagreement about what mox fuel, that shroom cloud from the beginning, second explosion, and over 11 000 officially
acknowledged spent fuel rods, in a plant that has the potential of hosting over 600 000 with the math being done, in dire circumstances, can do.
We can debate that one enormously.
This thread is simple. Readings. And basically over 100 is a danger sign, officially its around 125, but most they noted on the radiation network and black cat what is normal, and 100 is a big concern.
The readings I'm taking are US Government ones.
So this is actually, for those past believing officials on a grass roots monitoring of the problem they're not discussing.
A problem that yesterday officials said they didn't know how long US levels would stay "safe" by their sunbathe near a nuclear facility according to Anne Coulter's advice, mentality.
There is no need for a skeptic to come on at all. Unless he's putting his own regions stats up and noting other high ones and joining the network of those giving real alerts in an attempt to save real lives from cancer, and sickness, and rather be over - cautious than under. We all value our health, and our childrens/families/neighbors, or should.
new topics
-
Krystalnacht on today's most elite Universities?
Social Issues and Civil Unrest: 1 minutes ago -
Chris Christie Wishes Death Upon Trump and Ramaswamy
Politicians & People: 28 minutes ago -
University of Texas Instantly Shuts Down Anti Israel Protests
Education and Media: 2 hours ago -
Any one suspicious of fever promotions events, major investor Goldman Sachs card only.
The Gray Area: 4 hours ago -
God's Righteousness is Greater than Our Wrath
Religion, Faith, And Theology: 9 hours ago
top topics
-
VP's Secret Service agent brawls with other agents at Andrews
Mainstream News: 13 hours ago, 10 flags -
Cats Used as Live Bait to Train Ferocious Pitbulls in Illegal NYC Dogfighting
Social Issues and Civil Unrest: 17 hours ago, 8 flags -
Nearly 70% Of Americans Want Talks To End War In Ukraine
Political Issues: 14 hours ago, 5 flags -
Sunak spinning the sickness figures
Other Current Events: 14 hours ago, 5 flags -
Electrical tricks for saving money
Education and Media: 12 hours ago, 4 flags -
Late Night with the Devil - a really good unusual modern horror film.
Movies: 16 hours ago, 2 flags -
Any one suspicious of fever promotions events, major investor Goldman Sachs card only.
The Gray Area: 4 hours ago, 2 flags -
University of Texas Instantly Shuts Down Anti Israel Protests
Education and Media: 2 hours ago, 1 flags -
Krystalnacht on today's most elite Universities?
Social Issues and Civil Unrest: 1 minutes ago, 1 flags -
God's Righteousness is Greater than Our Wrath
Religion, Faith, And Theology: 9 hours ago, 0 flags
active topics
-
University of Texas Instantly Shuts Down Anti Israel Protests
Education and Media • 24 • : CriticalStinker -
Krystalnacht on today's most elite Universities?
Social Issues and Civil Unrest • 0 • : TheSingleBillie -
Nearly 70% Of Americans Want Talks To End War In Ukraine
Political Issues • 61 • : YourFaceAgain -
Chris Christie Wishes Death Upon Trump and Ramaswamy
Politicians & People • 3 • : ImagoDei -
Hate makes for strange bedfellows
US Political Madness • 45 • : YourFaceAgain -
Post A Funny (T&C Friendly) Pic Part IV: The LOL awakens!
General Chit Chat • 7134 • : baddmove -
President BIDEN Vows to Make Americans Pay More Federal Taxes in 2025 - Political Suicide.
2024 Elections • 140 • : ImagoDei -
SETI chief says US has no evidence for alien technology. 'And we never have'
Aliens and UFOs • 62 • : Ophiuchus1 -
Sunak spinning the sickness figures
Other Current Events • 17 • : Ohanka -
So this is what Hamas considers 'freedom fighting' ...
War On Terrorism • 261 • : YourFaceAgain