It looks like you're using an Ad Blocker.
Please white-list or disable AboveTopSecret.com in your ad-blocking tool.
Thank you.
Some features of ATS will be disabled while you continue to use an ad-blocker.

Quake Watch 2011
page: 400share:


reply to post by murkraz
removed. apologies - see you have been taken to task already
@muzzy
Not always. There are occasions where the Mw is less than the mb or the same as. Admittedly rare.
The Russians are always high - it's the cheap vodka.
Darn it forgot to say what I came on to say. Has anyone noticed there is no live seismogram data in Bud Explorer for the last 2 days or is it just me?
Here is an example
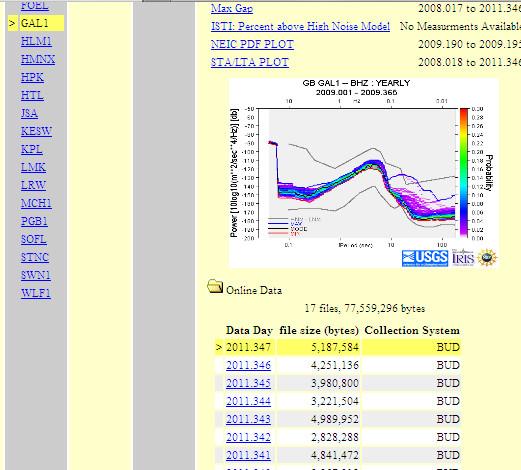
Note that there is data for yesterday (347), but no link to it (not underlined) but no data for today (348). It is the same on every one I have tried.
removed. apologies - see you have been taken to task already
@muzzy
How about 6.9Mw
or maybe not
just checked with the russians they have 7.1mb which theoretically should translate to about 7.4 Ms
Not always. There are occasions where the Mw is less than the mb or the same as. Admittedly rare.
The Russians are always high - it's the cheap vodka.
edit on 14/12/2011 by PuterMan because: (no reason given)
Darn it forgot to say what I came on to say. Has anyone noticed there is no live seismogram data in Bud Explorer for the last 2 days or is it just me?
Here is an example
Note that there is data for yesterday (347), but no link to it (not underlined) but no data for today (348). It is the same on every one I have tried.
edit on 14/12/2011 by PuterMan because: (no reason given)
Winchester, although you have already taken off into the wilderness from where I have just returned - We are always watching!
I wonder when they are going to get around to adding the quakes that have been happening in Yellowstone -slachers!! Source and backup Source yeah and today there is no data available - sure
anyway heres some food for thought
Source
I wonder when they are going to get around to adding the quakes that have been happening in Yellowstone -slachers!! Source and backup Source yeah and today there is no data available - sure
anyway heres some food for thought
Today’s Earthquake Fact
The Wasatch Range, with its outstanding ski areas, runs North-South through Utah, and like all mountain ranges, was produced by a series of earthquakes. The 386 km (240-mile) long Wasatch Fault is made up of several segments, each capable of producing up to a M7.5 earthquake. During the past 6000 years, there has been a M6.5+ about once every 350 years.
Source
reply to post by PuterMan
I'm getting a link to the graph on SNZO and URZ which I have saved on Speed Dial. but no there is nothing for day 348.
Also noticed that both pages had reset themselves to Location 01, Channel LEP, instead of what I saved it as (Location 10, Channel HH1)
Strange.
Just had a look at PMG (Port Moresby, PNG), Day 347 has a link to open the graph but no Day 348, the same as the other 2.
If you open one Station and click on the day (underlined) and it works, then move to another station ( say using the REALTIME Google Earth KMZ file) the day on the other stations won't be underlined but will be highlighted in yellow like in your image.
IRIS Wilber isn't very up to date either
www.iris.edu...
I'm getting a link to the graph on SNZO and URZ which I have saved on Speed Dial. but no there is nothing for day 348.
Also noticed that both pages had reset themselves to Location 01, Channel LEP, instead of what I saved it as (Location 10, Channel HH1)
Strange.
Just had a look at PMG (Port Moresby, PNG), Day 347 has a link to open the graph but no Day 348, the same as the other 2.
If you open one Station and click on the day (underlined) and it works, then move to another station ( say using the REALTIME Google Earth KMZ file) the day on the other stations won't be underlined but will be highlighted in yellow like in your image.
edit on 14-12-2011 by muzzy because: Jeez its humid here 4:45am this morning, must be 100%, and its raining too, too hot to sleep
IRIS Wilber isn't very up to date either
www.iris.edu...
edit on 14-12-2011 by muzzy because: (no reason given)
Originally posted by diamondsmith
a foreshock,
source(www.emsc-csem.org...
TextMagnitude M 4.7 Region PAPUA, INDONESIA Date time 2011-12-04 18:40:24.0 UTC Location 5.45 S ; 140.22 E Depth 41 km Distances 328 km S Jaya pura (pop 134,895 ; local time 03:40:24.6 2011-12-05) 141 km NW Kiunga (pop 11,536 ; local time 04:40:24.6 2011-12-05)
a foreshock?
source(www.emsc-csem.org...
TextMagnitude mb 5.4 Region PAPUA, INDONESIA Date time 2011-12-04 18:53:04.0 UTC Location 5.33 S ; 140.34 E Depth 40 km Distances 313 km S Jaya pura (pop 134,895 ; local time 03:53:04.3 2011-12-05) 138 km NW Kiunga (pop 11,536 ; local time 04:53:04.3 2011-12-05)
main shock?-------------------------------------------------------
Well done, you were on the right track, right island anyway
Now here's a mouthful!
Magnitude M 4.3
Region BOSNIA AND HERZEGOVINA
Date time 2011-12-14 19:47:14.2 UTC
Location 42.93 N ; 17.95 E
Depth 2 km
Distances 47 km S Mostar (pop 104,518 ; local time 20:47:14.2 2011-12-14)
29 km SE Metkovic (pop 13,941 ; local time 20:47:14.2 2011-12-14)
12 km W Ljubinje (pop 4,235 ; local time 20:47:14.2 2011-12-14)
EMSC
Rainbows
Jane
Pooof!!!!!
Did anyone else see the 2.8 in Wyoming today disappear???
Did anyone else see the 2.8 in Wyoming today disappear???
reply to post by muzzy
Yes, I will go along with those two, but not the others hundreds of kilometres away also claimed to be foreshocks.
Day 347 is coming on line now slowly but still nothing for day 348.
Yes, I will go along with those two, but not the others hundreds of kilometres away also claimed to be foreshocks.
Day 347 is coming on line now slowly but still nothing for day 348.
reply to post by wasobservingquietly
I live in rock springs near the area we have above ground coal mines could be there blasting we dont usually have quakes in this area not to say never ...
I live in rock springs near the area we have above ground coal mines could be there blasting we dont usually have quakes in this area not to say never ...
What do you all think of this?
How do you feel about this trend? Starting at 2008 doesn't really give us much room to really compare. It would be better if it was a huge chart going back to the 60s. Does one exist?
Number of Larger Earthquakes Is Rising
Earthquakes pose a significant risk to 75 million Americans in 39 states.—USGS Jan. 2004
December 12, 2011, updated Dec. 14
© Holly Deyo
standeyo.com / DareToPrepare.com
This recent Fox News Live Science story says bigger quakes are NOT on the rise and that larger quakes don't trigger events on the opposite side of the planet. It states "On a local level, earthquakes do cluster and trigger one another, with a main shock often surrounded by fore- or aftershocks. But whether large earthquakes that occur thousands of miles across the globe from each other are related is a separate question."
$In fact, the first time I ever heard this phenomenon addressed was from Stan in 1995 and now many others report observing this 'seismic reaction'.
The next time an 7.8 or larger quake strikes, check this antipodal map and see if an answering quake doesn't occur within 24 hours. It is not an 'always' event and it is usually somewhat smaller, but there's an interesting correlation that bears study.
Now back to the discussion of whether or not the number of large quakes is growing.
The Fox article goes on to say that in a study, USGS scientist Andrew Michael "used three statistical methods to find out if large earthquakes cluster together or if what looks like clusters is just random variability. A first glance at global earthquakes since 1900 does look very clustered, he said. But as soon as you remove aftershocks from the equation, that pattern disappears."
First, numerous aftershocks can be nearly as strong as the earthquake itself, generally just 1 magnitude lower. Especially with larger events, aftershocks can be just as damaging. When looking at a Richter 7, of which there was 42 for 2010-2011, these can create havoc. Buildings and infrastructure, which took a beating from the main event, are now even more vulnerable to additional destructive shaking, slumping and sliding.
Second, when it's your life, your home, your business or livelihood, you won't care if the earthquake was classified an earthquake or an aftershock. Nor does USGS distinguish the two when recording yearly temblors. A quake is a quake.
By removing the aftershocks, USGS attempts to reign in its burgeoning statistics. This doesn't wash except to mute what must be their own growing concerns.
According to USGS' figures, earthquakes are increasing and most alarmingly, in the higher magnitudes. See for yourself.
How to Read the Chart
Listed in the white columns on the left are the magnitudes and the average number of earthquakes that occur annually for each. For each year are 2 corresponding colored columns. The first lists the actual number of shakers that struck for each Richter and in the next column what percent it is compared to the norm.
Now skip to the last 4 columns – 2 gray, 2 green.
The gray columns add together the number of quakes for each Richter that occurred for 2008 and 2009. The green columns do the same thing for 2010 and 2011 combined.
Red numbers show where magnitudes exceeded the norms. Not only did 2010/2011 exceed ALL of the norms for larger events, but the largest quakes, Richters 6, 7 and 8 - 9.9 gained significantly over 2008/2009.


How do you feel about this trend? Starting at 2008 doesn't really give us much room to really compare. It would be better if it was a huge chart going back to the 60s. Does one exist?
reply to post by murkraz
Puterman.......put on that cape and post that graph that I know you have sitting around just waiting for this very request.
Puterman.......put on that cape and post that graph that I know you have sitting around just waiting for this very request.
Originally posted by radpetey
reply to post by murkraz
Puterman.......put on that cape and post that graph that I know you have sitting around just waiting for this very request.
lol! I figured he'd have the goods.
The only one I've found is this, but it isn't super specific.

**************************************
The following link shows USGS Worldwide Deadly & Destructive Earthquakes between Magnitudes 6 and 8
The data: earthquake.usgs.gov...
The graph: www.thehorizonproject.com...
**************************************
The following link shows USGS Worldwide Deadly & Destructive Earthquakes between Magnitudes 6 and 8
The data: earthquake.usgs.gov...
The graph: www.thehorizonproject.com...
edit on 14-12-2011 by Gridrebel because: added additional info
Also this one here:
www.science20.com...

Along the vertical axis are the number of such earthquakes per year and along the horizontal axis are the years 1980 to 2009. The line plotted is a rolling 10-year average to see if there is any trend.
www.science20.com...
Along the vertical axis are the number of such earthquakes per year and along the horizontal axis are the years 1980 to 2009. The line plotted is a rolling 10-year average to see if there is any trend.
Originally posted by Gridrebel
Also this one here:
www.science20.com...
Along the vertical axis are the number of such earthquakes per year and along the horizontal axis are the years 1980 to 2009. The line plotted is a rolling 10-year average to see if there is any trend.
Did this plot take into consideration the increase of monitoring stations during that period?
reply to post by murkraz
One reason I went for a cut off low point of Mag 7 on my Major World Earthquakes research project is that the odds of a Mag 7 being missed is pretty slim, even back pre 1940s, so the numbers are likely to be more reliable over the longer term.
USGS scientist Andrew Michael said " A first glance at global earthquakes since 1900 does look very clustered. But as soon as you remove aftershocks from the equation, that pattern disappears."
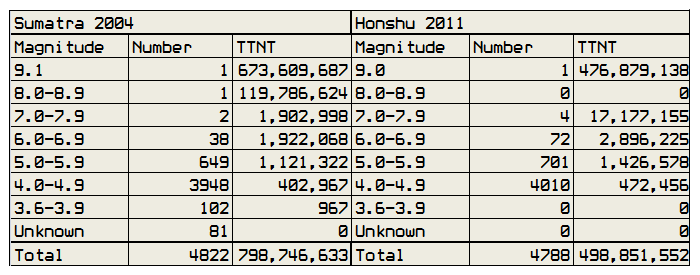
Agreed, Mag 6 Aftershocks can skew a whole years figures, take 2004 and 2011 for example, look at Japan, 72 x Mag 6 aftershocks just from that one main event
So I don't list 6's except inside the popup boxes on the maps as comparative data from other networks.
The problem is setting the parameters of when an aftershock period ends, is it 6 months? a year? 2 years?, 10 years? 100 years?
also what is the distance defined as the aftershock radius area?
too many variables to pick out single earthquake events and throw them away by calling them aftershocks
as you say just looking at 2008 on is pointless as well
heres my graph for 100 years, notice there is in fact a downturn since 2007, and the core base data source is the same, NEIC
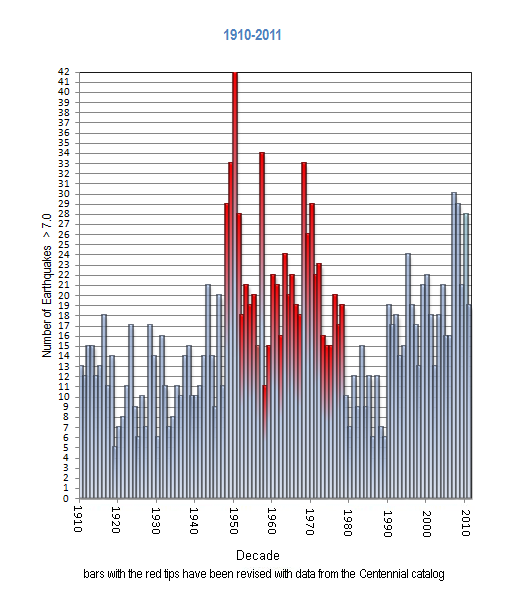
the chart by stan reyo shows quakes over Mag 7
2008 - 16
2009 -17
2010 - 24
I have
2008 - 29
2009 - 21
2010 - 28
but of course some of those 7's are aftershocks of even bigger 7's or 8's
even if the numbers were increasing, so what?, they have peaked higher in the past and then settled down again.
2011 has turned out to be a relatively quiet year number wise with 20 (I haven't added the latest PNG one to the graph yet)
One reason I went for a cut off low point of Mag 7 on my Major World Earthquakes research project is that the odds of a Mag 7 being missed is pretty slim, even back pre 1940s, so the numbers are likely to be more reliable over the longer term.
USGS scientist Andrew Michael said " A first glance at global earthquakes since 1900 does look very clustered. But as soon as you remove aftershocks from the equation, that pattern disappears."
Agreed, Mag 6 Aftershocks can skew a whole years figures, take 2004 and 2011 for example, look at Japan, 72 x Mag 6 aftershocks just from that one main event
So I don't list 6's except inside the popup boxes on the maps as comparative data from other networks.
The problem is setting the parameters of when an aftershock period ends, is it 6 months? a year? 2 years?, 10 years? 100 years?
also what is the distance defined as the aftershock radius area?
too many variables to pick out single earthquake events and throw them away by calling them aftershocks
as you say just looking at 2008 on is pointless as well
heres my graph for 100 years, notice there is in fact a downturn since 2007, and the core base data source is the same, NEIC
the chart by stan reyo shows quakes over Mag 7
2008 - 16
2009 -17
2010 - 24
I have
2008 - 29
2009 - 21
2010 - 28
but of course some of those 7's are aftershocks of even bigger 7's or 8's
even if the numbers were increasing, so what?, they have peaked higher in the past and then settled down again.
2011 has turned out to be a relatively quiet year number wise with 20 (I haven't added the latest PNG one to the graph yet)
edit on 15-12-2011 by muzzy because: (no reason given)
Seeing as you are talking charts, may I ask somebody to explain what this little 'blip' thing is here please?
aslwww.cr.usgs.gov...
aslwww.cr.usgs.gov...
It also showed up in Grenada and Cuba
Also this chart for Antarctica
aslwww.cr.usgs.gov...
Are the 'blanks' Antarctica's methane farts?
Rainbows
Jane
aslwww.cr.usgs.gov...
aslwww.cr.usgs.gov...
It also showed up in Grenada and Cuba
Also this chart for Antarctica
aslwww.cr.usgs.gov...
Are the 'blanks' Antarctica's methane farts?
Rainbows
Jane
Earthquake Details
This event has been reviewed by a seismologist.
Magnitude 6.3
Date-Time
Thursday, December 15, 2011 at 10:10:08 UTC
Thursday, December 15, 2011 at 10:10:08 PM at epicenter
Location 32.604°S, 179.103°W
Depth 34.1 km (21.2 miles)
Region SOUTH OF THE KERMADEC ISLANDS
Distances
391 km (243 miles) SSW (197°) from Raoul Island, Kermadec Islands
1330 km (826 miles) SSW (196°) from NUKU'ALOFA, Tonga
3397 km (2111 miles) SW (235°) from PAPEETE, Tahiti, French Polynesia
Location Uncertainty horizontal +/- 17.5 km (10.9 miles); depth +/- 3 km (1.9 miles)
Parameters NST=233, Nph=236, Dmin=389.6 km, Rmss=0.84 sec, Gp= 47°,
M-type=regional moment magnitude (Mw), Version=D
Source
Magnitude: USGS NEIC (WDCS-D)
Location: USGS NEIC (WDCS-D)
Event ID usc000770k
earthquake.usgs.gov...
edit on 15/12/2011 by PuterMan because: Rowlocks! I did fergit them derned ex tags agin and the bitty attribution.

new topics
-
SETI chief says US has no evidence for alien technology. 'And we never have'
Aliens and UFOs: 44 minutes ago -
This is our Story
General Entertainment: 3 hours ago -
President BIDEN Vows to Make Americans Pay More Federal Taxes in 2025 - Political Suicide.
2024 Elections: 5 hours ago -
Ode to Artemis
General Chit Chat: 6 hours ago -
Ditching physical money
History: 9 hours ago -
One Flame Throwing Robot Dog for Christmas Please!
Weaponry: 10 hours ago -
Don't take advantage of people just because it seems easy it will backfire
Rant: 10 hours ago -
VirginOfGrand says hello
Introductions: 11 hours ago -
Should Biden Replace Harris With AOC On the 2024 Democrat Ticket?
2024 Elections: 11 hours ago
top topics
-
University student disciplined after saying veganism is wrong and gender fluidity is stupid
Education and Media: 14 hours ago, 14 flags -
Police clash with St George’s Day protesters at central London rally
Social Issues and Civil Unrest: 17 hours ago, 10 flags -
President BIDEN Vows to Make Americans Pay More Federal Taxes in 2025 - Political Suicide.
2024 Elections: 5 hours ago, 10 flags -
Should Biden Replace Harris With AOC On the 2024 Democrat Ticket?
2024 Elections: 11 hours ago, 6 flags -
One Flame Throwing Robot Dog for Christmas Please!
Weaponry: 10 hours ago, 5 flags -
Ditching physical money
History: 9 hours ago, 4 flags -
Don't take advantage of people just because it seems easy it will backfire
Rant: 10 hours ago, 4 flags -
God lived as a Devil Dog.
Short Stories: 15 hours ago, 3 flags -
VirginOfGrand says hello
Introductions: 11 hours ago, 2 flags -
Geddy Lee in Conversation with Alex Lifeson - My Effin’ Life
People: 15 hours ago, 2 flags
active topics
-
University student disciplined after saying veganism is wrong and gender fluidity is stupid
Education and Media • 30 • : KrustyKrab -
Republican Voters Against Trump
2024 Elections • 288 • : burritocat -
SETI chief says US has no evidence for alien technology. 'And we never have'
Aliens and UFOs • 3 • : gortex -
Police clash with St George’s Day protesters at central London rally
Social Issues and Civil Unrest • 38 • : ohahhupthera -
Spectrophilia - Women Who Have Had Affairs With Ghosts Say Spooks Are Better Lovers Than Real Men
Paranormal Studies • 29 • : burritocat -
Should Biden Replace Harris With AOC On the 2024 Democrat Ticket?
2024 Elections • 45 • : burritocat -
Ditching physical money
History • 14 • : DerBeobachter2 -
British TV Presenter Refuses To Use Guest's Preferred Pronouns
Education and Media • 129 • : KrustyKrab -
-@TH3WH17ERABB17- -Q- ---TIME TO SHOW THE WORLD--- -Part- --44--
Dissecting Disinformation • 637 • : burritocat -
The Reality of the Laser
Military Projects • 33 • : ADVISOR