It looks like you're using an Ad Blocker.
Please white-list or disable AboveTopSecret.com in your ad-blocking tool.
Thank you.
Some features of ATS will be disabled while you continue to use an ad-blocker.

Quake Watch 2011
page: 305share:
Originally posted by wasobservingquietly
reply to post by PuterMan
I was especially intrigued by this one:
folkworm.ceri.memphis.edu...
Never saw one like it!
Yeah, once you see something like that, there is no need to look at that thing again until it is fixed and providing reliable data. Cause something in that signal chain is toast. PuterMan's observation of the 2000mv setting is pertinent, as waves that big at that setting would be above microseism level imo. But again, some component in the chain is clearly broken- so it could be just an artifact of the error.
The last time I talked to CalTech about some issues with one of their stations, they confirmed my GEE readings but then immediately said not to rely on ANY data coming from that station- because it was having an issue with the digitizer. I get the sense that once there is a certain amount of error in a signal chain, they will not use that station's data at all as a basis for anything. Because it is simply unreliable, and there is far more to lose basing reports on erratic data than there is to gain. Besides, usually there are other stations close enough by to cover until the broken station is fixed.
edit on Sat Oct 15th 2011 by TrueAmerican because: (no reason given)
reply to post by Robin Marks
As I understand it, the Arkansas fault is . . . alarmingly . . . close to the New Madrid fault system???
I'm not yet clear if the fracking is resulting in significantly heavy quakes or so far only minor ones?
Is there any evidence, yet, that the smaller quakes are setting up a bigger one?
As I understand it, the Arkansas fault is . . . alarmingly . . . close to the New Madrid fault system???
I'm not yet clear if the fracking is resulting in significantly heavy quakes or so far only minor ones?
Is there any evidence, yet, that the smaller quakes are setting up a bigger one?
now mount rainier in the pickture?
Magnitude
2.9
Date-Time
Friday, October 14, 2011 at 23:29:12 UTC
Friday, October 14, 2011 at 04:29:12 PM at epicenter
Time of Earthquake in other Time Zones
Location
46.854°N, 121.754°W
Depth
0.9 km (~0.6 mile) set by location program
Region
MOUNT RAINIER AREA, WASHINGTON
Distances
23 km (14 miles) ENE (61°) from Ashford, WA
34 km (21 miles) SE (138°) from Carbonado, WA
34 km (21 miles) SSW (198°) from Greenwater, WA
69 km (43 miles) SE (129°) from Tacoma, WA
96 km (60 miles) SSE (153°) from Seattle, WA
Location Uncertainty
horizontal +/- 0.9 km (0.6 miles); depth fixed by location program
Parameters
NST= 39, Nph= 39, Dmin=2 km, Rmss=0.29 sec, Gp= 40°,
M-type=duration magnitude (Md), Version=1
Source
Pacific Northwest Seismograph Network
edit on 15-10-2011 by ressiv because: (no reason given)
Originally posted by ressiv
now mount rainier in the pickture?
Magnitude
2.9
Yeah, and there was also a 3.4 very close to the 2.9 as well:
earthquake.usgs.gov...
The last thing we need is for Rainier to get fidgety.
I command ye, Rainier, shut it!
Now folks, am I turning into a conspiracy theorist?
Jujuy Argentina 6.2 reduced to 5.9
Tell me why it is my perception that the second the quakes hit the 8th day they get put into the bargain basement sales?
Whilst I noted at the time that the two tensor solution were different - one at 6.1 and the other at 6.0, I did look at the phase data at the time and there were a bunch of 6.7s in the phases, and 6.4s. I did not average it but I certainly had no reason to think it was going to be reduced as I sometimes do.
If you can't be bothered finding the different elements on the USGS pages it is all here as usual on the one page
Originally posted by PuterMan
Now folks, am I turning into a conspiracy theorist?
Please don't. You're one of the few sane left.
But I wish I knew what was going on up there. They have been downgrading and upgrading like there's no tomorrow. How can they be so wrong, so often, even AFTER review by a "seismologist?" :shk:
I haven't been on GEE much lately, or I surely would have seen that one. If you want I can pull the waveform data and give you the official TA magnitude guesstimate ... But that's not going to help either. They just need to get it together up there. One of these days there's going to be a ~7, and they're going to call it an 8.3 and totally freak everyone out at first until they downgrade it. Emergency management agencies quite depend on the USGS to allocate resources and other things depending on magnitude, shakemaps, etc. They need to get it right after first review, or fire the sukka.
2 quakes felt in the last hour in the capitol of Iceland and nearby towns.
Just below 4 on the richter scale but that whole area has been active with hundreds of quakes.
Seems like the quakes are getting a bit more intense lately. Stay tuned..
Just below 4 on the richter scale but that whole area has been active with hundreds of quakes.
Seems like the quakes are getting a bit more intense lately. Stay tuned..
reply to post by Mystic Technician
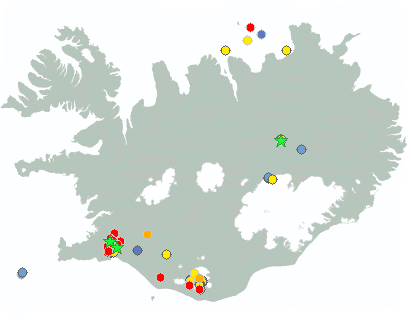
Man, that is nuts, look at this bizarre quake swarm slamming Iceland:
en.vedur.is...
A couple of those near 4 mag.
Seems it might have something to do with the recent activity at Katla? Or rather, it is suspiciously close in time to the recent quakes at Katla- to not be connected in some way.
Man, that is nuts, look at this bizarre quake swarm slamming Iceland:
en.vedur.is...
A couple of those near 4 mag.
Seems it might have something to do with the recent activity at Katla? Or rather, it is suspiciously close in time to the recent quakes at Katla- to not be connected in some way.
No ,the interesting thing here to note is that they say they're actually causing the quakes
because they've been drilling new geothermal wells and tapping water into the cracks.
There was an interview last night about Katla though ,in which they analyzed the risks.
Its ashes would undoubtedly be less fine and more likely to disrupt engines ,
but depending on how the volcano will erupt the effects could either be minimal or catastrophic.
edit on 15/10/2011 by Mystic Technician
because: Edit to fix
Originally posted by Mystic Technician
No ,the interesting thing here to note is that they say they're actually causing the quakes
because they've been drilling new geothermal wells and tapping water into the cracks.
For these back to back swarms we are talking about here, I'd have to disagree it has anything to do with fracking. I could MAYBE understand a quake or two due to that, but a swarm like this? Not likely.
So what, are they fracking into Katla too to cause those quake swarms?
Speaking of which, I have a hunch that IF fracking can cause quakes, those quakes would have a higher center frequency content than fault based quakes. If that proved to be true they would be distinguishable. And all that implies- to the fracking companies.
Originally posted by PuterMan
Now folks, am I turning into a conspiracy theorist?
Jujuy Argentina 6.2 reduced to 5.9
Tell me why it is my perception that the second the quakes hit the 8th day they get put into the bargain basement sales?
Conspiracy it might just be. As soon as the quake hit, everyone analyse thus USGS & co can't be too far off the mark. After few days it is old history and people do not really care anymore. Who would worry about old case details? Most people only care about that happens today, a little about yesterday and some about tomorrow. Last week - well that is so long ago - what happened then?
They need to 'balance the books' when annual totals are added up. At least in such way that the whistle blowers do not have ammunition to shoot with; do not scare the peaceful people. In other words, it is not about the single quake, but the total numbers over the year - those above 5.0 or 6.0 or 7.0 . . .
Magnitude 4.0
Date-Time
Saturday, October 15, 2011 at 11:42:29 UTC
Saturday, October 15, 2011 at 04:42:29 AM at epicenter
Time of Earthquake in other Time Zones
Location 37.906°N, 118.563°W
Depth 9.8 km (6.1 miles)
Region CENTRAL CALIFORNIA
earthquake.usgs.gov...
and now a
Magnitude 2.7
Date-Time
Saturday, October 15, 2011 at 11:54:54 UTC
Saturday, October 15, 2011 at 04:54:54 AM at epicenter
Location 37.910°N, 118.565°W
Depth 9 km (5.6 miles)
Region CENTRAL CALIFORNIA
earthquake.usgs.gov...
Is this a new active area?
Date-Time
Saturday, October 15, 2011 at 11:42:29 UTC
Saturday, October 15, 2011 at 04:42:29 AM at epicenter
Time of Earthquake in other Time Zones
Location 37.906°N, 118.563°W
Depth 9.8 km (6.1 miles)
Region CENTRAL CALIFORNIA
earthquake.usgs.gov...
and now a
Magnitude 2.7
Date-Time
Saturday, October 15, 2011 at 11:54:54 UTC
Saturday, October 15, 2011 at 04:54:54 AM at epicenter
Location 37.910°N, 118.565°W
Depth 9 km (5.6 miles)
Region CENTRAL CALIFORNIA
earthquake.usgs.gov...
Is this a new active area?
reply to post by Aromaz
Aromaz! Nice to see you safe and well. I was thinking about you over the past few days and was a little concerned about all the flooding. It is very sad and worriesome. Stay safe
Rainbows
jane
Aromaz! Nice to see you safe and well. I was thinking about you over the past few days and was a little concerned about all the flooding. It is very sad and worriesome. Stay safe
Rainbows
jane
reply to post by TrueAmerican
You just might be wrong in this instance TA. Can you handle that?
Reykjanes has been swarming away since they started extracting geothermal power from it, or just since.., and it is often like that. Actually it seems to have explosive phases. One in Feb/March (see 27th Feb) and one in September. On the odd occasion it also blasts off a 6 or two when the MAR gets in on the party as well.
Of course Krisuvik volcano is also there..........
If anyone has 8 minutes to idle away you might like to look at this which is all the 'All Iceland' maps I have collected this year. Basically it is an image for each hour that my computer is on - which is normally around 17 hours a day. There are 4900+ images in this video. (Warning for Dial up: This is a 7.5 MB file)
01 Jan 2011 to 15 Oct 2011 All Iceland Map Images
Take a look at May 22 as well when Myrdalsjokull and Vatnajokull exploded into action simultaneously!
reply to post by PuterMan
lol, well if you can show a difference in the spectrum analysis of the quakes, maybe you could prove it is fracking. Then of course you could be either rich or dead when they catch up with you...
lol, well if you can show a difference in the spectrum analysis of the quakes, maybe you could prove it is fracking. Then of course you could be either rich or dead when they catch up with you...
reply to post by TrueAmerican
Not fracking TA. Hydrothermal - very different. Fracking is cold. Hydro obviously is masses of steam under high pressure. It can get to places fracking cannot reach - rather like Heiniken
Not fracking TA. Hydrothermal - very different. Fracking is cold. Hydro obviously is masses of steam under high pressure. It can get to places fracking cannot reach - rather like Heiniken
reply to post by Aromaz
Sort of yes and no. If I could point a finger at USGS and say 'look all the earthquakes go down after 7 days' then I would agree with you.
Trouble is they don't all go down. A good number go up as well - some even jumping into Mag 6 from 5.6!
You can get a feel for it from my 2011 listings for Mag 6 where I have done most of the adjustments except March which is a nightmare of changes but I am getting there. If a quake goes up or down it has ↑ or ↓ against it and you can see there are several up arrows.
You are right about the timing however I think. As you say more than a couple of days and the quake is forgotten and it is only quake nuts like me that follow the history of the quake beyond 7 days. Most people and most web sites NEVER register these changes. (And that includes some more scientific sites as well)
edit on 15/10/2011 by PuterMan because: (no reason given)
The water involved in fracking may enter the ground cold, but, it doesn't take long to heat up water when it's under pressure. Pressure creates
heat.
The largest earthquake known to be caused from injection, the process used at the end of fracking, was a 5.0M in Colorado. Arkansas experienced a quake of 4.7M this year. There is no proof fracking causes major earthquakes. But injection has proven to cause earthquakes. Injection also causes quakes in the geo-thermal industry. In places like Iceland.
"In 1961, a 12,000-foot well was drilled at the Rocky Mountain Arsenal, northeast of Denver, for disposing of waste fluids from Arsenal operations. Injection was commenced March 1962, and an unusual series of earthquakes erupted in the area shortly after.
It was 32 minutes after 4 a.m. on April 24 when the first shock of the Denver series was recorded at the Cecil H. Green Geophysical Observatory at Bergen Park, Colorado. Rated magnitude 1.5, it was not strong enough to be felt by area residents. By the end of December 1962, 190 earthquakes had occurred. Several were felt, but none caused damage until the window breaker that surprised Dupont and Irondale on the night of December 4. The shock shuffled furniture around in homes, and left electrical wall outlets hanging by their wires at Irondale.
Over 1,300 earthquakes were recorded at Bergen Park between January 1963 and August 9, 1967. Three shocks in 1965 -- February 16, September 29, and November 20 -- caused intensity VI damage in Commerce City and environs.
The Denver series was forgotten, however temporarily, in October 1966, when a southeast Colorado tremor rocked a 15,000 square-mile area of that State and bordering New Mexico. Minor damage, in the form of broken windows and dishes and cracked walls and plaster, occurred at Aguilar, Segundo, Trinchera, and Trinidad.
Another strong shock rumbled through the Denver area on November 14, 1966, causing some damage at Commerce City and Eastlake. Slighter rumblings (below magnitude 3.0) occurred throughout the remainder of 1966, and through the first week of April 1967.
Then, on April 10, the largest since the series began in 1962 occurred; 118 windowpanes were broken in buildings at the Rocky Mountain Arsenal, a crack in an asphalt parking lot was noted in the Derby area, and schools were dismissed in Boulder, where walls sustained cracks. Legislators quickly moved from beneath chandeliers in the Denver Capitol Building, fearing they might fall. The Colorado School of Mines rated this shock magnitude 5.0. "
earthquake.usgs.gov...
Arkansas has experienced a 4.7M. Scott Ausbrook reassessed the size of the fault and realized it was twice as big as he first thought. His revised estimate had the top end maximum of 6.0M if the full fault ruptured. But there's a problem with this. The fault is even longer than his second guess. The swarm in Quitman, which continues as we speak. There was just one posted. Wow, they posted both of them. Usually the miss some of the smaller ones. It's not only aftershocks from the big ones they miss. They also miss the ones around 1M when it comes to Arkansas. And there's times they never posted quakes I observed in real time.
Anyway. If the fault is larger by one third, then the maximum magnitude will increase. My guess, the maxium could be a 6.4M.
To be later downgraded by the USGS to a 6.2M
Check the area around the recent Colorado quakes. They are doing some kind of energy drilling. Along with the coal mines.
Texas has 53 000 injection wells for disposal. That number won't leave my head. On top of the ground, they are suffering the worst drought in memory. Yet, they are pumping bazillions of liters of water underground. Does this rack your brains as much as it does mine. I can digest the scale, it's trying to express it to you all that's the problem. Doesn't the irony scream of the absurd nature of our industrialized existence?
Think about it.
MAP 2.1 2011/10/15 11:26:15 35.364 -92.284 5.0 6 km ( 4 mi) WSW of Quitman, AR
MAP 2.3 2011/10/15 10:26:29 35.363 -92.278 4.7 6 km ( 4 mi) WSW of Quitman, AR
edit on 15-10-2011 by Robin Marks because: (no reason given)
reply to post by PuterMan
Well I see you have Iceland covered ...................... and then some
Great video
Did you use Snagit to grab those maps automatically?
Apart from the Feb cluster you mentioned looks like since Sep the Katla to Reykjanes ridge has been pretty active.
They don't really get many quakes over 3 do they?
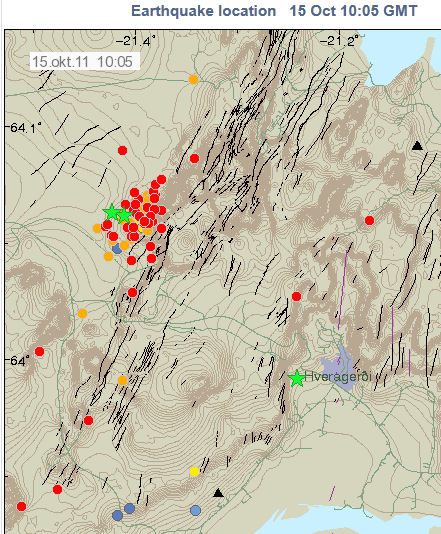
As I mentioned over on VolcWatch just now 17.3 tonnes of TNT released today at Hengill so far, 111 micro or very minor events, how does that compare with Feb 22?
What interests me is how Hengill being an area of Geothermal extraction looks a bit like The Geysers geothermal area when it comes to small micro quakes, yet here in New Zealand at Wairakei the largest geothermal energy plants in the Southern Hemisphere and Kawerau another large geothermal plant that produces energy for the timber industry, there doesn't seem to be anywhere near the same amount of siesmic movement in the area, despite "fracking" to produce the steam since the mid 1950's.
Well I see you have Iceland covered ...................... and then some
Great video
Did you use Snagit to grab those maps automatically?
Apart from the Feb cluster you mentioned looks like since Sep the Katla to Reykjanes ridge has been pretty active.
They don't really get many quakes over 3 do they?
As I mentioned over on VolcWatch just now 17.3 tonnes of TNT released today at Hengill so far, 111 micro or very minor events, how does that compare with Feb 22?
What interests me is how Hengill being an area of Geothermal extraction looks a bit like The Geysers geothermal area when it comes to small micro quakes, yet here in New Zealand at Wairakei the largest geothermal energy plants in the Southern Hemisphere and Kawerau another large geothermal plant that produces energy for the timber industry, there doesn't seem to be anywhere near the same amount of siesmic movement in the area, despite "fracking" to produce the steam since the mid 1950's.
Pre Mid Month NZ Update
on the 14th Oct there were 14 preliminary events with a total energy release of 14 tonnes of TNT
So far in Oct (14 days)
261 Events, Total Energy Released 21,607.138 tonnes of TNT (5 events above Mag 5)
compared with
Sept (30 days) 712 Events, Total Energy Released 57,488 tonnes of TNT (3 events above Mag 5)
August (31 days) 606 Events, Total Energy Released: 2,350 tonnes of TNT ( 1 event above Mag 5)
or to the same time period (14 days)
Sept 1st to 14th 380 Events, Total Energy Released 1,724 tonnes of TNT ( 1 event above Mag 5, the S of Kermy 6.336ML hit on the 15th, adding 48,176 tonnes of TNT)
Aug 1st to 14th 245 Events, Total Energy Released 1,234.56 tonnes of TNT (1 event above Mag 5)
aren't numbers fun
Edit: graph of that ?
Of course
edit on 15-10-2011 by muzzy because: (no reason given)
new topics
-
Israeli Missile Strikes in Iran, Explosions in Syria + Iraq
World War Three: 15 minutes ago -
George Knapp AMA on DI
Area 51 and other Facilities: 5 hours ago -
Not Aliens but a Nazi Occult Inspired and then Science Rendered Design.
Aliens and UFOs: 5 hours ago -
Louisiana Lawmakers Seek to Limit Public Access to Government Records
Political Issues: 8 hours ago -
The Tories may be wiped out after the Election - Serves them Right
Regional Politics: 9 hours ago -
So I saw about 30 UFOs in formation last night.
Aliens and UFOs: 11 hours ago
top topics
-
BREAKING: O’Keefe Media Uncovers who is really running the White House
US Political Madness: 12 hours ago, 25 flags -
George Knapp AMA on DI
Area 51 and other Facilities: 5 hours ago, 19 flags -
Biden--My Uncle Was Eaten By Cannibals
US Political Madness: 13 hours ago, 18 flags -
"We're All Hamas" Heard at Columbia University Protests
Social Issues and Civil Unrest: 13 hours ago, 7 flags -
Louisiana Lawmakers Seek to Limit Public Access to Government Records
Political Issues: 8 hours ago, 7 flags -
So I saw about 30 UFOs in formation last night.
Aliens and UFOs: 11 hours ago, 5 flags -
Israeli Missile Strikes in Iran, Explosions in Syria + Iraq
World War Three: 15 minutes ago, 4 flags -
The Tories may be wiped out after the Election - Serves them Right
Regional Politics: 9 hours ago, 3 flags -
Not Aliens but a Nazi Occult Inspired and then Science Rendered Design.
Aliens and UFOs: 5 hours ago, 3 flags -
Do we live in a simulation similar to The Matrix 1999?
ATS Skunk Works: 12 hours ago, 3 flags
active topics
-
Israeli Missile Strikes in Iran, Explosions in Syria + Iraq
World War Three • 2 • : BernnieJGato -
MULTIPLE SKYMASTER MESSAGES GOING OUT
World War Three • 36 • : Irishhaf -
Candidate TRUMP Now Has Crazy Judge JUAN MERCHAN After Him - The Stormy Daniels Hush-Money Case.
Political Conspiracies • 386 • : WeMustCare -
British TV Presenter Refuses To Use Guest's Preferred Pronouns
Education and Media • 61 • : nugget1 -
-@TH3WH17ERABB17- -Q- ---TIME TO SHOW THE WORLD--- -Part- --44--
Dissecting Disinformation • 535 • : cherokeetroy -
African "Newcomers" Tell NYC They Don't Like the Free Food or Shelter They've Been Given
Social Issues and Civil Unrest • 15 • : marg6043 -
Alabama Man Detonated Explosive Device Outside of the State Attorney General’s Office
Social Issues and Civil Unrest • 58 • : Unknownparadox -
BREAKING: O’Keefe Media Uncovers who is really running the White House
US Political Madness • 13 • : WeMustCare -
"We're All Hamas" Heard at Columbia University Protests
Social Issues and Civil Unrest • 127 • : marg6043 -
Two Serious Crimes Committed by President JOE BIDEN that are Easy to Impeach Him For.
US Political Madness • 16 • : WeMustCare