It looks like you're using an Ad Blocker.
Please white-list or disable AboveTopSecret.com in your ad-blocking tool.
Thank you.
Some features of ATS will be disabled while you continue to use an ad-blocker.

Quake Watch 2011
page: 284share:
Originally posted by Robin Marks
Puterman,
Here's the siesmo from WHAR.
folkworm.ceri.memphis.edu...
It is my imagination, or are there three quakes on the graph. If so, why do you think they are not posting them to the USGS map?
I use the 3-D earthquake model. Its really good.Just download it and your ready to go. I find it better then the USGS map. The usgs map does not show all quakes...You'll find that out if you down load the earthquake 3-D.
reply to post by Deplume
As Robin said, that sort of quake activity in and around Greece is quite typical for the region. It's been active pretty much throughout the history of human habitation there.
By the way, RSOE is not exactly the most reliable source. Interesting, yes, but for quake data not the best. It's more as a result of their all-purpose reporting than anything I guess. They tend to make little mistakes at times, like putting quakes in the wrong places on the maps and so on. Specialist sites are better if you want solid information.
Besides the USGS, another source of reliable data in near-real-time is EMSC. Plenty of good data on their pages. They are often an excellent resource to follow "smaller" quakes -- like for example the current activity in the Canary Islands. There are various other sites as well. Members here can fill you in on just about anything you want to know.
reply to post by PuterMan
I know the link to the report you posted was for muzzy but I've snaffled a copy as it's one I didn't have yet. Many thanks... The more info we can get on this the better.
Best regards,
Mike
edit on 27/9/11 by JustMike because: I edited it.
reply to post by JustMike
just an update,,
santorini
~3600 yrs ago
~1589 b.c
santorini
that is why earthquake,,
we hope so,,
enough too relieve pressure.
santorini is one of three still in the running,, for omg.
just an update,,
santorini
~3600 yrs ago
~1589 b.c
santorini
that is why earthquake,,
we hope so,,
enough too relieve pressure.
santorini is one of three still in the running,, for omg.
reply to post by JustMike
thanks mike, i suppose thats as good a place as any.
I'm just downloading a pdf off Wiki about it, 116MB , about theTsunami, maybe theres some clues in there
@ Puterman, thanks, that looks like a future scenerio though, rather than the 1700 one.
edit:gave up on that "orphan tsunami pdf" taking too long to download:dn
this one page 10 has several likely locations, three of them close to 46N 126W, so I'll use that for now with an approx. tag on it:
edit on 27-9-2011 by muzzy because: (no reason given)
reply to post by eeks4
I guess that depends which USGS map you might be looking at really. Earthquake 3D is very good for a visualisation indeed. Anyone interested go to my links and so to the software section where you will find a link to the download.
Earthquake 3D actually uses the USGS 7 day text file so it will be exactly that same, in theory, as the Magnitude 1.0+ listing.
reply to post by muzzy
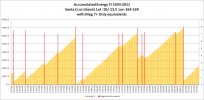
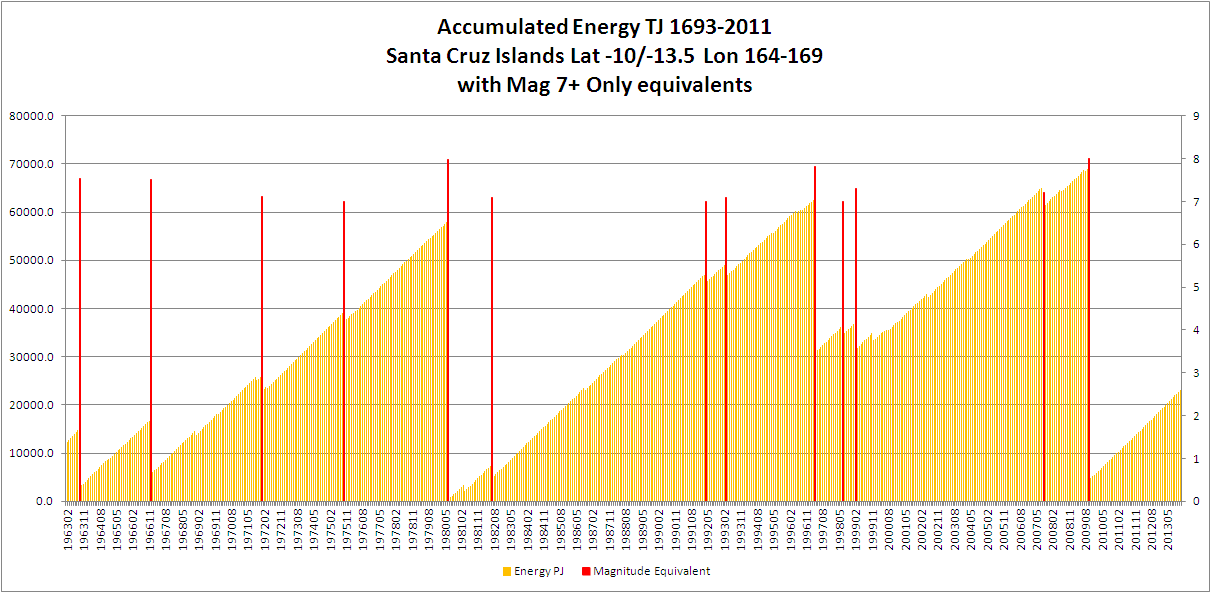
Oh, I have to say I did not notice that. But then I seem to be malfunctioning today! That last graph was Terajoules not Petajoules. Duh!
Anyway, here is the map again - in Terajoules - where I have converted that TJ back to a magnitude equivalent and replaced the counts. To show all of them makes such a mess that I decided to cut out any equivalent below 7.0
Really does show the stress relief from the big ones.
reply to post by PuterMan
now its starting to all come together, I used my 7+ project to see what those spikes were on your graph where there was a really big sudden drop off afterwards
1980/7/8 23:19:19.8 Mag 7.5
1980/7/17 19:42:23.2 Mag 7.9
side by side
1980
but nothing over 7 in 1996 (maybe a bunch of high 6's? , I haven't looked)
1996
then that triple whammy on 2009
Date/Time: 2009/10/7 22:3:14.4 Mag 7.6
Date/Time: 2009/10/7 22:18:51.2 Mah 7.9
Date/Time: 2009/10/7 23:13: Mag 7.3
2009
you know, I think there is more merit in looking at individual regions for trends than there is trying to tie in quakes from all over the world.
edit on 27-9-2011 by muzzy because: (no reason given)
I'm posting the song. Not because I take the situation lightly. I'm making associations because I'm nervous.
2.5M Dell, Ark.
"Ol' man river,
Dat ol' man river
He mus'know sumpin'
But don't say nuthin',
He jes'keeps rollin'
He keeps on rollin' along."
www.youtube.com...
They've posted two quakes in Arkansas but still haven't posted my mystery quakes.
It seems to me the Mississippi is unzipping. The quakes are migrating from north to south. It seems a trend line to me. It's definately a cluster. I'll stop repeating that when the pattern stops manifesting itself in clusters.
Worldwide quakes are still in a lull.
Hell of a year to this point.
Maybe the earth's shaken itself out of steam. I doubt it.
edit on 27-9-2011 by Robin Marks because: (no reason given)
reply to post by Robin Marks
I just saw the 2.5 in Arkansas and wondered what you would have to say about this one.... being they posted it. I wonder whats up myself.
I just saw the 2.5 in Arkansas and wondered what you would have to say about this one.... being they posted it. I wonder whats up myself.
reply to post by MamaJ
If there were just three or four quakes along the Mississippi I wouldn't consider it abnormal. In fact, I am comforted when it has alternating quakes on opposite sides of the river. That's the norm. They come and go and are very regular. It is rarer to have a prolonged quiet period. Before all the action in Col, Virgina, it had been on the down low off and on. Kinda quiet. Then it return to normal. I'm only wondering about something extraordinary because of the 3.8M just before the river started chiming in.
If you think of Colorado and Virginia on the poles, or anterior, then Arkansas and the NMSZ are in the interior. So, first we had central quakes. Texas, Okie, etc included. Then we had the ends go off. Then back to the center. Then aftershocks out on the poles again. Now it's the center. This seems to be the pattern.
It's like a bowl full of jelly. The waves rush out to the edge of the bowl, then rebound into the center, then colliding and rebound out again. Remember, these are central mid-continental quakes. The normal rules don't apply. You need to think of it in different terms. No super subduction here. Here it's Jello. TM
reply to post by muzzy
I don't think there's anyway to determine the epicenter for the 1700 quake. It ruptured the whole way along the fault. In browsing I notice someone claims the next one would be toward SeattleVancouver. So, maybe the last one was south of there. No one knows.
I don't think there's anyway to determine the epicenter for the 1700 quake. It ruptured the whole way along the fault. In browsing I notice someone claims the next one would be toward SeattleVancouver. So, maybe the last one was south of there. No one knows.
reply to post by PuterMan
Before i try to write down a Theory of mine,i have to ask you and the People on this Thread what HAARP is measuring,and what we saw (in layman Terms) before big Earthquakes like those of Chile and Japan.
Before i try to write down a Theory of mine,i have to ask you and the People on this Thread what HAARP is measuring,and what we saw (in layman Terms) before big Earthquakes like those of Chile and Japan.
Magnitude
3.5
Date-Time
Wednesday, September 28, 2011 at 06:31:20 UTC
Wednesday, September 28, 2011 at 12:31:20 AM at epicenter
Time of Earthquake in other Time Zones
Location
37.894°N, 112.069°W
Depth
0.1 km (~0.1 mile) (poorly constrained)
Region
UTAH
Distances
24 km (15 miles) SSW (201°) from Antimony, UT
30 km (19 miles) N (3°) from Tropic, UT
33 km (20 miles) ENE (76°) from Panguitch, UT
43 km (27 miles) WNW (289°) from Escalante, UT
215 km (134 miles) NE (55°) from Mesquite, NV
319 km (198 miles) S (183°) from Salt Lake City, UT
Location Uncertainty
horizontal +/- 1.3 km (0.8 miles); depth +/- 10.3 km (6.4 miles)
Parameters
NST= 23, Nph= 23, Dmin=19 km, Rmss=0.49 sec, Gp=137°,
M-type=local magnitude (ML), Version=2
Source
University of Utah Seismograph Stations
Event ID
uu00008151
earthquake.usgs.gov...
On the 37th parallel
reply to post by muzzy
My feelings precisely, the only thing is defining the regions correctly - but I am sure we can sort that between us.
According to ANSS there was a 7.5 of unknown magnitude type
I'll graph 'em, you map 'em.
you know, I think there is more merit in looking at individual regions for trends than there is trying to tie in quakes from all over the world.
My feelings precisely, the only thing is defining the regions correctly - but I am sure we can sort that between us.
According to ANSS there was a 7.5 of unknown magnitude type
1966/12/31 18:23:06.60,-11.9000,166.4000,56.00,7.50,Unk,121,,,0.00,NEI,1966123140
I'll graph 'em, you map 'em.
edit on 28/9/2011 by PuterMan because: (no reason given)
reply to post by Robin Marks
I don't - temporarily. I have said all along since Japan there will not be another mega quake this year.
By the way one of those looked like an earthquake on that seismogram and the other two small blips probably were micro quakes but I am guessing under 1.0 so probably not posted anywhere.
Maybe the earth's shaken itself out of steam. I doubt it.
I don't - temporarily. I have said all along since Japan there will not be another mega quake this year.
By the way one of those looked like an earthquake on that seismogram and the other two small blips probably were micro quakes but I am guessing under 1.0 so probably not posted anywhere.
reply to post by Shenon
First let's define HAARP. The array does not measure anything. It generates high freqency waves to heat the ionosphere.
What 'we saw' is NOT HAARP, it is the magnetometer at the HAARP site in Gakona, Alaska. I know I have HAARP on the two versions in my signature and I suppose I am guilty of perpetuating the mistake but if I did not do that and changed it to Gakona many would not realise what it is because of the dafties on You-Tube.
So we are talking about the magnetometers at Gakona and what these are measuring is change in magnetic flux, in effect measuring solar wind and lightning.
I could go on and on but - from the Gakona web site....from the Magnetometer page.....
Oops, forgot the layman's terms.
What we saw, or are seeing, is changes in the earth's magnetic field, as registered at the site at Gakona, that have been caused either by solar wind, CMEs or localised lightening amongst other things.
Note that these are as measured at Gakona, in other words it is a local reading and may be different measure somewhere else.
You can also find magnetometer readings on incoming flux from the satellites but I seem to have lost my link for that one.
Other sites:
www.solen.info...
helios.izmiran.rssi.ru...
You should also be aware that it is not just a simple matter of looking at sunspots and estimating solar flares as so many do. (OMG there is a big sun spot. A CME is going to get us!!)
Take a look at this image
The pink areas are negative magnetic fields so actually on 11302 which produced the 2 small X class flares as it appeared, at least 50% of the sunspot group is negative and unlikely to do anything (as I understand it) yet they still get counted as 'active' sunspots.
HAARP is measuring,and what we saw (in layman Terms) before big Earthquakes like those of Chile and Japan.
First let's define HAARP. The array does not measure anything. It generates high freqency waves to heat the ionosphere.
What 'we saw' is NOT HAARP, it is the magnetometer at the HAARP site in Gakona, Alaska. I know I have HAARP on the two versions in my signature and I suppose I am guilty of perpetuating the mistake but if I did not do that and changed it to Gakona many would not realise what it is because of the dafties on You-Tube.
So we are talking about the magnetometers at Gakona and what these are measuring is change in magnetic flux, in effect measuring solar wind and lightning.
I could go on and on but - from the Gakona web site....from the Magnetometer page.....
Magnetic field variations of interest in this program are those induced by electric currents in the ionosphere. The major signal categories detected by the induction magnetometer are short period magnetic pulsations such as Pc1, Pc2, Pc3, PiB, and PiC in a frequency range above a few tens of milliHertz. Among these, the induction magnetometer most efficiently detects Pc1 waves in the frequency range from 0.1 Hz to 3 Hz. Pc1 signals are the result of ion-cyclotron radiation generated near the equatorial plane of the outer-magnetosphere that make their way to the ionosphere guided by the magnetic lines of force. In addition, signals generated in the atmosphere that are caused by lightning discharges, the Schuman resonances, are also detected and sometimes become strong enough to mask signals from the ionosphere.
Oops, forgot the layman's terms.
What we saw, or are seeing, is changes in the earth's magnetic field, as registered at the site at Gakona, that have been caused either by solar wind, CMEs or localised lightening amongst other things.
Note that these are as measured at Gakona, in other words it is a local reading and may be different measure somewhere else.
You can also find magnetometer readings on incoming flux from the satellites but I seem to have lost my link for that one.
Other sites:
www.solen.info...
helios.izmiran.rssi.ru...
You should also be aware that it is not just a simple matter of looking at sunspots and estimating solar flares as so many do. (OMG there is a big sun spot. A CME is going to get us!!)
Take a look at this image
The pink areas are negative magnetic fields so actually on 11302 which produced the 2 small X class flares as it appeared, at least 50% of the sunspot group is negative and unlikely to do anything (as I understand it) yet they still get counted as 'active' sunspots.
edit on 28/9/2011 by PuterMan because: (no reason given)
El Hierro about to go? Evacuations and inflation, and a bunch of quakes yesterday/today.
List here: www.abovetopsecret.com...
38 above mag 2 yesterday. 27 so far today and we are only halfway through.
List here: www.abovetopsecret.com...
38 above mag 2 yesterday. 27 so far today and we are only halfway through.
edit on 28/9/2011 by PuterMan because: (no reason given)
reply to post by PuterMan
Why does everyone leave out the most important part of ,,,,
"Induction Magnetometer",,
and it ain't Magnetometer.
Now if there are any left on this planet,,
(including people of the electrical Engineering world,
ie,, Masters and above,,trade speaking,,)
who might actually understand the implications,
( I am not going too explain " Induction in A Electrical Field its Cause and Function " )
then MAYBE some other people might actually understand the implications.
Until then,
A lonely tortured soul.
And yes i believe it also has an Effect,, on
" My Car Windshield Has a Stone Chip "
Will it spread, and why?
another of my
books?
lol
ohh and contrary too popular belief,, " Rusty Springs "
by I.P. Nightly.
is not mine.
edit on 28-9-2011 by BobAthome because: (no reason given)
Nevada is shaking a bit further North than normal:
Be Well.
Magnitude
3.9
Date-Time
Wednesday, September 28, 2011 at 11:54:03 UTC
Wednesday, September 28, 2011 at 04:54:03 AM at epicenter
Location
39.982°N, 117.930°W
Depth
9.1 km (5.7 miles)
Region
NEVADA
Distances
35 km (22 miles) NNE (21°) from Dixie Valley, NV
51 km (32 miles) ESE (115°) from Lovelock, NV
64 km (40 miles) NW (318°) from Petersons Mill, NV
343 km (213 miles) ENE (61°) from Sacramento, CA
Location Uncertainty
horizontal +/- 2.3 km (1.4 miles); depth +/- 0.7 km (0.4 miles)
Parameters
NST= 67, Nph= 46, Dmin=102.3 km, Rmss=0.18 sec, Gp=202°,
M-type=local magnitude (ML), Version=8
Source
Seismological Laboratory, University of Nevada, Reno
Event ID
nn00349385
Be Well.
reply to post by Robin Marks
I understand what you are saying....and I am determined to remain alert of the possibility of the New Madrid blowing although at the same time I am determined not to live life scared.
The quakes this morning in Utah, Nevada, and California are also nerving. The cycle our planet goes through is one that would need to be looked at since its conception and there is no way of doing that. In the last two hundred years what would you say is there average quake per year on the New Madrid? Are we exceeding that number and does it even matter?
There has got to be a way to understand quake activity and notice a normal, high, and irregular. Does that make sense?
I have only had one cup of coffee this morning so excuse me if I sound goofy. I am trying to get ready for work and keep up with my most favorite site!
new topics
-
University of Texas Instantly Shuts Down Anti Israel Protests
Education and Media: 1 hours ago -
Any one suspicious of fever promotions events, major investor Goldman Sachs card only.
The Gray Area: 3 hours ago -
God's Righteousness is Greater than Our Wrath
Religion, Faith, And Theology: 8 hours ago -
Electrical tricks for saving money
Education and Media: 11 hours ago
top topics
-
VP's Secret Service agent brawls with other agents at Andrews
Mainstream News: 12 hours ago, 10 flags -
Cats Used as Live Bait to Train Ferocious Pitbulls in Illegal NYC Dogfighting
Social Issues and Civil Unrest: 16 hours ago, 8 flags -
Nearly 70% Of Americans Want Talks To End War In Ukraine
Political Issues: 13 hours ago, 4 flags -
Sunak spinning the sickness figures
Other Current Events: 13 hours ago, 4 flags -
Electrical tricks for saving money
Education and Media: 11 hours ago, 4 flags -
Late Night with the Devil - a really good unusual modern horror film.
Movies: 15 hours ago, 2 flags -
Any one suspicious of fever promotions events, major investor Goldman Sachs card only.
The Gray Area: 3 hours ago, 2 flags -
University of Texas Instantly Shuts Down Anti Israel Protests
Education and Media: 1 hours ago, 1 flags -
God's Righteousness is Greater than Our Wrath
Religion, Faith, And Theology: 8 hours ago, 0 flags
active topics
-
New whistleblower Jason Sands speaks on Twitter Spaces last night.
Aliens and UFOs • 57 • : baablacksheep1 -
Nearly 70% Of Americans Want Talks To End War In Ukraine
Political Issues • 45 • : FlyersFan -
HORRIBLE !! Russian Soldier Drinking Own Urine To Survive In Battle
World War Three • 39 • : crayzeed -
President BIDEN Vows to Make Americans Pay More Federal Taxes in 2025 - Political Suicide.
2024 Elections • 138 • : grey580 -
Sunak spinning the sickness figures
Other Current Events • 15 • : angelchemuel -
University of Texas Instantly Shuts Down Anti Israel Protests
Education and Media • 7 • : Threadbarer -
British TV Presenter Refuses To Use Guest's Preferred Pronouns
Education and Media • 147 • : Annee -
So this is what Hamas considers 'freedom fighting' ...
War On Terrorism • 260 • : network dude -
Hate makes for strange bedfellows
US Political Madness • 43 • : network dude -
Any one suspicious of fever promotions events, major investor Goldman Sachs card only.
The Gray Area • 7 • : seekshelter