It looks like you're using an Ad Blocker.
Please white-list or disable AboveTopSecret.com in your ad-blocking tool.
Thank you.
Some features of ATS will be disabled while you continue to use an ad-blocker.

9/11 even real pilots couldn't do it
page: 44share:
Originally posted by trebor451
Perhaps you can give us a straight answer. If you could be so kind as to:
1) Plot on that chart exactly where UAL 175 was at the moment of impact.
Use the horizontal scroll bar on the bottom of this diagram and scroll to the right. Look at where it shows "510".

2) Let us all know that this chart represents precisely - to a knot - Boeing's flight test, wind tunnel and design test flight parameters and data points.
767 speeds -
Va/Vra - 290 - Maneuvering speed/Rough Air penetration speed, represented at the point where it says "Maneuvering speed" in the above V-G diagram.
Vmo - 360 - Max Structural Cruise/Max Operating, represented by the end of the "Normal Operating" Green zone and the start of the Caution zone in yellow.
Vd - 420 - Limit Dive speed, represented by the end of the flight envelope to the right and start of the "Structural Failure" red zone - for every aircraft on this planet.
Learn more here regarding V-Speed definitions and the composition of a V-G Diagram.
Illustrated Guide To Aerodynamics
APS Training, V-G Diagram Discussion, Clarke “Otter” McNeace, VP – Flight Operations, Aerobatic, Upset Recovery & Spin Training Instructor
Then, having done that, tell us how you know that since Boeing doesn't release such data.
Boeing 767 Type Certificate Data Sheet - A1NM (faa.gov pdf)
Thanks.
You're welcome. Hope it helps clear your confusion.
Originally posted by TiffanyInLA
Originally posted by trebor451
Perhaps you can give us a straight answer. If you could be so kind as to:
1) Plot on that chart exactly where UAL 175 was at the moment of impact.
Use the horizontal scroll bar on the bottom of this diagram and scroll to the right. Look at where it shows "510".
2) Let us all know that this chart represents precisely - to a knot - Boeing's flight test, wind tunnel and design test flight parameters and data points.
767 speeds -
Va/Vra - 290 - Maneuvering speed/Rough Air penetration speed, represented at the point where it says "Maneuvering speed" in the above V-G diagram.
Vmo - 360 - Max Structural Cruise/Max Operating, represented by the end of the "Normal Operating" Green zone and the start of the Caution zone in yellow.
Vd - 420 - Limit Dive speed, represented by the end of the flight envelope to the right and start of the "Structural Failure" red zone - for every aircraft on this planet.
Learn more here regarding V-Speed definitions and the composition of a V-G Diagram.
Illustrated Guide To Aerodynamics
APS Training, V-G Diagram Discussion, Clarke “Otter” McNeace, VP – Flight Operations, Aerobatic, Upset Recovery & Spin Training Instructor
Then, having done that, tell us how you know that since Boeing doesn't release such data.
Boeing 767 Type Certificate Data Sheet - A1NM (faa.gov pdf)
Thanks.
You're welcome. Hope it helps clear your confusion.
It sure helps...not...
Your continued re-posting of your Na na na post (can't think of a better way to describe it) doesn't really help in anyway, but then you do pull people into your fantasy, and maybe impress them to a point... but anyhow lets look at this.
You display this like it is some kind of shield (or proof positive) but fail to say that at 421 EAS the plane would come apart as your chart suggests, so lets really look at this chart. Is this chart based on EAS at sea level as you suggest.. I do not know, and since it explains nothing I'm not sure you know either...well I guess you don't care since it has been posted 30 or 40 times? The reason I ask this is because a real chart looks something like this.
I scanned this from one of my flight books and as you can see it tells the alt, airplane, engine, whether it was flight tested or estimated with math...lots of info there so everything that one may need to know of what the chart is actually based on is rigjht there....unlike yours....Are you starting to understand my point in this that I have talked about in many posts?
So do you and the few others want to bet everything that 421 EAS (we are guessing here since the chart says IAS) that the plane comes apart?
So does the plane come apart at 421 or not? That is the question, and if not what safety factor is designed into it? I have a hard time believing that at 419 we are in the caution range and at 421 the plane disintegrates, so this means, as all charts, there is a safety facter build in. The minimum is 10% so that pilots do not go 1 knot out of caution and the plane brakes up. With that said, if we add 10% that would put the real number at 463ish EAS, and that is if, and a big "IF", this chart is based on sea level to align up speeds with EAS as what seems to be your main point for 40 pages, but we just do not know do we?
But anyhow, 461 EAS would be 537 MPH at 700 feet alt (I'm using MPH since that is what most reports use for the layman.)
15% safety would be 484ish EAS or 563 MPH at 700 feet alt.
20% and we would have 503 EAS or 585 MPH at 700 feet alt.
Your 510 EAS is 593 MPH at 700 feet alt, so is that the MPH the official report is saying, or are you just pulling numbers out of your....thin air to make your point?
You seem to base your whole theory on speed so just what speed is it that the plane will reach "structural failure" and what are we talking about when you say structural failure? Your never ending re-posting of Vmo +150 just means nothing at all, even though you seem to generate believers on that alone, so PLEASE post the speed that the aircraft WILL fail in MPH so that all can get an idea what you are talking about. Switching between speeds is confusing for many and to put it all into one speed that the plane would be impossible to reach at 700 alt would really help.
Since you have backed many links with some even saying the plane with fail at 220 MPH I think it is time for you to post this unreachable speed.
edit on 14-9-2010 by Xtrozero because: grammer
Originally posted by TiffanyInLA
You're welcome. Hope it helps clear your confusion.
Thanks, Tiff. One of the points I was making, however, is that your chart is not a Boeing-produced product. Would you agree? If you could state for the record that indeed, the specific diagram you have posted 20+ times in this thread is a "Tiffany"/Captain Bob Balsamo-produced product and not a Boeing Aircraft Corporation-produced product, we would all appreciate it to establish where you get your data from.
Can you produce the Boeing test flight data, wind tunnel data/analysis and design specifications from the 767 program that would lend any sort of legitimacy to your home-made diagram? Captain Bob Balsamo himself said that "Boeing needs to release wind tunnel data for the Boeing 767." Without that sort of data, specifically demanded by Captain Bob Balsamo, leader of the Pilots club, your presentation is really no more than the speculation of a club with an axe to grind.
trebor/xtrozero,
You are completely confused.
The chart you posted is a Specific Range Chart.
Specific range is the distance an aircraft travels per unit of fuel consumed.
The diagram I posted is a V-G Diagram.
A V-G diagram/Flight Envelope is an illustration of the V-Speeds vs. G loading.
Look at the bottom of your chart. It is given in True Airspeed. Look at the bottom of mine, it is given in Indicated.
Instead of wasting your time writing irrelevant convoluted walls of text, your time will be better spent reviewing the source links I provided for you. Specifically page 151 in the above "Illustrated Guide To Aerodynamics".
If you are still confused, call your local flight school and schedule a lesson.
edit on 14-9-2010 by TiffanyInLA because: (no reason given)
Originally posted by Xtrozero
Originally posted by TiffanyInLA
Originally posted by trebor451
Perhaps you can give us a straight answer. If you could be so kind as to:
as all charts, there is a safety facter build in. The minimum is 10% so that pilots do not go 1 knot out of caution and the plane brakes up.
Please quote the regulatory authority for factoring in a minimum 10% "safety factor" in the certification of speeds for airframes. I'll make it easier for you but you still won't find it. It doesn't exist. Air Transport Category aircraft are now certified under Part 25 of the Federal Aviation Regulations. You will find those in Part 14 of the Code of Federal Regulations. You might be confused about the differences between maximum "design load factor" and "ultimate load factors that are required parts of wing loading certification testing for Part 25 (and old CAR 23 testing) and which are accomplished by destructive testing. They actually put a wing in a jig with hydraulic presses and apply loads to the point where structural failure occurs. They bend it until it breaks, usually with great drama and much noise. But that is wing loading and not speed certification. Redline is redline. It ain't pinkline or suggested "whoa"-line. All sorts of bad things begin to happen there. Control surface rigidity can become wholly inadequate. The center of lift moves toward the back of the bus. It doesn't want to be the first thing to hit the ground. Ailerons can quit working, or even worse, start working backwards.
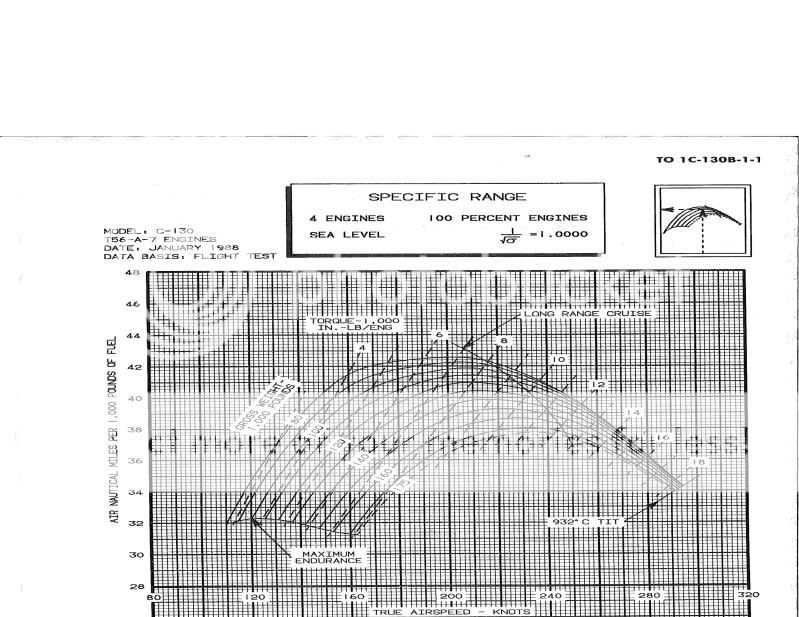
And about that specific fuel "chart." It is not for any certificated aircraft. It is for the early Lockheed C-130B. There is no type certificate data sheet for that aircraft. Lockheed did certificate the L-100, which was a very unpopular civilianized version of the C-130E, with totally different engines, the dash 7A instead of the T-56 - 7.
Originally posted by TiffanyInLA
trebor/xtrozero,
You are completely confused.
The chart you posted is a Specific Range Chart.
No I understand that...and that was not my point. EVERY chart I have (100s of pages) explain what the chart is based on, as in alt, airplane, engine, whether it is based on actual flight tests or just math formulas etc. To base your whole side of this discussion on what you have posted over and over without actually endorsing that speed I just see it not really explaining much of anything.
This was my first point and my chart was used in a generic way to show what a chart actually looks like and what kind of data charts show to make them usable.
My second point was I need you to define the speed in MPH that the aircraft could not reach so we can compare it to what the official report suggests, and I need you to back that speed… I have already asked you to endorse 421 EAS and you duck and weave from it though you plaster you chart every other postings. So what is it?
reply to post by 4nsicphd
Not in all airplanes/airframes/control surface installations:
I know to what you are referring....and I've covered this before vis-a-vis the B-767 in particular. Outboard (mounted well close to tips) ailerons, in situations with an insufficient structural rigidity in the wings, CAN lead to the aileron 'reversal' phenomenon. I am not aware of ALL large jets in history, but think I've heard it was particularly troublesome for the B-58.
Any "blanking" of ailerons, or disruptions in laminar flows, and thus loss of function at higher speeds? Again, lacking the wind-tunnel data from Boeing, we are in the dark there.
However, it's not an issue in the B-767 (outboard aileron 'reversal') because the outboards don't operate with the trailing edge flaps retracted --- only the INBOARDS (and of course, in conjunction with the spoilers). And I have doubts as to any "ineffectiveness" issues developing with the spoilers --- do you?
Now.....with all the distractions from the brightly colored charts, the entire point of the OP has been lost. It's like "John Locke" controls the 'smoke monster'....
What it started out with was, ONE (at most, along with a small handful) of guys, this guy from Scandinavia, as I recall, making spurious claims. (Reason: Unknown). THIS, despite the HUGE numbers of airline pilots all over the World who, no doubt, have had occasions, if desired, to actually do it in the Sims, to see for themselves. I don't see THEM beating down any doors to "join" a little (another small handful) of "pilots" on some Internet site promising "truth" (yet, missing that target at each turn....IE, the AAL 77 "Flight Deck Door" fiasco. Have they corrected that error, yet??)
IN fact, is there ANY alternate "theory" put forth by those "truth" mongers? I mean, one that fits ALL of the facts, not cherry-picked selections?
What we DO know (and seems, at least, to not be in dispute amongst aforementioned "truth" seekers) is: An airplane each hit one of the Twin Towers. I do not see "them" arguing against the reality of AAL 11. What is apparent is some mis-guided (yet nebulous) assertion about UAL 175 --- an assertion yet to be pinned down in clear and concise terms ----- as mentioned above, with a viable alternative theory to account for the event. What I have seen are vague allusions about the airplane that was seen....that is was "modified", or some such. Still, that is it! Dangling allegations, with no actual substance.
(AND, to distract from that glaring lack of cogent explanation, this spectacle we have seen for the last - nearly infinite - number of pages).
What I have shown is a video of personal recollections of ATC personnel involved specifically with AAL 11 and UAL 175 that morning...at least those in the various ARTCC sectors. What is most interesting is, the particular fact that UAL 175's transponder, rather than being selected to 'STBY', instead merely had its squawk changed. This was fortunate, since it resulted in the airplane being somewhat easier to track (although code changed several times) AND Mode C data too. Lacking from primary targets.
So, there is a pretty solid and unassailable timeline for UAL 175, even better than AAL 11's. In terms of the ability to monitor its progress. (Of course, if I recall, there were instances of confusion, since it would pass through various ARTCC sectors, both High and Low, each with different tracking ranges available. Still, it seems it was easy enough to re-acquire, as it was the only errant NORDO in the vicinity.
I think, in balance, the lack of practical experience is glaring, from the "PfT" camp, in terms of real-world knowledge and use of the ATC system. This works to their advantage, though, with the lay public, who truly are in the dark, about most of the details and intricate workings. Heck, I don't know it all, about ATC...not from inside a controller's shoes, anyway. Only what one picks up over the years, both from occasionally chatting with them (back before 9/11, when they'd ride the jump-seat as part of their 'familiarization rides"...and to go somewhere for free, on vacation!), and just from using the system as an aviator.
Not in all airplanes/airframes/control surface installations:
Ailerons can quit working, or even worse, start working backwards.
I know to what you are referring....and I've covered this before vis-a-vis the B-767 in particular. Outboard (mounted well close to tips) ailerons, in situations with an insufficient structural rigidity in the wings, CAN lead to the aileron 'reversal' phenomenon. I am not aware of ALL large jets in history, but think I've heard it was particularly troublesome for the B-58.
Any "blanking" of ailerons, or disruptions in laminar flows, and thus loss of function at higher speeds? Again, lacking the wind-tunnel data from Boeing, we are in the dark there.
However, it's not an issue in the B-767 (outboard aileron 'reversal') because the outboards don't operate with the trailing edge flaps retracted --- only the INBOARDS (and of course, in conjunction with the spoilers). And I have doubts as to any "ineffectiveness" issues developing with the spoilers --- do you?
Now.....with all the distractions from the brightly colored charts, the entire point of the OP has been lost. It's like "John Locke" controls the 'smoke monster'....
What it started out with was, ONE (at most, along with a small handful) of guys, this guy from Scandinavia, as I recall, making spurious claims. (Reason: Unknown). THIS, despite the HUGE numbers of airline pilots all over the World who, no doubt, have had occasions, if desired, to actually do it in the Sims, to see for themselves. I don't see THEM beating down any doors to "join" a little (another small handful) of "pilots" on some Internet site promising "truth" (yet, missing that target at each turn....IE, the AAL 77 "Flight Deck Door" fiasco. Have they corrected that error, yet??)
IN fact, is there ANY alternate "theory" put forth by those "truth" mongers? I mean, one that fits ALL of the facts, not cherry-picked selections?
What we DO know (and seems, at least, to not be in dispute amongst aforementioned "truth" seekers) is: An airplane each hit one of the Twin Towers. I do not see "them" arguing against the reality of AAL 11. What is apparent is some mis-guided (yet nebulous) assertion about UAL 175 --- an assertion yet to be pinned down in clear and concise terms ----- as mentioned above, with a viable alternative theory to account for the event. What I have seen are vague allusions about the airplane that was seen....that is was "modified", or some such. Still, that is it! Dangling allegations, with no actual substance.
(AND, to distract from that glaring lack of cogent explanation, this spectacle we have seen for the last - nearly infinite - number of pages).
What I have shown is a video of personal recollections of ATC personnel involved specifically with AAL 11 and UAL 175 that morning...at least those in the various ARTCC sectors. What is most interesting is, the particular fact that UAL 175's transponder, rather than being selected to 'STBY', instead merely had its squawk changed. This was fortunate, since it resulted in the airplane being somewhat easier to track (although code changed several times) AND Mode C data too. Lacking from primary targets.
So, there is a pretty solid and unassailable timeline for UAL 175, even better than AAL 11's. In terms of the ability to monitor its progress. (Of course, if I recall, there were instances of confusion, since it would pass through various ARTCC sectors, both High and Low, each with different tracking ranges available. Still, it seems it was easy enough to re-acquire, as it was the only errant NORDO in the vicinity.
I think, in balance, the lack of practical experience is glaring, from the "PfT" camp, in terms of real-world knowledge and use of the ATC system. This works to their advantage, though, with the lay public, who truly are in the dark, about most of the details and intricate workings. Heck, I don't know it all, about ATC...not from inside a controller's shoes, anyway. Only what one picks up over the years, both from occasionally chatting with them (back before 9/11, when they'd ride the jump-seat as part of their 'familiarization rides"...and to go somewhere for free, on vacation!), and just from using the system as an aviator.
Tiffany
Use the horizontal scroll bar on the bottom of this diagram and scroll to the right. Look at where it shows "510".
I scrolled over and looked at bar at the bottom of your diagram but I am still confused. Since your Vg chart obviously uses Standard Aeronautical Variable Value Units (SAVVU) to measure speed, could we not move the 510 knots over to here and vary the value of each variable unit to equal 510 knots at that point and have a Vg chart equally valid to yours?

I talked to my local flight instructor, he was not familiar with any graphs using Standard Aeronautical Variable Value Units. Can you please help,
Originally posted by 4nsicphd
Redline is redline.
So a 767 comes a part at 421 but is ok at 420...right? The only charts that I have seen that safety factors are not built in are engine temperature based charts, so please in MPH tell me the speed that a 767 will structurally fail to the point it will not fly.
That is all I’m asking you guys…it should not be hard to do..
And about that specific fuel "chart." It is not for any certificated aircraft. It is for the early Lockheed C-130B. There is no type certificate data sheet for that aircraft. Lockheed did certificate the L-100, which was a very unpopular civilianized version of the C-130E, with totally different engines, the dash 7A instead of the T-56 - 7.
Actually it is a C-130E and do you mean NMPP range chart as "fuel chart"? Its an aircraft and the point was using the chart generically to show what a real usable chart looks like. Who cares if it is spec range or a C-130E....
As I said above EVERY chart I have has a legend explaining what the chart is based on.
I'm not using it for anything other than to show how invalid that speed chart is, that has been posted 50 times.
Come on guys give me the speed that the 767 at 700 feet will breakup and stop deflecting the question. Since I asked this over and over I guess you do not know as I figured and so how can you support anything you say?
edit on 14-9-2010 by Xtrozero because: quotes
reply to post by Xtrozero
Well, I instantly recognized that you used a chart selected at random, just for demonstration purposes, as you just had to tell everyone.
(It reminded me too much of those same pesky type charts form the ATP and FE writtens!!)
Here, I thought I posted other examples of the various methods the ACTUAL manufacturer uses to compile charts....in this case, a B-747-400 (it was top on a quick Google search, and serves well to illustrate):
www.boeing.com...
Of course, in real world, each operator has some sort of computerized system (that of course relies on this data, and other data supplied from manufacturer) to meet all legal requirements, in terms of Dispatch, takeoff/landing limits, temperatures, altitudes, weights, CG, etc. It varies from company to company, and long gone are the days when you had to sit there at the pad and wait for "the numbers" to be read to you over the radio. Now we have the direct uplinks, printers, all sorts of improvements. (Depending, again....on what technology the company buys).....
Originally posted by waypastvne
I talked to my local flight instructor, he was not familiar with any graphs using Standard Aeronautical Variable Value Units. Can you please help,
I made this point awhile back and it was ignored. It was after I was trying to interpolate it and Tiffney told me I could not read a chart, or something close to that. That is also why I posted a real chart as an example.
reply to post by Doctor G
Here is the evidence, watch this, hopefully you will find the truth...
www.youtube.com...
Here is the evidence, watch this, hopefully you will find the truth...
www.youtube.com...
Originally posted by weedwhacker
reply to post by Xtrozero
Well, I instantly recognized that you used a chart selected at random, just for demonstration purposes, as you just had to tell everyone.
(It reminded me too much of those same pesky type charts form the ATP and FE writtens!!)
It just seems that every point made in a post is completely over looked/ignored and replies are focused towards totally trivial parts of a post. Like my chart….This has been their SOP from the get go.
Well in the Air Force they still use those charts for many airplanes. ;p
reply to post by cleveract
THAT is your "evidence"??
That nutjob Zakir Naik?? The Muslim "televangelist"???
Is he "also" a pilot?
:shk:
Only one appropriate reply, one would think, to that. Time to trot out the other Captain:
[atsimg]http://files.abovetopsecret.com/images/member/bd2c6f45dfae.jpg[/atsimg]
(That makes Jean Luc sad.....)
edit on 14 September 2010 by weedwhacker because: Text
Xtrozero-
If you wish to compare apples to apples, pull the V-G diagram from your C-130 manual. Where does the diagram end?
For a hint, click the source link to the "Illustrated Guide To Aerodynamics" I provided for you, as every aircraft on this planet has the same exact end point on the V-G diagram where the Structural Failure zone begins - Vd.
Weedwhacker, it is you who has no practical experience as you STILL don't understand a V-G diagram can be plotted if the V-speeds are known.
Please let us know when you are going to inform all the flight schools of the world and the authors of books on Aerodynamics that they have it all wrong. Start with wiki-
en.wikipedia.org...
The score still remains now after FOURTY-FOUR pages -
Evidence for my argument (Reported speeds/control "impossible", "improbable", "The Elephant In The Room") -
Data - NTSB, Boeing, Limits set by the manufacturer based on flight/wind tunnel testing
Precedent - EA990, China Airlines 747SP, TWA 727, 737, Modified DC-8, all suffered in flight structural failure, crash and/or lost control and needed 10's of thousand of feet to recover, or was modified to exceed it's manufacturer's set limits.
Numerous verified experts - (Many posted in this thread - www.abovetopsecret.com...)
Evidence for the argument of those who blindly support the OS (It is easy to control an aircraft at Vmo+150) -
"Because the govt told me so..."
Data = 0
Precedent = 0
Verified Experts = 0
Again -
Please let us know when you find one verified pilot willing to support your claims that it is "easy" to control a 767 at Vmo+150, Va+220 --and pull G's-- for a pilot with less experience than one who couldn't control a 172 at 65 knots. Please let us also know when you have any type of evidence for your argument other than assumption or "Because the govt told me so..."
Originally posted by TiffanyInLA
Xtrozero-
If you wish to compare apples to apples, pull the V-G diagram from your C-130 manual. Where does the diagram end?
Boy, you are just totally missing the point, (as always) I'm not comparing a C-130 to a 767...geez
BTW there isn't a V-G diagram for a C-130.
I think weedwhacker's last point is a good final point for me that I'm sure you missed that one too.
edit on 14-9-2010 by Xtrozero because: spelling
Originally posted by Xtrozero
BTW there isn't a V-G diagram for a C-130.
Figure 6 shows both a graphic and a tabular representation of weighted
C-130A data to depict the number of maneuver load factor occurrences within
increments of load factor values and ranges of equivalent airspeed. Extracted
from Reference 3, the V-n envelope shown in the figure indicates the C-130A
Source - Structural Flight Loads - C130 Aircraft (dtic.mil pdf 255 pages)
From Page 18 -

EVERY Fixed wing aircraft has a V-G/V-n/Flight Envelope.
You would know this Xtrozero if you clicked the link to the above "Illustrated Guide To Aerodynamics".
edit on 14-9-2010 by TiffanyInLA because: Fixed tags
Originally posted by weedwhacker
reply to post by cleveract
THAT is your "evidence"??
That nutjob Zakir Naik?? The Muslim "televangelist"???
Is he "also" a pilot?
:shk:
Only one appropriate reply, one would think, to that. Time to trot out the other Captain:
[atsimg]http://files.abovetopsecret.com/images/member/bd2c6f45dfae.jpg[/atsimg]
(That makes Jean Luc sad.....)
edit on 14 September 2010 by weedwhacker because: Text
He quotes from people who knows about the situation and have studied it clearly... scientists, proffessors and so on. Around the US...
And he is not a nutjob, he is a really smart man, he is a quoting machine... He have even debated against many people and what i have seen is from my perception, is that he is always winning in the debate....
Originally posted by cleveract
He quotes from people who knows about the situation and have studied it clearly... scientists, proffessors and so on. Around the US...
And he is not a nutjob, he is a really smart man, he is a quoting machine... He have even debated against many people and what i have seen is from my perception, is that he is always winning in the debate....
If he is debating "proffessors", no wonder he is winning.
Nutjob is probably too kind a word and that is an insult to nuts all over the place.
reply to post by TiffanyInLA
Incorrect. You twist words and meaning, continually.
I've already (repeatedly) pointed out that the relationships to flight loads (g's) and the various curves follow relationships that are predictable.
What YOU keep avoiding (by distracting this Board with inanity) are two things:
[b[Gross weight difference
And, That the V-g diagram is IRRELEVANT in this instance.
It is wielded like a club, by the "club", with intent to "impress" those in the lay audience who apparently worship at the feet of the so-called "Pilots" in that "club". Those who seem easily impressed by stated qualifications.
Although, regarding qualifications, some may recall this old joke ---
"What do you call the medical student who graduated from the bottom of his class?" ---- Answer: "Doctor".
Back to GW. Why is it being ignored, each time I bring it up? You DO understand the relationship between weight and stall speeds and Va, right? (You can read about it in your book learning, or just Google. As usual).
Therefore, a V-g diagram, in terms of the sloped lines where it graphs stall speeds is specific to a certain weight, and the speeds vary. SO, in that sense, your V-g diagram has to have a defined gross weight (usually, for small airplanes, in General Aviation, say, it is the maximum allowed GW. Just to keep it simple).
With the extremely wide flight envelopes in Transport Category jets, a "simple" V-g diagram isn't practical. We use OTHER parameters as limits, in everyday flying and procedures, to remain well within safety margins. That is, UNLESS we are a terrorist hijacker intent on a suicide/destruction mission. But, thankfully there aren't that many of those.
And your V-g diagram is mostly used to educate student pilots --- I can see it's practical applications for aerobatics as well. However, it isn't something that we memorize. Specific speeds, yes....but not the graph, like it's in our heads at every moment...nor is it needed, ever, for reference in normal operations.
Again...it is "eyewash" and distraction, a tactic well-known to be in use by that band of jokers (**) who seem to just be stabbing in the dark, at every turn, in order to save what little face they have left.
BUT...how is ANY of the above relevant to UAL 175? Answer: None.
The ONLY parameter seen to have been exceeded by that airplane was the "redline". It did NOT experience any significant g-loads above the normal ONE G. Even in the shallow level-out near the end, and even IF combined with the turn just prior to impact, it is STILL well less than TWO Gs.
Look at your diagram....plot the TWO G line, see where it falls within that envelope. So, again, the only parameter exceeded was velocity. AND, unless you (or anyone else) wishes to come right out and pin your reputation on saying that the airplane will "fall from the sky immediately" when exceeding (in this case, 420 Knots), then the diagram is of no further use in these discussions.
Furthermore, there ARE instances of "redline" exceedance in Transport Category airplanes, with satisfactory and safe returns to the ground. As long was there weren't any g-loads or excessive control inputs, during those extreme speed excursions, that resulted in significant structural compromise. AND, since Mach number is the primary limiting "speed" for jets, it is also easy enough to calculate the maximum estimated Mach speed for UAL 175, that morning. As I recall, it was somewhere around M.77 A very typical cruise Mach for the airplane.
(Depending on what you ask the computer to calculate, and your weight, and known winds....there are several scenarios to choose from, in the FMC. "ECON", "LRC" are just two....and will usually present a Mach speed between M.76 to M.78 or .79 Of course, one can also select a Mach speed of choice, input it, and the computer will then calculate ETA, fuel at destination, etc. Of course, in reality, it is usually ever-changing, what with ATC requirements and such. On those trips when we were on last leg, and need to catch a commuting flight home, we'll often plug in M.82 or .83 As long as ATC didn't hold us down slower. Uses a bit more fuel, sometimes....but, priorities depend on personal preference, often. Of course, safety is always paramount!).
(**) Speaking of "jokers"....does that "Pilots' club" still stand by, and refer to a certain Captain's credentials?? I noticed his name was absent from the others who were thrown up on the Board several times, in prior posts.
You know the one I'm talking about?? That practical joker extraordinaire? (Because, with all his experience, it could only have been his way of pulling people's legs...) What's his name....? (Father was famous, on top of many things invented the "Lear Jet". The son is also famous, in his own right....eventually).....
Still, in the long tradition of a good practical joke, (a common trait amongst aviators, often) and story teller, he remains up there near the top. Guess the "Pilots' club" doesn't fancy his stories of "holographic airliners" and "space-based weapons", huh???
Incorrect. You twist words and meaning, continually.
Weedwhacker, it is you who has no practical experience as you STILL don't understand a V-G diagram can be plotted if the V-speeds are known.
I've already (repeatedly) pointed out that the relationships to flight loads (g's) and the various curves follow relationships that are predictable.
What YOU keep avoiding (by distracting this Board with inanity) are two things:
[b[Gross weight difference
And, That the V-g diagram is IRRELEVANT in this instance.
It is wielded like a club, by the "club", with intent to "impress" those in the lay audience who apparently worship at the feet of the so-called "Pilots" in that "club". Those who seem easily impressed by stated qualifications.
Although, regarding qualifications, some may recall this old joke ---
"What do you call the medical student who graduated from the bottom of his class?" ---- Answer: "Doctor".
Back to GW. Why is it being ignored, each time I bring it up? You DO understand the relationship between weight and stall speeds and Va, right? (You can read about it in your book learning, or just Google. As usual).
Therefore, a V-g diagram, in terms of the sloped lines where it graphs stall speeds is specific to a certain weight, and the speeds vary. SO, in that sense, your V-g diagram has to have a defined gross weight (usually, for small airplanes, in General Aviation, say, it is the maximum allowed GW. Just to keep it simple).
With the extremely wide flight envelopes in Transport Category jets, a "simple" V-g diagram isn't practical. We use OTHER parameters as limits, in everyday flying and procedures, to remain well within safety margins. That is, UNLESS we are a terrorist hijacker intent on a suicide/destruction mission. But, thankfully there aren't that many of those.
And your V-g diagram is mostly used to educate student pilots --- I can see it's practical applications for aerobatics as well. However, it isn't something that we memorize. Specific speeds, yes....but not the graph, like it's in our heads at every moment...nor is it needed, ever, for reference in normal operations.
Again...it is "eyewash" and distraction, a tactic well-known to be in use by that band of jokers (**) who seem to just be stabbing in the dark, at every turn, in order to save what little face they have left.
BUT...how is ANY of the above relevant to UAL 175? Answer: None.
The ONLY parameter seen to have been exceeded by that airplane was the "redline". It did NOT experience any significant g-loads above the normal ONE G. Even in the shallow level-out near the end, and even IF combined with the turn just prior to impact, it is STILL well less than TWO Gs.
Look at your diagram....plot the TWO G line, see where it falls within that envelope. So, again, the only parameter exceeded was velocity. AND, unless you (or anyone else) wishes to come right out and pin your reputation on saying that the airplane will "fall from the sky immediately" when exceeding (in this case, 420 Knots), then the diagram is of no further use in these discussions.
Furthermore, there ARE instances of "redline" exceedance in Transport Category airplanes, with satisfactory and safe returns to the ground. As long was there weren't any g-loads or excessive control inputs, during those extreme speed excursions, that resulted in significant structural compromise. AND, since Mach number is the primary limiting "speed" for jets, it is also easy enough to calculate the maximum estimated Mach speed for UAL 175, that morning. As I recall, it was somewhere around M.77 A very typical cruise Mach for the airplane.
(Depending on what you ask the computer to calculate, and your weight, and known winds....there are several scenarios to choose from, in the FMC. "ECON", "LRC" are just two....and will usually present a Mach speed between M.76 to M.78 or .79 Of course, one can also select a Mach speed of choice, input it, and the computer will then calculate ETA, fuel at destination, etc. Of course, in reality, it is usually ever-changing, what with ATC requirements and such. On those trips when we were on last leg, and need to catch a commuting flight home, we'll often plug in M.82 or .83 As long as ATC didn't hold us down slower. Uses a bit more fuel, sometimes....but, priorities depend on personal preference, often. Of course, safety is always paramount!).
(**) Speaking of "jokers"....does that "Pilots' club" still stand by, and refer to a certain Captain's credentials?? I noticed his name was absent from the others who were thrown up on the Board several times, in prior posts.
You know the one I'm talking about?? That practical joker extraordinaire? (Because, with all his experience, it could only have been his way of pulling people's legs...) What's his name....? (Father was famous, on top of many things invented the "Lear Jet". The son is also famous, in his own right....eventually).....
Still, in the long tradition of a good practical joke, (a common trait amongst aviators, often) and story teller, he remains up there near the top. Guess the "Pilots' club" doesn't fancy his stories of "holographic airliners" and "space-based weapons", huh???
new topics
-
How does my computer know
Education and Media: 1 hours ago -
USO 10 miles west of caladesi island, Clearwater beach Florida
Aliens and UFOs: 5 hours ago
top topics
-
Anti-Israel Protesters in CHICAGO Chant 'Death to Israel and 'Death to America'
Social Issues and Civil Unrest: 17 hours ago, 15 flags -
Running Through Idiot Protestors Who Block The Road
Rant: 16 hours ago, 12 flags -
Tesla cutting 14,000 jobs
Global Meltdown: 14 hours ago, 6 flags -
Israel ufo shoot down drones?
Aliens and UFOs: 14 hours ago, 6 flags -
USO 10 miles west of caladesi island, Clearwater beach Florida
Aliens and UFOs: 5 hours ago, 6 flags -
Abortions in first 12 weeks should be legalised in Germany, commission says
Medical Issues & Conspiracies: 14 hours ago, 5 flags -
On this Day in History, April 15, 1865, Abraham Lincoln Passed Away.
General Chit Chat: 14 hours ago, 4 flags -
How does my computer know
Education and Media: 1 hours ago, 0 flags
active topics
-
Abortions in first 12 weeks should be legalised in Germany, commission says
Medical Issues & Conspiracies • 10 • : Freeborn -
President BIDEN Warned IRAN Not to Attack ISRAEL - Iran Responded with a Military Attack on Israel.
World War Three • 38 • : TinfoilTophat -
How does my computer know
Education and Media • 1 • : UpIsNowDown2 -
Canadian Police Urge Citizens To Avoid Conflict With Armed Robbers By Leaving Keys At Front Door
Social Issues and Civil Unrest • 68 • : Astyanax -
Gold and silver prices....woo hoo
History • 71 • : SchrodingersRat -
Afterlife, unknown, so prepare, or just go into the unknown (bad)!!
ATS Skunk Works • 49 • : Kennyb75 -
Fossils in Greece Suggest Human Ancestors Evolved in Europe, Not Africa
Origins and Creationism • 46 • : matafuchs -
America's Infant Mortality Rate Increases for the First Time in 20 Years
Medical Issues & Conspiracies • 17 • : nugget1 -
Mandela Effect - It Happened to Me!
The Gray Area • 98 • : BeTheGoddess2 -
The Truth About Jesus
Conspiracies in Religions • 265 • : glend