It looks like you're using an Ad Blocker.
Please white-list or disable AboveTopSecret.com in your ad-blocking tool.
Thank you.
Some features of ATS will be disabled while you continue to use an ad-blocker.

What might really be happening in Washington State?
page: 41share:
WC,
Another friendly Washintonian here with an interest in the subduction zone.
Let me link the map that I wish to discuss. Sorry if the full link shows in the thread, its pretty lengthy
EDIT: Drat, the full link didnt work. Basically I zoomed all the way into the 7.7 area and chose 7 days all events.
earthquake.usgs.gov...:
What I am seeing, is that the main shock happened on the north end of the "tear" but all of the subsequent shocks have moved southwards. If you imagine a sheet that you flip when you are making a bed, and the "wave" that it makes as it rolls along, this is how I envision what is happening to the ground that causes these aftershocks. If you carry that analogy a little further, you can see where that "wave" moving in a southerly direction on the subduction zone, would put ALOT of added stress on the northern edge of the CSZ, which is right where we DONT want it to be.
Also, the strike slip fault that the main shock happened on runs in a E-W direction through the middle of QCI. It happens to bisect the subduction fault, which leads to alot of confusion about the types of quakes in this area. It seems that they have established that this was from the QCI fault, not the subduction fault. But all of the aftershocks appear to be on the subduction fault. The subduction fault runs unbroken all the way to the Aleutians from what I have been able to determine.
Here is a website that might help with the visualization.
www.earthquakescanada.nrcan.gc.ca...
Notice how there are ALOT of smaller eq's working down the CZ towards us? And I have been noticing that our CZ area has been very quiet over the past few months....
What are your thoughts?
Danno
edit on 11/2/2012 by MoparDanno because: Link no worky right
I think the m7.7 in British Columbia may be showing some effects farther south, specifically into the Olympic Pennisula and surrounding
environs. Check out this GPS plot of the vertical direction at the NEAH station:

Doesn't this pic say the ground at this location has moved down over 20 mm (millimeters) in just 5 days?
Here is the NRCAN page where I found this data. You can find a link to a map of all the stations in the middle of this page, to orient yourself, but the page layout is north to south, west to east, which is helpful. The data looks to be current through October 31st.
If you change the view to "latitude" you will see that almost all of the stations in the array have been moving south about 5 mm. Click the "longitude" view and see that most of the stations have moved 10 mm west over the past 2 weeks .
The movement that I showed above at Neah, really sticks out to me--I don't see any other stations with as much movement in any direction.
What do you think?
edit on 11/2/2012 by Olivine because: (no reason given)
edit on 11/2/2012 by Olivine because: I obviously can't compose a
sentence
reply to post by Olivine
Now that is very intersting nice find there. Will have to look into that also.
Now that is very intersting nice find there. Will have to look into that also.
reply to post by MoparDanno
Well, that has been my concern. I think that the sudden rash of micro to moderate qukaes along the san andreas and a few here along our coast in washington are probably linked to the 7.7 and movement. I am a strong believer in yin-yang.
Olivine.....I suck at reading the GPS charts, but even I can tell that it looks like some significant movement there. I would think it is obvious there has been movement..question is, what does it mean?
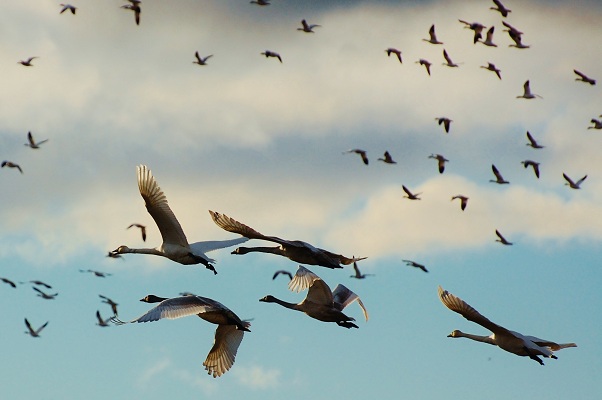
I haven't shared any pictures in awhile and I happened to be out on a walk this beautiful afternoon!
So...here is what I captured. Winter is here!

So...here is what I captured. Winter is here!
reply to post by westcoast
Last month, I was in Southport, England and the geese flew over on their travels. Beautiful sight as wave after wave of them flew over like
squadrons of bombers in formation.
There were 1000s of them and, as I watched, not a single other person even noticed.
There were 1000s of them and, as I watched, not a single other person even noticed.
reply to post by Kandinsky
Hmmmmm...you hit on something there. That's my goal with the pictures I take. To point out the beautiful things we miss all the time because we just don't look.
Hmmmmm...you hit on something there. That's my goal with the pictures I take. To point out the beautiful things we miss all the time because we just don't look.
Beautiful photo WC.
The Canada geese have been flying by here for the past few weeks. Every time I hear their honking I run outside to watch. Lovely.
reply to post by westcoast
I also suck at interpreting the GPS data. That's why I brought it here.
This is the best I can come up with. The latest ETS episode ended on Oct 12th. And the entire event was equal to a m6.5 earthquake (approximately).
Normally, the subducting plates are pushing northeast, moving the North American plate with it, becuase the interface between the two is locked together.
Maybe this southwest movement showing on the GPS is the very slow release of that m6.5 energy? A short-term relaxing of the strain, before the normal "push" from the subducting plates begins again?
Or, since the m7.7 QCI quake was a thrust mechanism event, could that allow for SW movement of the NA plate, adding more strain to the rocks below, at the plate interface?
That's all I've I got.
I wish John Vidale would swing by and give his input....(hint, hint, Sir)
edit on 11/3/2012 by Olivine because: rewrite
edit on
11/3/2012 by Olivine because: (no reason given)
reply to post by Olivine
Great site! Thank you for that.
From what I can see of it, it looks like in the past few months, ALL of the stations have been trending S and W at about 5mm per month in both directions. Also, ALL of the stations have "fallen" to some degree.
Do this thought game with me please. Imagine a piece of paper on a table. Laying flat. You put one hand on the table with your fingertips down, and push the edge of the paper into your fingertips gently. You will see the paper start to "bulge". This would represent the "pre 7.7" state of the N American plate. If you take the hand that is keeping the paper from moving, and release it, the paper edge moves forward. This would be the quake and aftershocks, releasing the tension in the plate. This would also explain the movement S and W, AND the drop in the stations altitudes.
My thought, is that this quake looks like it released any pressure on the northern part of the CSZ, BUT it is now "stuck" on another pressure point. Perhaps farther south, or maybe even up north somewhere. The only reliable thing that we can tell is that SOME stress has been relieved. But that doesn't mean that the "sticky point" isn't somewhere closer to home... IE Off the Washington coast, or even Oregon.
Danno
Originally posted by westcoast
reply to post by MoparDanno
Well, that has been my concern. I think that the sudden rash of micro to moderate qukaes along the san andreas and a few here along our coast in washington are probably linked to the 7.7 and movement. I am a strong believer in yin-yang.
From my observations, I agree with you. I believe that movement on one side/end of a plate, affects the whole plate in subtle ways. Maybe nothing significant, but certainly a "settling" effect takes plate across the whole plate, and even through the faultlines that the event happens on. This obviously becomes more pronounced as the size of quake grows. A 3.0 would not have the same effect as a 8.0, let alone a 9.0+. A 7.7 is moderately significant, and the future effects of it are still not known in my opinion.
Danno
reply to post by westcoast
Good. I imagine he is pretty busy.
BTW, check out the GPS movement from the Canadain ETS/GPS page now.
All of the SW movement I was commenting on has reversed. It looks like somewhere between Nov 2nd and 3rd the entire area started moving strongly back toward the north and east. That is the direction we would expect to see with continued "push" from the Juan de Fuca plate.
I wish I could see if last night's m6.3 shows any associated GPS movement, but we have to wait a day for the page to update.
edit on
11/8/2012 by Olivine because: ugh--spelling
And now a 6.3 W of Vancouver Island on the Juan de Fuca plate.
earthquake.usgs.gov...
So is this an unrelated event? An aftershock? Or is the pressure point continuing to move south? I dont sweat stuff below 5.9, but when they start getting into the 6's as individual "events", and it looks like there COULD be a connection with a prior event, I go Hmmmm.....
What do you guys think?
Danno
I just wanted to link this most recent blog post from the PNSN.
Six-year drought of large earthquakes in the PNW
It sounds like the m7.7 under Queen Charlotte Island is still quite the conundrum. The Canadians have set up additional instruments in the area that will hopefully shed more light on the faults involved.
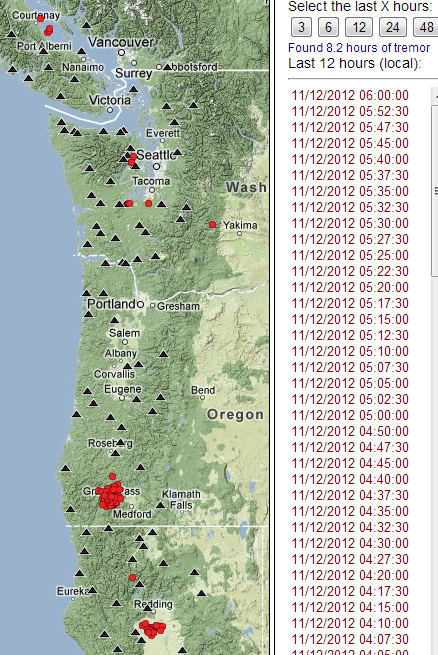
Oh yeah, over the past 10 days, the ETS (episodic tremor and slip, slow slip, silent earthquakes--whatever we want to call the phenomena) has quieted down. The activity has been light and sporadic, but in the past 12 hours or so, a new burst of activity is showing up, most highly concentrated around Grant's Pass, OR.
Here is a pic:
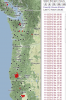 (click to enlarge)
Source
So, I'm just watching the area....
Six-year drought of large earthquakes in the PNW
It sounds like the m7.7 under Queen Charlotte Island is still quite the conundrum. The Canadians have set up additional instruments in the area that will hopefully shed more light on the faults involved.
Oh yeah, over the past 10 days, the ETS (episodic tremor and slip, slow slip, silent earthquakes--whatever we want to call the phenomena) has quieted down. The activity has been light and sporadic, but in the past 12 hours or so, a new burst of activity is showing up, most highly concentrated around Grant's Pass, OR.
Here is a pic:
 (click to enlarge)
 Source
So, I'm just watching the area....
edit on 11/12/2012 by Olivine because: (no reason given)
Just a follow-up to the ETS I spoke of in my prior post.
Yesterday
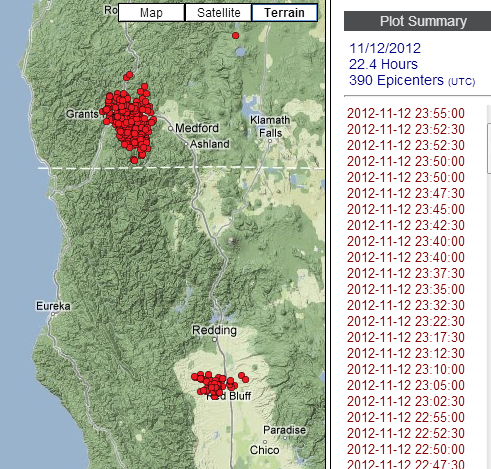
This burst seems to have calmed down just as quickly as it ramped up. Real-time tremor
Yesterday
This burst seems to have calmed down just as quickly as it ramped up. Real-time tremor
Originally posted by westcoast
I haven't shared any pictures in awhile and I happened to be out on a walk this beautiful afternoon!
So...here is what I captured. Winter is here!
WOW!!!! Just WOW!!!!
What a beautiful picture.
Thanks for sharing.
Geez....I feel bad for having been away for so long.
@olivine, I didn't get an answer to that last question....but I did just see this new article. Maybe you already saw this? It's most likely already posted in at least one other thread here on ATS, but I obviously am not around as much so I miss most things anymore.
Anyhow....I find it most interesting. It's about the deep tremors and how they are possibly a way to predict the next big one. I'll provide a link and some quotes:
Deep Earth Tremors May Foretell Major Earthquakes
This following quote really makes me wonder what they are thinking. It is very bold, coming from a geologist:
I have always felt this way whenever one of the 'events' is happening. I have also noticed a pattern between this tremors and other, larger quakes along our coast. I have talked about this on my other threads. I just think this statement is big. The implications behind it are very big. I have asked Mr. Vidale for his opinion in it.
Also....I don't want to read too much into this, and perhaps it is just a coincidental choice of words, but to refer to these tremors as a "hum" under us just rings true with my other speculations about the hum I have been reporting and recording for the past two years being connected to the tremors.
Since some of you enjoyed the Geese piture, here is another one I took a few weeks after that last one. I live in a beautiful place!!!
@olivine, I didn't get an answer to that last question....but I did just see this new article. Maybe you already saw this? It's most likely already posted in at least one other thread here on ATS, but I obviously am not around as much so I miss most things anymore.
Anyhow....I find it most interesting. It's about the deep tremors and how they are possibly a way to predict the next big one. I'll provide a link and some quotes:
Deep Earth Tremors May Foretell Major Earthquakes
This following quote really makes me wonder what they are thinking. It is very bold, coming from a geologist:
"You have these small events every 15 months or so, and a magnitude-9 earthquake every 500 years. We need to known whether you want to raise an alert every time one of these small events happens," Segall said in a statement.
I have always felt this way whenever one of the 'events' is happening. I have also noticed a pattern between this tremors and other, larger quakes along our coast. I have talked about this on my other threads. I just think this statement is big. The implications behind it are very big. I have asked Mr. Vidale for his opinion in it.
Also....I don't want to read too much into this, and perhaps it is just a coincidental choice of words, but to refer to these tremors as a "hum" under us just rings true with my other speculations about the hum I have been reporting and recording for the past two years being connected to the tremors.
The slow-slip earthquakes creep along the fault at about 4 mph (6.4 kph), for two weeks at a time. The tremors hum about 18 miles (30 km) below Earth's surface, deeper than the zone where big earthquakes rupture. Some scientists think the tremors are evidence of the sinking tectonic plate slowly dropping into the Earth, which may "load" the shallower, locked zone of the fault.
Since some of you enjoyed the Geese piture, here is another one I took a few weeks after that last one. I live in a beautiful place!!!
edit on 29-12-2012 by westcoast because: (no reason given)
Three small 1.5, 2.3 and a 1.7 at May Creek, Wa within 10 minutes. All pretty much in the same location.
USGS May Creek, WA
Ok....it has been way too long since I commented!
Sorry for the leave of absence, I was busy writing a book! (see sig line. )
I did some simple searching to see if the magma chamber theory had ever been expaned or further studied. It has been going on four years now since it was originally suggested. I didn't find a thing dated past 2009. I only found one follow-up article a few months later, that further examined the actual document. Basically, what the argument against this is....is that what this 'new' study is saying, is really not new. The suggested rate of 'melt' is 2-12%, which is what one might expect to find along a subducting zone. To go a step further and then call this area of melt a 'chamber' and saying that it is feeding the volcanos is where science and imagination seem to mix. SO...I am still on the fence with this. I have heard some very good comments against it over the past few years though. One thing that I DO still think connects it all are the deep tremors. I really think that the melt rate, or the state of the rocks (ie melt) is closely related to the deep tremors and how they move and what they mean. This would go along with the deep tremors only being found in subduction zones.
Anyways..thought I would give that little update!
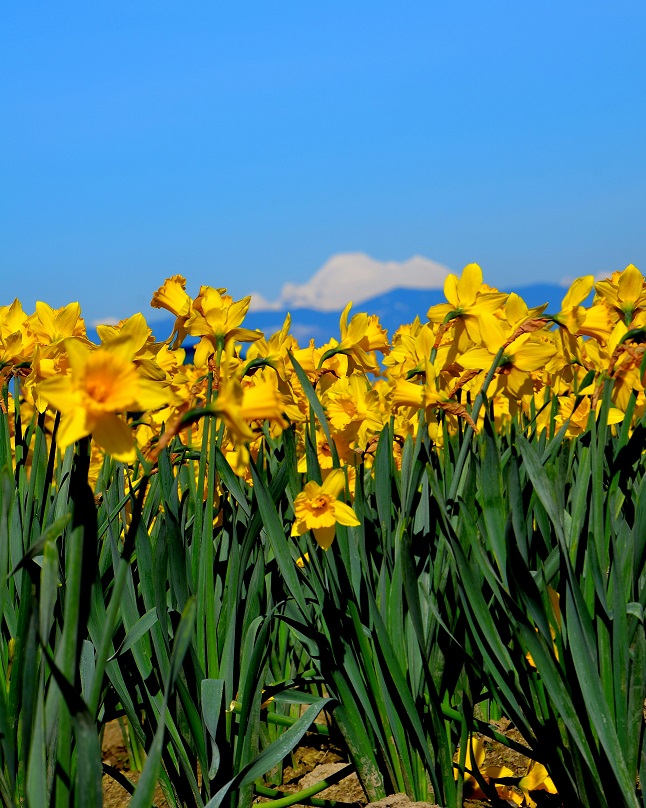
I also wanted to share a few more pictures with you. Several years ago, I went camping up near Baker Lake and came across this bridge that had the most dramatic view of a Mount Baker (or any mountain!) that I had EVER seen. Ever since then, I had been wanting to take a drive up there on a clear day to get pictures. Well, last month I finally made it!!!! It was absolutely amazing, the pictures don't do it justice.
First...a hazy view of baker from the daffodil fields in Skagit Valley (home of the tulip festival)
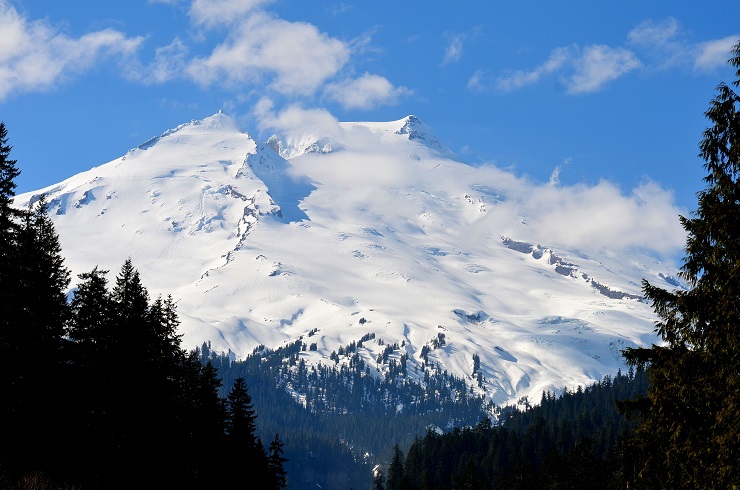
Mount Baker up close and personal!! (This is NOT cropped or even a zoom lense!)
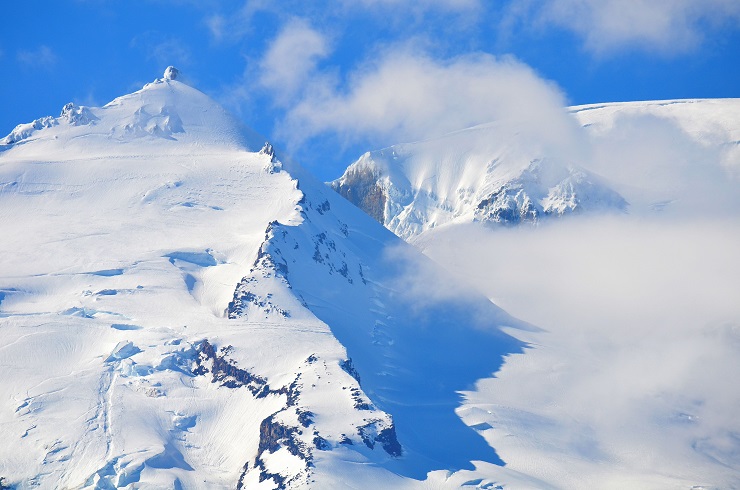
A close-up of the crater...steam?
I also made it up to Rainier park last month, but unfortunately we had horrible weather the whole time. I hope to get back up there this summer and get some new pictures.
Take care!
Sorry for the leave of absence, I was busy writing a book! (see sig line. )
I did some simple searching to see if the magma chamber theory had ever been expaned or further studied. It has been going on four years now since it was originally suggested. I didn't find a thing dated past 2009. I only found one follow-up article a few months later, that further examined the actual document. Basically, what the argument against this is....is that what this 'new' study is saying, is really not new. The suggested rate of 'melt' is 2-12%, which is what one might expect to find along a subducting zone. To go a step further and then call this area of melt a 'chamber' and saying that it is feeding the volcanos is where science and imagination seem to mix. SO...I am still on the fence with this. I have heard some very good comments against it over the past few years though. One thing that I DO still think connects it all are the deep tremors. I really think that the melt rate, or the state of the rocks (ie melt) is closely related to the deep tremors and how they move and what they mean. This would go along with the deep tremors only being found in subduction zones.
Anyways..thought I would give that little update!
I also wanted to share a few more pictures with you. Several years ago, I went camping up near Baker Lake and came across this bridge that had the most dramatic view of a Mount Baker (or any mountain!) that I had EVER seen. Ever since then, I had been wanting to take a drive up there on a clear day to get pictures. Well, last month I finally made it!!!! It was absolutely amazing, the pictures don't do it justice.
First...a hazy view of baker from the daffodil fields in Skagit Valley (home of the tulip festival)
Mount Baker up close and personal!! (This is NOT cropped or even a zoom lense!)
A close-up of the crater...steam?
I also made it up to Rainier park last month, but unfortunately we had horrible weather the whole time. I hope to get back up there this summer and get some new pictures.
Take care!
edit on 5-5-2013 by westcoast because: (no reason given)
new topics
-
Cats Used as Live Bait to Train Ferocious Pitbulls in Illegal NYC Dogfighting
Social Issues and Civil Unrest: 4 minutes ago -
The Good News According to Jesus - Episode 1
Religion, Faith, And Theology: 1 hours ago -
HORRIBLE !! Russian Soldier Drinking Own Urine To Survive In Battle
World War Three: 4 hours ago -
Bobiverse
Fantasy & Science Fiction: 6 hours ago -
Florida man's trip overseas ends in shock over $143,000 T-Mobile phone bill
Social Issues and Civil Unrest: 7 hours ago -
Former Labour minister Frank Field dies aged 81
People: 9 hours ago -
SETI chief says US has no evidence for alien technology. 'And we never have'
Aliens and UFOs: 10 hours ago
top topics
-
President BIDEN Vows to Make Americans Pay More Federal Taxes in 2025 - Political Suicide.
2024 Elections: 15 hours ago, 18 flags -
Florida man's trip overseas ends in shock over $143,000 T-Mobile phone bill
Social Issues and Civil Unrest: 7 hours ago, 8 flags -
SETI chief says US has no evidence for alien technology. 'And we never have'
Aliens and UFOs: 10 hours ago, 7 flags -
Former Labour minister Frank Field dies aged 81
People: 9 hours ago, 4 flags -
Bobiverse
Fantasy & Science Fiction: 6 hours ago, 3 flags -
Ode to Artemis
General Chit Chat: 16 hours ago, 3 flags -
This is our Story
General Entertainment: 13 hours ago, 3 flags -
HORRIBLE !! Russian Soldier Drinking Own Urine To Survive In Battle
World War Three: 4 hours ago, 1 flags -
Cats Used as Live Bait to Train Ferocious Pitbulls in Illegal NYC Dogfighting
Social Issues and Civil Unrest: 4 minutes ago, 1 flags -
The Good News According to Jesus - Episode 1
Religion, Faith, And Theology: 1 hours ago, 0 flags
active topics
-
I Guess Cloud Seeding Works
Fragile Earth • 39 • : BrucellaOrchitis -
"We're All Hamas" Heard at Columbia University Protests
Social Issues and Civil Unrest • 277 • : Xtrozero -
President BIDEN Vows to Make Americans Pay More Federal Taxes in 2025 - Political Suicide.
2024 Elections • 81 • : Consvoli -
Cats Used as Live Bait to Train Ferocious Pitbulls in Illegal NYC Dogfighting
Social Issues and Civil Unrest • 0 • : FlyersFan -
The Good News According to Jesus - Episode 1
Religion, Faith, And Theology • 2 • : Springbok -
Bobiverse
Fantasy & Science Fiction • 2 • : Springbok -
HORRIBLE !! Russian Soldier Drinking Own Urine To Survive In Battle
World War Three • 18 • : watchitburn -
Florida man's trip overseas ends in shock over $143,000 T-Mobile phone bill
Social Issues and Civil Unrest • 13 • : Consvoli -
British TV Presenter Refuses To Use Guest's Preferred Pronouns
Education and Media • 137 • : Annee -
Remember These Attacks When President Trump 2.0 Retribution-Justice Commences.
2024 Elections • 54 • : Asher47