It looks like you're using an Ad Blocker.
Please white-list or disable AboveTopSecret.com in your ad-blocking tool.
Thank you.
Some features of ATS will be disabled while you continue to use an ad-blocker.

Global warming? Meh, not so much. . .
page: 2share:
Originally posted by watcher73
Originally posted by mikerussellus
Source
news.bbc.co.uk...
This headline may come as a bit of a surprise, so too might that fact that the warmest year recorded globally was not in 2008 or 2007, but in 1998.
Didnt 1998 end up being a math error and the warmest year on record is in the 1930's?
not math, data!
let's see
Treemometers: A new scientific scandal
Global Warming Data in Question
and finally, it was 1934 to be exact...
NASA Admits that 1934, Not 1998, was the Warmest Year on Record
established, unestablished and re-established facts, depending on fashion and age...
[edit on 2009.10.11 by Long Lance]
Originally posted by OzWeatherman
Fact is that globally, over the last 2 or so years, the Earth has actually cooled significantly. Wether we will see this trend continue is anyones guess....but in my opinion, I think the global warming issue may have been inaccurate after all.
Actually expected better from your goodself, Oz. From others here, I do expect statistical and scientific naivete (along with obfuscation, misrepresentation, willful ignorance etc etc).
You make a number of inane claims here. Firstly, I know weather might be your thing, but climate is more than 2 year trends. A quick look at numerous 2 year periods in the past would show cooling and warming - might as well fling dice as to make predictions from such data.
Try woodfortrees to play around with the data from HadCRUT, NASA-GISS, RSS-MSU, or UAH. To put any inferential weight on such timescales is ridiculous.
Moreover, you then ask whether the two year 'cooling' trend might continue. Well, it takes less than 4 or 5 clicks to see the trend since 2008 is actually upwards. By the end of this year, the two year claim will now be of warming, lol.
So the claim of a supposed 'fact' of 'significant cooling' for the last 2 years (or so) is also ridiculous. The linear trend from 2007 to current day is negative (giving you the positive 'or so' part), but then you say 'cooled significantly' - what you mean statistically significant? Unlikely, perhaps run a Pearson's r and see what you get. Funnily enough, run it from 2008 to current (20 months), we get a positive trend (which would likely be p < .05 on eyeball). So even with the negative trend from 2007 it's neither significant statistically (bet ya, seen enough scatterplots) nor practically.
Climate is assessed on longer term scales, and the easiest way to measure deviation from the long-term trend is by using the residuals. They show no recent growing deviation - entirely lying within the noise of the last few decades. Here's an easy illustration, this data shows the trend from 1970 (40 years), 1980 (30 years), 1990 (20 years), 2000 (10 years) to current; along with the 10 year trends for 1970-1979, 1980-1989, 1990-1999. The noise in the shorter scale data is obvious, but all lie within a longer term trend - go try the same for anything less than 5 years, lol.
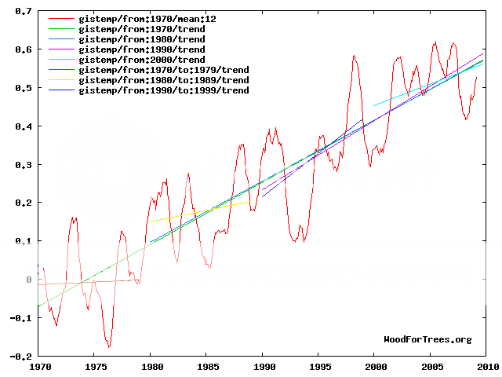
The absolute best that can be claimed is that there has been a short term stasis, but just really the normal noise that has been obvious a number of times over the last 30 years of long-term warming. Given we've had a La Nina along with quiet solar activity, these cooling biases have most likely just taken the edge off the longer-term warming - nothing more, nothing less.
To see a claim of inaccuracy from you, determined from an vacuous interpretation of 2 years (or so) data, is pretty sad. And then add the cherry of S&Fing an OP which wallows in cherrypicking (why 11 years? Why not 10? 12? 13? 14? 9? 22.75? And I assume HadCRUT not GISS, lol) and pushing cranks like Piers Corbyn.
Hey-ho.
[edit on 11-10-2009 by melatonin]
Wow. I posted this two days ago, got no hits so I thought, oh well.
Thanks for all the responses.
Thanks for all the responses.
reply to post by melatonin
Isn't it equally "inane" to claim that 30 years, on a global timescale, is definitive?
Go to your "oracle," woodfortrees.org, and show us the graphs for 1800 to 2000. Or 950 to 2009.
Why start (and end) your criticism at 1970? Because only those sets fit the agenda.
We have data that extends much farther back than 1970.
Try following a "trend" in a range out of the CW. See what you get.
And of copuse, woodfor trees is limited further by its reliance upon selcted data sources/sets.
First rule of computer trendlines: GIGO!
(garbage in, garbage out)
jw
[edit on 12-10-2009 by jdub297]
You make a number of inane claims here. Firstly, I know weather might be your thing, but climate is more than 2 year trends. A quick look at numerous 2 year periods in the past would show cooling and warming - might as well fling dice as to make predictions from such data.
Try woodfortrees to play around with the data from HadCRUT, NASA-GISS, RSS-MSU, or UAH. To put any inferential weight on such timescales is ridiculous.
Isn't it equally "inane" to claim that 30 years, on a global timescale, is definitive?
Go to your "oracle," woodfortrees.org, and show us the graphs for 1800 to 2000. Or 950 to 2009.
Why start (and end) your criticism at 1970? Because only those sets fit the agenda.
We have data that extends much farther back than 1970.
Try following a "trend" in a range out of the CW. See what you get.
And of copuse, woodfor trees is limited further by its reliance upon selcted data sources/sets.
First rule of computer trendlines: GIGO!
(garbage in, garbage out)
jw
[edit on 12-10-2009 by jdub297]
..suppose that's the problem with using ignore, you can still come across vacuous babbling before logging-in...
Considering that climate is generally defined as a period of 30 years, using the 40 years of data from 1970 is perfectly fine. Moreover, there's an obvious justification of using that period, as it is the most recent period of consistent climate warming (not weather-related noise).
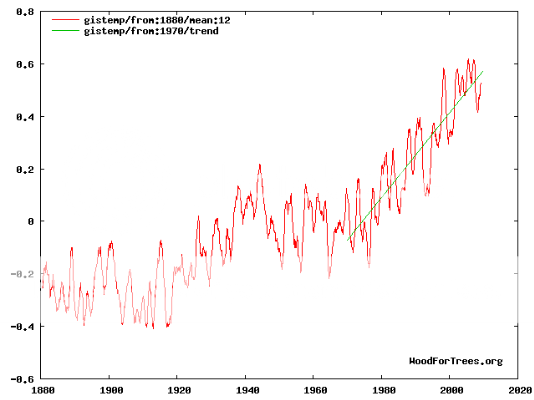
If you want to use the data from earlier (1880 for NASA-GISS), woodfortrees will provide it, along with all the major data sets available. So, if you mean by 'oracle' relying on data rather than ideological gut-based denialism and generally making scheidt up - yeah, I'll use the 'oracle' thanks. Anyway, I know you need this stuff packaged for you, so here's the 1880+ direct observations...
We can go earlier, but then we get into areas were your brethren can show more ignorance and sophistry:
Not sure the 1970+ trend would be so obvious on such an axis range, even harder to see the recent 'cooling' - I'm sure we'll be in an ice-age in 5 years if this cooling continues (lol). We'll be back to the frozen 1970s pretty soon. Wrap up well. Must be coming...anytime soon.
But I do actually think that the thread was about the recent trends...yeah, it's here:
My additions in bold
[edit on 12-10-2009 by melatonin]
Considering that climate is generally defined as a period of 30 years, using the 40 years of data from 1970 is perfectly fine. Moreover, there's an obvious justification of using that period, as it is the most recent period of consistent climate warming (not weather-related noise).
If you want to use the data from earlier (1880 for NASA-GISS), woodfortrees will provide it, along with all the major data sets available. So, if you mean by 'oracle' relying on data rather than ideological gut-based denialism and generally making scheidt up - yeah, I'll use the 'oracle' thanks. Anyway, I know you need this stuff packaged for you, so here's the 1880+ direct observations...
We can go earlier, but then we get into areas were your brethren can show more ignorance and sophistry:
Not sure the 1970+ trend would be so obvious on such an axis range, even harder to see the recent 'cooling' - I'm sure we'll be in an ice-age in 5 years if this cooling continues (lol). We'll be back to the frozen 1970s pretty soon. Wrap up well. Must be coming...anytime soon.
But I do actually think that the thread was about the recent trends...yeah, it's here:
Originally posted by mikerussellus
Source
news.bbc.co.uk...
This headline may come as a bit of a surprise, so too might that fact that the warmest year recorded globally was not in 2008 or 2007, but in 1998.
But it is true. For the last 11 years we have not observed any increase in global temperatures.
And our climate models did not forecast it, even though man-made carbon dioxide, the gas thought to be responsible for warming our planet, has continued to rise.
blah blah continue standard denier's ignorant waffle yadda yadda
My additions in bold
[edit on 12-10-2009 by melatonin]
reply to post by melatonin
Thanks. Except you missed the most important part of the piece by one line:
Even when you tweak the models to "fit" the data, they do not work. Global hysteria based on "models" is ridiculous.
The woodfortrees "trendline" fails to assess data for any period and in any direction. It merely reflects the author's bias.
GIGO. Baaaa.
jw
[edit on 14-10-2009 by jdub297]
our climate models did not forecast it, even though man-made carbon dioxide, the gas thought to be responsible for warming our planet, has continued to rise.
Even when you tweak the models to "fit" the data, they do not work. Global hysteria based on "models" is ridiculous.
The woodfortrees "trendline" fails to assess data for any period and in any direction. It merely reflects the author's bias.
GIGO. Baaaa.
jw
[edit on 14-10-2009 by jdub297]
Originally posted by melatonin
Thank you so much for providing a bit of evidence we can all believe in. If you will look at your chart at around 1000 AD, you will notice a warming trend. IT GOT FREAKIN HOT!!!! And all without factories and carbon emmisions from automobiles. How is it possible? I have a theory. Perhaps it happened because of sun cycles. The Sun, That big orange ball up there. the thing that provides all the heat we see and feel.
Now, before Sdog claims I want to pave the rainforests, I think we need to do a much better job with the way we are treating the earth. But I firmly resent being treated like a complete idiot and bing lied to by people who don't know who created the internet. If we are told the truth about things, we might trust you next time you want our attention. If you continue to lie, we might not care about the wolf next time.
reply to post by melatonin
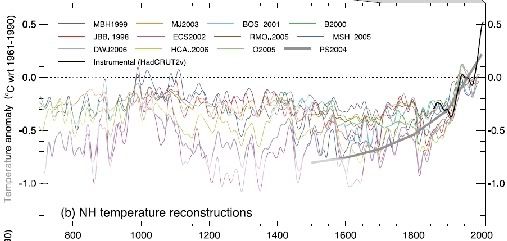
Hey Mel, since you posted this, would you like to explain to everyone what the bold grey line represents? You know, the one that forms the so called "hockey stick"?
You would think it would be a trend line of best fit, but it is obviously not an accurate fit at all. For starters, it starts below not just some, but ALL of the data sets, then magically arcs up over the data sets. So if it's not a trend line, what is it?
It wouldn't be intentionally trying to exagerate any warming
Originally posted by melatonin
Hey Mel, since you posted this, would you like to explain to everyone what the bold grey line represents? You know, the one that forms the so called "hockey stick"?
You would think it would be a trend line of best fit, but it is obviously not an accurate fit at all. For starters, it starts below not just some, but ALL of the data sets, then magically arcs up over the data sets. So if it's not a trend line, what is it?
It wouldn't be intentionally trying to exagerate any warming
would it?
Originally posted by melatonin
(along with obfuscation, misrepresentation, willful ignorance etc etc).
Whatever happened to global warming? How freezing temperatures are starting to shatter climate change theory
Read more: www.dailymail.co.uk... ing-go.html?ITO=1490##ixzz0Tw5plYXq
www.dailymail.co.uk... ing-go.html?ITO=1490#
Read more: www.dailymail.co.uk... ing-go.html?ITO=1490##ixzz0Tw5plYXq
Snowfall: Two mongrels enjoy today's fresh snow in Austria - the earliest snow since records began
Snowfall: Two mongrels enjoy today's fresh snow in Austria - the earliest snow since records began
In the freezing foothills of Montana, a distinctly bitter blast of revolution hangs in the air.
And while the residents of the icy city of Missoula can stave off the -10C chill with thermals and fires, there may be no easy remedy for the wintry snap's repercussions.
The temperature has shattered a 36-year record. Further into the heartlands of America, the city of Billings registered -12C on Sunday, breaking the 1959 barrier of -5C.
Closer to home, Austria is today seeing its earliest snowfall in history with 30 to 40 centimetres already predicted in the mountains.
Such dramatic falls in temperatures provide superficial evidence for those who doubt that the world is threatened by climate change.
But most pertinent of all, of course, are the growing volume of statistics.
According to the National Climatic Data Centre, Earth's hottest recorded year was 1998.
If you put the same question to NASA, scientists will say it was 1934, followed by 1998. The next three runner-ups are 1921, 2006 and 1931.
Which all blows a rather large hole in the argument that the earth is hurtling towards an inescapable heat death prompted by man's abuse of the environment.
Read more: www.dailymail.co.uk... ing-go.html?ITO=1490##ixzz0Tw6RfwR0
www.dailymail.co.uk... ing-go.html?ITO=1490#
Quiet Atlantic hurricane season a boon for insurers
Hey where did they all go/
www.reuters.com...
Storms menace CA...
Heavy snow expected in PA...
Chicago record breaking cold continues...
Montana records fall...
CHILL MAP...Via Drudge
news.yahoo.com...
forecast.weather.gov...
cbs2chicago.com...
www.wrh.noaa.gov...
vortex.plymouth.edu...
www.iceagenow.com...
Not by fire but by ice.
www.americanthinker.com...
They need GW to usher in our NWO
www.americanthinker.com...
Hey where did they all go/
www.reuters.com...
"There was for all intents and purposes no hurricane damage in the United States this year," Robert Hartwig, president of the Insurance Information Institute, told Reuters.
Storms menace CA...
Heavy snow expected in PA...
Chicago record breaking cold continues...
Montana records fall...
CHILL MAP...Via Drudge
news.yahoo.com...
forecast.weather.gov...
cbs2chicago.com...
www.wrh.noaa.gov...
vortex.plymouth.edu...
www.iceagenow.com...
Not by fire but by ice.
www.americanthinker.com...
But in the past week or so, it’s become more apparent than ever that those who’ve accused the international organization of politicizing science and manipulating data have been right all along.
This latest disclosure again concerns what has become the favorite propaganda propagation tool of climate activists -- the infamous “Hockey Stick Graph.” The familiar reconstruction, which deceitfully depicts last millennium’s global temperatures as flat prior to a dramatic upturn last century, has been displayed and touted ad nauseum as irrefutable proof of unprecedented and, therefore, anthropogenic, global warming (AGW).
Despite its previous debunking, the embattled AGW poster-child continues to languish in UN climate reports, which are unduly revered and quoted as gospel by all manner of proselytizers. In fact, just last week it had the bad timing to show up in a desperate UN compendium, released just days before Climate Audit published facts that promise to be the Hockey Stick’s (HS) long overdue epitaph. And those facts not only assuage any doubt of the chart’s fraudulence, but also of the deliberate and devious complicity of its creators, defenders and leading UN sponsors.
And without the Hockey Stick’s counterfeit portrait of runaway 20th century warming, climate crisis peddlers’ credibility levels are reduced to those of used car salesmen. Not where you want to be when hoping to sell the instinctively absurd premise that the actions of mankind can influence temperatures in either direction.
So they cheat. And they lie. And they have from the very beginning.
In 1989, climate scientist Stephen Schneider told Discover magazine:
“To capture the public imagination, we have to offer up some scary scenarios, make simplified dramatic statements and little mention of any doubts one might have. Each of us has to decide the right balance between being effective, and being honest.”
Twelve years later, Schneider was a lead author of the IPCC’s TAR, the same UN report that formally introduced the delusory Hockey Stick Graph.
In his masterpiece work, Heaven and Earth, Ian Plimer assessed the cadre whose own assessments form the foundation of virtually every climate-related scheme, law, tax, regulation and treaty throughout the globe thusly:
“The IPCC is clearly an ascientific political organization in which environmental activists and government representatives are setting the agenda for a variety of reasons including boosting trade, encouraging protectionism, adding costs to competitors and pushing their own sovereign barrow.”
Add lying perpetrators of fraud, and I'd say that about sums it up.
Speaking on the Senate floor in July of 2003, Senator James Inhofe (R-Okla) rightly called the threat of catastrophic global warming the "greatest hoax ever perpetrated on the American people."
They need GW to usher in our NWO
www.americanthinker.com...
Greenland Ice Cores show a clear hockey stick over the past 5,000 years.
2005 was probably the warmest year globally on record.
The summer saw the highest sea surfeace temperatures on record.
Baffin Ice Caps are at theire lowest extent since before the Medieval Warm Period - and its on Baffin and in the Labrador Heights that the next Glacial will begin.
Despite a prolonged solar minium, global temps are higher than during any recent solar min.
After over 150 years no-one has even attempted to disprove the greenhouse effect ......
Real sceptics argue that the Greenhouse Effect will still cause a ~1c rise in global temps for a doubling of CO2
Real sceptics argue that natural variation means we will not see a year on year increase in global temps - and that natural variation means we may even see some dips in temp. But the multi-decadal trend will continue upwards.
Real sceptics question the effect of CO2 on global warming - but raise the issue of black soot, deforestation, land use change, ozone, contrails and other anthropogenic effects which remain an inconvenient truth to many on both sides of the argument.
Real sceptics accept we dont really know. Do you?
You can bury your head in the sand for only so long. Before it bakes solid.
See me again in 2050
Originally posted by Curious and Concerned
Hey Mel, since you posted this, would you like to explain to everyone what the bold grey line represents? You know, the one that forms the so called "hockey stick"?
Nice question, curio-Con, but not for the reasons you probably think.
The dataset represented by the bold grey line is one often ignored by those perseverating on Mann, and is barely associated with the infamous 'hockeystick' - probably best to say hockeysticks, really, more than enough for the Montreal Canadiens.
PS2004 is a borehole dataset. Not a tree-ring in sight.
You would think it would be a trend line of best fit, but it is obviously not an accurate fit at all. For starters, it starts below not just some, but ALL of the data sets, then magically arcs up over the data sets. So if it's not a trend line, what is it?
A borehole dataset - Pollack & Smerdon (2004). It's what's called converging evidence. It does actually say PS2004 in the legend - although the resolution's a bit naff.
It wouldn't be intentionally trying to exagerate any warmingwould it?
Originally posted by melatonin
(along with obfuscation, misrepresentation, willful ignorance etc etc).
Nah, not really, it's just presenting another set of data. The more data the better.
I sort of knew what would happen if I posted anything resembling a curvy stick-like thing. I suppose it's a bit like zombie deniers of the dead (NEED BRAINS!). The hockey-stick whining is so last century. Also like fly-paper.
[edit on 14-10-2009 by melatonin]
reply to post by melatonin
do you have any thoughts on the 1000AD problem with your chart?
Any ideas on how that warming trend occurred?
I don't think anybody is denying it became warmer than it used to be for the past say 10 years, but now it seems to be returning to previous temperatures. And we needn't bother discussing the warming trend on Mars. Quite a coincidence that it happened at the same time ours did. Perhaps there is a common theme.
Wouldn't it be nice if we could just tell people the truth and attempt a cleaner planet by informing people of the real reasons we need to clean up our act?
Originally posted by Essan
After over 150 years no-one has even attempted to disprove the greenhouse effect ......
the real greenhouse effect is the result of limiting convection. it's more of a misnominer than anything else. still, objects in vacuum obey Kirchhoff's laws of radiative equilibrium, their absorption characteristics change the time it takes to reach equilibrium, not the temperature where it is located. none of this should be considered useful in the climate debate, though, strictly from experience of course.
not going to happen in an atmosphere. furthermore, one can reasonably question the effectiveness of any trace gas at low and high concentrations, effectively undermining the 'CO2 equals pollution' fad without even questioning the greenhouse effect.
www.eurekalert.org...
www.aip.org...
which is quite a promising approach, really. last but not least, there's a huge thread containing trying to collect contradicting papers and evidence:
Peer Reviewed Scientific Research That Refutes Anbthropogenic Global Warming and More.
Originally posted by network dude
do you have any thoughts on the 1000AD problem with your chart?
Any ideas on how that warming trend occurred?
No idea, lots suggested in the literature. Not really a problem, though.
But all your doing here is making the erroneous suggestion that just because the claim is that human factors are influencing climate now, any previous changes must also be human influenced.
Climate is a complex interacting system involving numerous variables, and I know no-one of note who thinks otherwise. Moreover, no-one of note doubts that climate can be positively forced by other non-human factors.
The sun going nova tomorrow and vapourising the earth at massive temperatures doesn't negate the well-established effect of greenhouse gases or other human-induced factors.
I don't think anybody is denying it became warmer than it used to be for the past say 10 years, but now it seems to be returning to previous temperatures. And we needn't bother discussing the warming trend on Mars. Quite a coincidence that it happened at the same time ours did. Perhaps there is a common theme.
But it isn't returning to previous temperatures. The data is pretty clear.
And it is a coincidence, mars warming is suggested to be due to dust storms. You're just regurgitating denier memes. It's such an obvious problem, these inane ideas just get a life of their own - wild ignorant claims taken at face value and spouted en masse. For example, just a few posts up we have the suggestion that 1934 is now the warmest year globally - such rubbish. But such claims are accepted and regurgitated by the borg with confidence without even an attempt to validate. Would take less than 5 minutes research to find the data and see it's wrong. In fact, it's on this very page.
Just makes the denier sound sloppy and foolish. But the lack of self-awareness and shame leads the same old talking heads to move to the next ignorant meme, which are then spouted with the same arrogance of ignorance of the ideologically motivated denier.
Wouldn't it be nice if we could just tell people the truth and attempt a cleaner planet by informing people of the real reasons we need to clean up our act?
That's what scientists are trying to do. Luckily deniers are generally being ignored at the levels that matter now, but their sophistry still has a pernicious effect in the public arena.
[edit on 15-10-2009 by melatonin]
reply to post by melatonin
Why is it that GW believers don't look any further than 10 years when they look at data? There was an ice age. Humans didn't cause it. Then there was a warming period. We didn't cause that either. Then if you look back 10 thousand years you can see it happen quite a few other times. It is so far from rocket science, it is pittiful.
And you claim that Mars has dust clouds that are to blame for it heating up at the same time the Earth does and the two have no commonalities between them in regards to warming. You don't even have to believe the sun will rise tomorrow to see a trend. We see NASA talk about solar flares, they are peaking right now. They have been building up to a peak. Kind of like how the temperatures have been building up.
We don't need to be scared into doing a better job with the planet. When everyone finds out Al Gore is an idiot and we wasted millions chasing a ghost, he will be tared and featherd. Untill then, He will have his minions trying to sell his snake oil. We ain't buying anymore. Historical data is what you need, not pictures of polar bears looking sad.
Originally posted by network dude
Why is it that GW believers don't look any further than 10 years when they look at data? There was an ice age. Humans didn't cause it. Then there was a warming period. We didn't cause that either. Then if you look back 10 thousand years you can see it happen quite a few other times. It is so far from rocket science, it is pittiful.
You're just making the same logical error. Yes, natural variations and influences exist. No-one doubts that. I know you think you're making some sort of slamdunk point, but it's actually rather inane and fallacious.
It doesn't negate human influences. It's like saying that heart failure happens naturally and has done since humans evolved, therefore me pumping you with KCl can't cause heart failure.
Ridiculous.
And you claim that Mars has dust clouds that are to blame for it heating up at the same time the Earth does and the two have no commonalities between them in regards to warming. You don't even have to believe the sun will rise tomorrow to see a trend. We see NASA talk about solar flares, they are peaking right now. They have been building up to a peak. Kind of like how the temperatures have been building up.
No, there is evidence that dust storms on Mars are the cause of the warming.
But, yeah, it's got to be anything other than human influences - oceans, solar flares, solar activity, cosmic rays, volcanoes, billions of fairies with zippos, Glen Beck's verbal flatulence, etc etc.
None of these negate the evidence showing human impacts.
We don't need to be scared into doing a better job with the planet. When everyone finds out Al Gore is an idiot and we wasted millions chasing a ghost, he will be tared and featherd. Untill then, He will have his minions trying to sell his snake oil. We ain't buying anymore. Historical data is what you need, not pictures of polar bears looking sad.
And so we end with the 'Gore is fat' cooties.
Originally posted by melatonin
You're just making the same logical error. Yes, natural variations and influences exist. No-one doubts that. I know you think you're making some sort of slamdunk point, but it's actually rather inane and fallacious.
Sadly, there are people who doubt that there is such a thing as natural variation. I have eccountered some of them on this very website. And I disagree that showing that the climate has changed naturally in the past is inane, considering that many believe that recent warming cannot be accounted for by natural variations, although I do agree that it is no "slamdunk" point for anything.
None of these negate the evidence showing human impacts.
A lot more people might be inclined to believe any evidence of human impacts if it wasn't riddled with fallacies
.
(along with obfuscation, misrepresentation, willful ignorance etc etc).
I don't need to tell you how wrong Al Gore was (or about the "'Gore is fat' cooties, whatever that means), yet many still believe him. I'm almost at the point where I think he was trying to make mistakes.
And I trust I also don't need to tell you how flawed the processes and methodologies of the political body known as the IPCC are. Yet governments around the world are rallying behind their projections as if it's gospel.
I'm not sure exactly what your line of belief is, but you must agree that the majority of "solutions" to AGW are nothing more than an appropriate transfer of wealth for the bankers and traders (along with so called "green" politicians) to gain further wealth/control/profit. This is the problem many have with AGW.
Yes we are having an effect on our environment. Where, how and to what extent could be argued forever. But the reality is, many people disagree that cap and trade is THE solution to avoid inevitable disaster due to greenhouse gases, yet this is what our governments are forcing us to believe.
Just like the recent bail outs, we are being led to believe the TINA theory. There Is No Alternative.
[edit on 16-10-2009 by Curious and Concerned]
Originally posted by melatonin
The dataset represented by the bold grey line is one often ignored by those perseverating on Mann, and is barely associated with the infamous 'hockeystick' - probably best to say hockeysticks, really, more than enough for the Montreal Canadiens.
PS2004 is a borehole dataset. Not a tree-ring in sight.
I'd also like to thank you for clarifying the reason for the bold grey line. That makes much more sense than a trend line. But with this begs the question...
Why is the data set that shows the most dramatic increase in temperature the only one in bold (along with the next most dramatic increase, which is in 'stand out' black.)?
Therefore, my previous question remains.
Originally posted by Curious and Concerned
It wouldn't be intentionally trying to exagerate any warmingwould it?
Originally posted by melatonin
(along with obfuscation, misrepresentation, willful ignorance etc etc).
new topics
-
When an Angel gets his or her wings
Religion, Faith, And Theology: 47 minutes ago -
Comparing the theology of Paul and Hebrews
Religion, Faith, And Theology: 1 hours ago -
Pentagon acknowledges secret UFO project, the Kona Blue program | Vargas Reports
Aliens and UFOs: 2 hours ago -
Boston Dynamics say Farewell to Atlas
Science & Technology: 2 hours ago -
I hate dreaming
Rant: 3 hours ago -
Man sets himself on fire outside Donald Trump trial
Mainstream News: 5 hours ago -
Biden says little kids flip him the bird all the time.
Politicians & People: 5 hours ago -
The Democrats Take Control the House - Look what happened while you were sleeping
US Political Madness: 6 hours ago -
Sheetz facing racial discrimination lawsuit for considering criminal history in hiring
Social Issues and Civil Unrest: 6 hours ago -
In an Historic First, In N Out Burger Permanently Closes a Location
Mainstream News: 8 hours ago
top topics
-
The Democrats Take Control the House - Look what happened while you were sleeping
US Political Madness: 6 hours ago, 16 flags -
In an Historic First, In N Out Burger Permanently Closes a Location
Mainstream News: 8 hours ago, 14 flags -
A man of the people
Medical Issues & Conspiracies: 13 hours ago, 8 flags -
Biden says little kids flip him the bird all the time.
Politicians & People: 5 hours ago, 8 flags -
Man sets himself on fire outside Donald Trump trial
Mainstream News: 5 hours ago, 7 flags -
Pentagon acknowledges secret UFO project, the Kona Blue program | Vargas Reports
Aliens and UFOs: 2 hours ago, 4 flags -
4 plans of US elites to defeat Russia
New World Order: 15 hours ago, 4 flags -
Sheetz facing racial discrimination lawsuit for considering criminal history in hiring
Social Issues and Civil Unrest: 6 hours ago, 3 flags -
Are you ready for the return of Jesus Christ? Have you been cleansed by His blood?
Religion, Faith, And Theology: 10 hours ago, 3 flags -
Boston Dynamics say Farewell to Atlas
Science & Technology: 2 hours ago, 3 flags
active topics
-
The Democrats Take Control the House - Look what happened while you were sleeping
US Political Madness • 59 • : xuenchen -
Man sets himself on fire outside Donald Trump trial
Mainstream News • 32 • : cherokeetroy -
Pentagon acknowledges secret UFO project, the Kona Blue program | Vargas Reports
Aliens and UFOs • 5 • : Ophiuchus1 -
-@TH3WH17ERABB17- -Q- ---TIME TO SHOW THE WORLD--- -Part- --44--
Dissecting Disinformation • 546 • : MetalThunder -
Boston Dynamics say Farewell to Atlas
Science & Technology • 4 • : Terpene -
12 jurors selected in Trump criminal trial
US Political Madness • 111 • : WeMustCare -
Election Year 2024 - Interesting Election-Related Tidbits as They Happen.
2024 Elections • 68 • : WeMustCare -
Candidate TRUMP Now Has Crazy Judge JUAN MERCHAN After Him - The Stormy Daniels Hush-Money Case.
Political Conspiracies • 401 • : WeMustCare -
So I saw about 30 UFOs in formation last night.
Aliens and UFOs • 36 • : Arbitrageur -
Thousands Of Young Ukrainian Men Trying To Flee The Country To Avoid Conscription And The War
Other Current Events • 48 • : Consvoli