It looks like you're using an Ad Blocker.
Please white-list or disable AboveTopSecret.com in your ad-blocking tool.
Thank you.
Some features of ATS will be disabled while you continue to use an ad-blocker.

Holy cow!! Look at this earthquake data!!!
page: 3share:
Quite simply, look at the listing of quakes this was taken from:
earthquake.usgs.gov...
As time passes, what is considered "of general historic interest" changes.
Look at this map:
earthquake.usgs.gov...
I know the time frame isn't the same, but I guarantee you in the year or two near when they happened, these would be of more interest than they are now.
earthquake.usgs.gov...
As time passes, what is considered "of general historic interest" changes.
Look at this map:
earthquake.usgs.gov...
I know the time frame isn't the same, but I guarantee you in the year or two near when they happened, these would be of more interest than they are now.
Are these quakes measured on the Richter Scale? It wasn't even invented until the 1930's. Seems the types of scales they've been using has
changed several times over the years. Could that account for some of this upswing in quakes? hmmmm...
Also, for those psychics out there predicting quakes....doesn't seem to be that tough.....
Also, for those psychics out there predicting quakes....doesn't seem to be that tough.....
Five earthquakes of magnitude 9 or above have been recorded during the past 45 years, which averages out to one every decade. It turns out that earthquake occurrences seem to follow what is called a power-law distribution, meaning that if there is on average on magnitude 9 earthquake every ten years somewhere in the world, then on average there should be one magnitude 8 earthquake every year, 10 magnitude 7 earthquakes every year, and 100 magnitude 6 earthquakes every year. So, if someone "predicts" that a magnitude 6 earthquake will occur somewhere in the world during the next week, don't be too impressed if it happens because random probability tells us that there should be a magnitude 6 earthquake somewhere in the world every 365/100 = 3.65 days! In reality, things are a little more complicated. But, you get the picture.
Originally posted by Stormdancer777
Originally posted by asmeone2
Oh my. I suppose all I can say, is Jesus must be coming
That's the first thought that crossed my mind.
I posted that rather sarcastially, as some Christians I know are aware of this data and point to it as "proof" that we are in the end times.
Jesus may be coming but as other posters have pointed out, the data is not yet sufficient to indicate whether or not this is a natural cycle and it may simply correlate with greater populations.
And personally, I think an increase in war and nuclear testing has a lot to do with the increases, as well.
I have a crazy theory; Might this general increase in natural disasters have to do with Nibiru approaching? What I mean to say is, could all of this
be planetary perturbations? If it really is approaching (Nibiru, Planet X, etc.). This could all be nothing compared to what is to come. I believe
these disasters will only multiply in magnitude and in occurrence. I'm not saying I'm the only person thinking of this but I don't know of any
sources that describe this as an explanation.
Or could this be the result of an ever increasing amount of secret underground tunnels that are being drilled?
Especially considering that they are probably linking major cities around the world.
Surely they are having some kind of weakening effect on the surroundind sub-terrain and finding the weak spots where they converge.
Especially considering that they are probably linking major cities around the world.
Surely they are having some kind of weakening effect on the surroundind sub-terrain and finding the weak spots where they converge.
Originally posted by jasdanmoo
Quite simply, look at the listing of quakes this was taken from:
earthquake.usgs.gov...
As time passes, what is considered "of general historic interest" changes.
Look at this map:
earthquake.usgs.gov...
I know the time frame isn't the same, but I guarantee you in the year or two near when they happened, these would be of more interest than they are now.
Exactly. The OP chart is meaningless FUD.
"Historic Earthquake" is a purely arbitrary designation applied by the USGS to certain quakes that favors more recent events because those are the ones people are most interested in. It is not a dataset useful for determining trends and anyone using this list as such is being intellectually dishonest.
Actually, if you go to different time lines you will find that it is not only earthquakes that have gone up alarmingly, but so have other natural
disasters.
It fits with my prediction that we have been in Armageddon for more than a century and that it is taking on a different meaning than we have been taught!
Along the lines that Armageddon could actually be a natural occurrence that changes and shifts the world and its people.
[edit on 3-12-2008 by MatrixProphet]
reply to post by Blaine91555
I agree that with increased seismic equipment, and increased communication across the world leads to more eq's reported.
That said the difference between the 1990's and the 2000's in terms of big quakes is staggering.
I agree that with increased seismic equipment, and increased communication across the world leads to more eq's reported.
That said the difference between the 1990's and the 2000's in terms of big quakes is staggering.
reply to post by WyrdeOne
Yep it is a very narrow window in time that earthquake data has been recorded. The truth is that we know very little about earthquakes.
Yep it is a very narrow window in time that earthquake data has been recorded. The truth is that we know very little about earthquakes.
reply to post by badmedia
No kidding man.
These are only big quakes 6.0 or bigger. There has certainly been a dramatic increase of big quakes in the last 10 years.
No kidding man.
These are only big quakes 6.0 or bigger. There has certainly been a dramatic increase of big quakes in the last 10 years.
Originally posted by downtown436
reply to post by badmedia
No kidding man.
These are only big quakes 6.0 or bigger. There has certainly been a dramatic increase of big quakes in the last 10 years.
No there has not.
neic.usgs.gov...
neic.usgs.gov...
I also thought of Tesla when reading this.
They have been testing everything and anything on our poor, unsuspecting planet.
It seems more likely than not that they would test some type earthquake inducing weapon.
They have been testing everything and anything on our poor, unsuspecting planet.
It seems more likely than not that they would test some type earthquake inducing weapon.
Using at the total earthquake numbers (not those arbitrarily listed as "historic") provided by the USGS at the links provided above, let's see what
the yearly averages are by decade...
Mag 80's 90's 00's
6-6.9 98 133.9 145.7
7-7.9 10.1 14.7 12.8
8+ .4 .6 1.3
So, we can see the averages are mostly trending up. The 8+ quakes in the 00's have been double those reported in the 90's (12 vs 6).
Mag 80's 90's 00's
6-6.9 98 133.9 145.7
7-7.9 10.1 14.7 12.8
8+ .4 .6 1.3
So, we can see the averages are mostly trending up. The 8+ quakes in the 00's have been double those reported in the 90's (12 vs 6).
I did the math.
2000-2008
1291 6.0-6.9
115 7.0-7.9
12 8.0+
-------------
1481
divided by 9 years of data = 164.5 quakes / year
1990-1999
1339 6.0-6.9
147 7.0-7.9
6 8.0+
---------------------
1492
divided by 10 years of data = 149.2 / year
Most significant is the number of 8.0+ per year which had doubled. But an average of 149.2 quakes per year in the 90's, 164 quakes per year after 200.
Also, in order to be in sync with the first chart, which shows the bump in 2001, not 2000 I added the year 2000 to the 90's.
And I came up with 150 /year for 1990 to 2000, and 165 /year from 2001 to present.
Average activity per decade doesn't make much sense. The sample period is too short and one active year skews the decade.
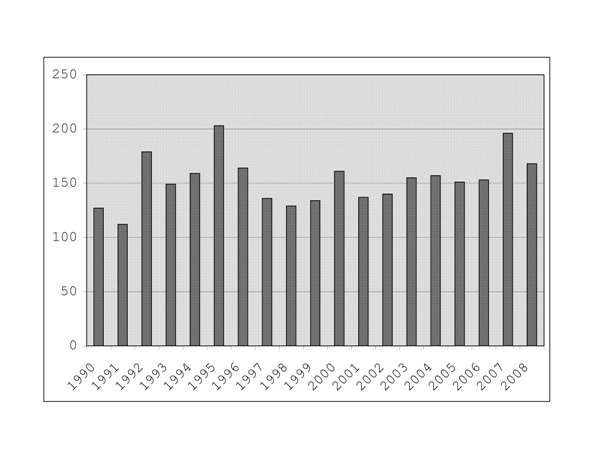
This chart puts it in a bit better perspective.
[edit on 12/3/2008 by Phage]
This chart puts it in a bit better perspective.
[edit on 12/3/2008 by Phage]
Originally posted by Blaine91555
The person who put the information together should have pointed that out in the interest of intellectual honesty and not allowed it to be presented without all available information pertinent to the claim. After all their income relies some what on using fear to sell.
My thoughts exactly, doesn't seem to point out that the amount of equipment to measure these quakes werent around back in those days in different countries.
Originally posted by downtown436
reply to post by Phage
Dude your stats only show the last 10 years.
Really? It looks like 19 years to me.
It also shows all of the recorded quakes over 6.0. The OP chart does not.
[edit on 12/3/2008 by Phage]
new topics
-
Who could it beeee now?
New World Order: 1 hours ago -
The Russian Vostok complex has been put into operation in Antarctica
Science & Technology: 1 hours ago -
Letitia James tells judge to Reject Trumps $175 Million Bond
2024 Elections: 1 hours ago -
Tucker Carlson UFOs are piloted by spiritual entities with bases under the ocean and the ground
Aliens and UFOs: 2 hours ago -
Hello from burritocat
Introductions: 3 hours ago -
An Apology From the Dunderbeck Sausage Company
Music: 5 hours ago -
Tucker on Joe Rogan talking Kona Blue and UFOs
Aliens and UFOs: 6 hours ago -
Remember These Attacks When President Trump 2.0 Retribution-Justice Commences.
2024 Elections: 7 hours ago -
Predicting The Future: The Satanic Temple v. Florida
Conspiracies in Religions: 7 hours ago -
WF Killer Patents & Secret Science Vol. 1 | Free Energy & Anti-Gravity Cover-Ups
General Conspiracies: 9 hours ago
top topics
-
The Democrats Take Control the House - Look what happened while you were sleeping
US Political Madness: 17 hours ago, 19 flags -
Biden says little kids flip him the bird all the time.
Politicians & People: 17 hours ago, 9 flags -
Man sets himself on fire outside Donald Trump trial
Mainstream News: 16 hours ago, 9 flags -
Michigan school district cancels lesson on gender identity and pronouns after backlash
Education and Media: 11 hours ago, 9 flags -
WF Killer Patents & Secret Science Vol. 1 | Free Energy & Anti-Gravity Cover-Ups
General Conspiracies: 9 hours ago, 8 flags -
Remember These Attacks When President Trump 2.0 Retribution-Justice Commences.
2024 Elections: 7 hours ago, 6 flags -
Pentagon acknowledges secret UFO project, the Kona Blue program | Vargas Reports
Aliens and UFOs: 14 hours ago, 6 flags -
Boston Dynamics say Farewell to Atlas
Science & Technology: 14 hours ago, 6 flags -
Israel attacking Iran again.
Middle East Issues: 11 hours ago, 5 flags -
The Russian Vostok complex has been put into operation in Antarctica
Science & Technology: 1 hours ago, 4 flags
active topics
-
Israel attacking Iran again.
Middle East Issues • 45 • : ToneD -
Boston Dynamics say Farewell to Atlas
Science & Technology • 8 • : Dalamax -
Elites disapearing
Political Conspiracies • 35 • : 0bserver1 -
Who could it beeee now?
New World Order • 4 • : DAVID64 -
The Democrats Take Control the House - Look what happened while you were sleeping
US Political Madness • 76 • : Justoneman -
Biden says little kids flip him the bird all the time.
Politicians & People • 20 • : Dalamax -
Hurt my hip; should I go see a Doctor
General Chit Chat • 15 • : DAVID64 -
WF Killer Patents & Secret Science Vol. 1 | Free Energy & Anti-Gravity Cover-Ups
General Conspiracies • 5 • : charlyv -
Tucker Carlson UFOs are piloted by spiritual entities with bases under the ocean and the ground
Aliens and UFOs • 5 • : Jukiodone -
The Russian Vostok complex has been put into operation in Antarctica
Science & Technology • 6 • : alwaysbeenhere2