It looks like you're using an Ad Blocker.
Please white-list or disable AboveTopSecret.com in your ad-blocking tool.
Thank you.
Some features of ATS will be disabled while you continue to use an ad-blocker.

'No Sun link' to climate change
page: 1share:
'No Sun link' to climate change
This is one in the eye for the global-warming deniers. There are quite a lot of them on these boards. If you seal your garage air-tight and let your car run for an hour, your garage will stink. Isn't it about time people driving hummers and SUV's started to face up to what they are doing instead of blaming it on the sun?
A new scientific study concludes that changes in the Sun's output cannot be causing modern-day climate change.
It shows that for the last 20 years, the Sun's output has declined, yet temperatures on Earth have risen.
This is one in the eye for the global-warming deniers. There are quite a lot of them on these boards. If you seal your garage air-tight and let your car run for an hour, your garage will stink. Isn't it about time people driving hummers and SUV's started to face up to what they are doing instead of blaming it on the sun?
I love bad news reports. #1 there is always a lag in temperature changes. You'll notice that the average coldest and warmest days don't fall on
the shortest and longest days. In fact they fall about a month later. Same goes for global temperature changes. Solar activity has been decreasing
and we went from warming 20 to 10 years ago to flat global temperatures 10 years ago to recent.
I would summarize by saying there is no truth to this story. Global warming (if that is what you want to call very short term climate cycles) ended 10 years ago.
I would summarize by saying there is no truth to this story. Global warming (if that is what you want to call very short term climate cycles) ended 10 years ago.
I have to agree with the above poster. There has always been a historical lag with sun changes, but they have been consistant. Also, the global temp
leveling off the last decade has already been shown. This is a biased news story to push one point of view... one that I believe is incorrect.
Mars pole ice practically disappeared within a decade. But maybe cuz ov
Niiibiiiruuuuu ?
Not a global warming. A Solar System Warming.
Warning.
Not a global warming. A Solar System Warming.
Warning.
Nothing in my eye. Not only isn;t global warming caused by man....Global warming does not and never has existed. its a scam. plain and simple.
Try again......keep trying.....Nice try..........
Try again......keep trying.....Nice try..........
Hmmm, I think I will stick with what people trained to study these things rather than the nameless minions of the internet who offer no more than
their "opinions". Thanks for posting this story rizla, I will have to dig up the study and see exactly what it has to say.
reply to post by rizla
The study is actually quite a few months old and, need I say, the news that solar activity cannot account for current warming is a few years old.
As for the misinformation above, removing the normal solar cycle, solar activity has been pretty much constant for decades (peak about the 1940s).
And now this data from Lockwood & Frolich shows it might have even been falling for a couple of that. The data appears to show maybe some lag between solar activity and temps, but only a decade or so. We are 50 years past the peak in the 1940s, heh.
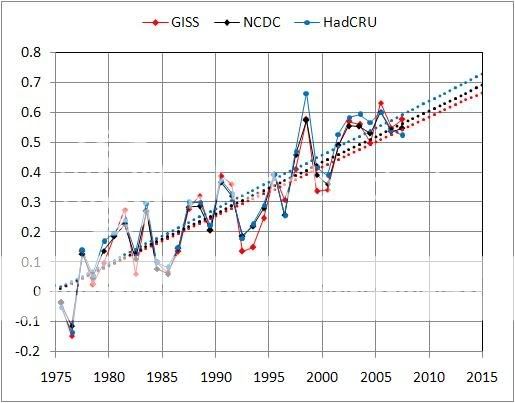
Moreover, warming over the last few years is entirely consistent with the recent warming period (around the 1970s). An interesting way to view the data, which clearly shows this, is to use residuals.
Residuals of regression data show the variation around a long-term trend (i.e. difference between actual and expected). So, what we would do is to assess the rate of some trend between point A and point B. This provides a line of best fit (correlation/regression). Then the residual calculates how the actual data varies around this perfect fit regression line (i.e. overall trend). Thus, data points above (i.e. positive) are greater than expected, those below (i.e. negative) lower than expected for the calculated period.
Using this approach for the 1975-2007 period for surface temperatures clearly shows how the data fit the warming trend over this period:
Actual data with trend for only 1975-2000 (i.e. give indication of last several years vs. past trends):
Residuals:
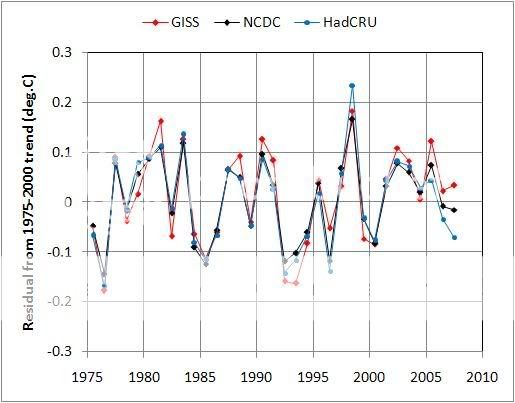
What we can take from this data is that warming over the last 10 years is no different than that before. The residuals consolidate this finding, showing that much of the data for the last ten years is around the normal rate for 1975-2000. Indeed, since 2000, 5 of the years are above their expected temperatures for the 1975-2000 trend. If temperatures were to plateau or show a cooling trend, we would expect the residuals to become increasingly negative.
Thus, rather than:
'Global warming' never went away.
[hat tip to tamino for ze data. More detail via the link]
[edit on 30-1-2008 by melatonin]
The study is actually quite a few months old and, need I say, the news that solar activity cannot account for current warming is a few years old.
As for the misinformation above, removing the normal solar cycle, solar activity has been pretty much constant for decades (peak about the 1940s).
And now this data from Lockwood & Frolich shows it might have even been falling for a couple of that. The data appears to show maybe some lag between solar activity and temps, but only a decade or so. We are 50 years past the peak in the 1940s, heh.
Moreover, warming over the last few years is entirely consistent with the recent warming period (around the 1970s). An interesting way to view the data, which clearly shows this, is to use residuals.
Residuals of regression data show the variation around a long-term trend (i.e. difference between actual and expected). So, what we would do is to assess the rate of some trend between point A and point B. This provides a line of best fit (correlation/regression). Then the residual calculates how the actual data varies around this perfect fit regression line (i.e. overall trend). Thus, data points above (i.e. positive) are greater than expected, those below (i.e. negative) lower than expected for the calculated period.
Using this approach for the 1975-2007 period for surface temperatures clearly shows how the data fit the warming trend over this period:
Actual data with trend for only 1975-2000 (i.e. give indication of last several years vs. past trends):
Residuals:
What we can take from this data is that warming over the last 10 years is no different than that before. The residuals consolidate this finding, showing that much of the data for the last ten years is around the normal rate for 1975-2000. Indeed, since 2000, 5 of the years are above their expected temperatures for the 1975-2000 trend. If temperatures were to plateau or show a cooling trend, we would expect the residuals to become increasingly negative.
Thus, rather than:
Originally posted by Indy
Global warming (if that is what you want to call very short term climate cycles) ended 10 years ago.
'Global warming' never went away.
[hat tip to tamino for ze data. More detail via the link]
[edit on 30-1-2008 by melatonin]
There is no warming over the last 10 years. It has been absolutely flat. For anyone to imply that it has been warming since 1998 is just silly.
Temperatures have gone nowhere in a decade and that is extremely damaging to global warming claims. So AGW supporters will come up with any way
possible to try and spin the numbers to show something else. Fact is warming stopped and temperatures since 1998 remain pretty much unchanged. Sorry
to burst your bubble on this.
This is how you spin global warming. Look at the images Melatonin posted. Those short periods of time were selected because they fit an agenda.
Lets look at the last 10 years of data and remove the eye candy designed to convince you the planet is still warming. This is the last 10 years and
the temperature trend.
That is called spin IPCC style.
That is called spin IPCC style.
Originally posted by Indy
This is how you spin global warming. Look at the images Melatonin posted. Those short periods of time were selected because they fit an agenda. Lets look at the last 10 years of data and remove the eye candy designed to convince you the planet is still warming. This is the last 10 years and the temperature trend.
That is called spin IPCC style.
And that is called 'making feces up'.
What the hell is that? Heh. Did you just like stick any old line through that data? Did you extract it from a warm dark place?
Come on, Indy, go take stats 101. For the last 10 years the data shows this:
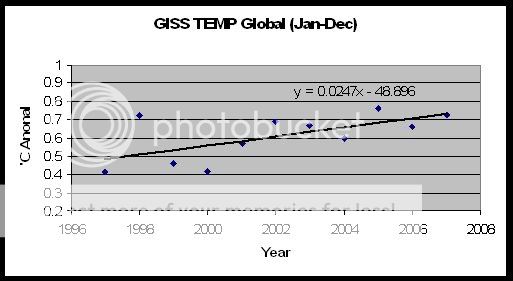
Now, if you do a little learnin', you would understand that I just quickly calculated the regression equation for the GISS Temp data for 1997-2007. Whereas you just stuck any old line through the data.
The equation y = mx + c is used, where m provides the gradient/slope of the data. In other words, the trend in the data. The trend for this period is actually positive, which means it is going up, and is going upwards at a rate of 0.0247'C per year for that period.
The trend for 1975-2007 is actually about 0.018'C per year. Therefore the trend is actually higher for 1997-2007.
What I just did is normal procedure for all sciences. It is very basic statistics. What you did is normal procedure for ideologues and sophists.
Can't believe people actually starred that post. Unbelievable. I fear for humanity, I really do.

[edit on 30-1-2008 by melatonin]
Originally posted by Indy
This is how you spin global warming. Look at the images Melatonin posted. Those short periods of time were selected because they fit an agenda. Lets look at the last 10 years of data and remove the eye candy designed to convince you the planet is still warming. This is the last 10 years and the temperature trend.
That is called spin IPCC style.
This post amuses me to no end. I love your criticism of melatonin's being base don the short time frame, then you post an image with an even shorter time frame. Poor form IMHO.
Secondly, let us have a look at your posted image and then the same images as posted by melatonin. First notice rather than showing years 1995 through 2008 mel's show years 1975 through 2008. Second, notice the pattern in the images mel linked. What do you see? Do you notice the peeks and valleys? Interesting huh?
My point? Simple, I think your post is a weak attempt at dismissing the info mel posted by trying to show a decline in temperature. Yes I agree there is one, but only one taken out of context.
The climate has been rather stable for ten years, true. But look at the lager graph and you will see it is not the first time.
Edit: you beat me to it MEl, I was typing while you were Iguess...
[edit on 30-1-2008 by Animal]
Originally posted by Animal
My point? Simple, I think your post is a weak attempt at dismissing the info mel posted by trying to show a decline in temperature. Yes I agree there is one, but only one taken out of context.
The climate has been rather stable for ten years, true. But look at the lager graph and you will see it is not the first time.
The thing is, though, is that it hasn't.
There has been no decline, it's still going up. If we do pick a real short period, maybe 5 years, then we might see a downwards trend or a plateau. But as you wisely point out, this allows the data to be swamped by noise.
The shorter the period used, the more that noise will impact on the data. But for the 10 year data, the trend is still upwards.
Even if we have a period of plateau or even some cooling, it doesn't in itself negate the impact of GHGs, which Indy would like to think is the case. The first thing to do would be to look for the cause, which if solar activity is decreasing, then that's the obvious place to look.
The doublethink of deniers is so obvious. They moan that climate science ignores other variables, and then they are the first to actually ignore other variables to mislead.
[edit on 30-1-2008 by melatonin]
Hey Melatonin... at least have enough integrity to use correct data. Your GISS Temp Global chart isn't even accurate. 2005 wasn't warmer than
1998. And the lines as I've shown you are absolutely meaningless. You can use all your clever manipulation of statistics you want. One thing that
everyone knows is that statistics can be manipulated. They can be manipulated by changing the time line. They can be manipulated visually by
changing the amount of space used between units vertically and horizontally. The y= formula in your graph is meaningless tripe. Had you watched
those videos that were posted recently you'd see just how that trend line actually works and how dishonestly people can manipulate stats and graphs
to push an agenda.
Originally posted by Indy
Hey Melatonin... at least have enough integrity to use correct data. Your GISS Temp Global chart isn't even accurate. 2005 wasn't warmer than 1998.
Sorry, Indy. 2005 was warmer than 1998 in the GISTEMP data. 2005 = 0.76'C; 1998 = 0.72'C.
It is the Hadley CRUT data that shows 1998 being a tad higher than 2005. There is a reason for this difference between the two data sets, NASA includes polar regions, Hadley doesn't, thus the El Nino of 1998 has a greater impact on the Hadley data.
And the lines as I've shown you are absolutely meaningless. You can use all your clever manipulation of statistics you want. One thing that everyone knows is that statistics can be manipulated. They can be manipulated by changing the time line. They can be manipulated visually by changing the amount of space used between units vertically and horizontally.
That might make a difference visually, but it doesn't change the stats. That's why we use them, it lets the data speak for itself. It doesn't matter whether the visual distance between one year and the next is 500 miles or 2 centimeters, the equation will be the same. At no point willit actually show a negative slope though. Indeed, I could have made it look steeper if I wanted, but why bother? The equation makes the point.
Your line was meaningless when related to the data. It actually did have meaning for me, it meant you need to take stats 101. The line I used was a very basic statisitical technique, no great data manipulation. Just finding the line of best fit through all the data - the trend over a 10 year period, which was the most appropriate method.
The y= formula in your graph is meaningless tripe. Had you watched those videos that were posted recently you'd see just how that trend line actually works and how dishonestly people can manipulate stats and graphs to push an agenda.
y=mx+c is the straight line equation. Very basic maths, my son who is 14 did it last semester. Here's a primer if you need it.
If you want to know a trend in data, it is normal procedure. It is more honest than just looking at a set of data and ramming any line you likes through it. What manipulation is there? The trend will be the same with that data every time I apply it. Try it yourself in excel. Plot the data as a scatter, and add a linear trendline. You could even play with polynomials if you want, heh.
The dishonesty may well be all yours dude, you're the one ramming any line through the data, amazingly, it actually showed cooling when the real data shows warming. That could be viewed as dishonest behaviour, but I'll put it down to ignorance today as I'm in a good mood.
Come on, indy, how did you calculate your line? My approach is clear, easily repeated, and statistically appropriate. How did you get your line?
[edit on 31-1-2008 by melatonin]
Before this gets out of hand, I'll just throw in a gentle reminder that "courtesy is mandatory" and all. You've all been here long enough to know
the drill.
If we could stick to the data without personal attacks, that would be great. It's a complex and fascinating (and important) topic, which I'd love to see discussed in a calm and polite manner. I know you're all intelligent enough to get your points across without the petty sniping.
Just sayin'.
If we could stick to the data without personal attacks, that would be great. It's a complex and fascinating (and important) topic, which I'd love to see discussed in a calm and polite manner. I know you're all intelligent enough to get your points across without the petty sniping.
Just sayin'.
Britain's Royal Society has endorsed this new information. It's an old, respected institution.
Like Animal, I think I'll go with what the experts tell us; they spend their whole lives studying these things, unlike the people who have no background on it but strong opinions.
Like Animal, I think I'll go with what the experts tell us; they spend their whole lives studying these things, unlike the people who have no background on it but strong opinions.
I suppose if we blame the sun, then we remove personal responsibility and the need to change our behavior.
Denial is not just a big river in Egypt.
Denial is not just a big river in Egypt.
question I have for all the backers of global warming in here...forget if the sun could be responsible, (though Im curious what aspects of "output"
were analyzed to say the sun couldnt be responsible, as there are various types of output that could cause an influence,) it IS a fact that the entire
solar system is warming, which DOES put serious doubt that GW is man-made. (Also, some of you might want to get some perspective on how little carbon
dioxide is actually in the atmosphere, you might be surprised.) To me, if an entire system is showing an effect, I dont go to one part of the system
and say "I dont know why the rest of the system is doing this, but you little bastards on this rock are an isolated system causing your own
destruction!" It's completely illogical.
This thread here has a good start on information for a warming solar system: www.abovetopsecret.com...
This thread here has a good start on information for a warming solar system: www.abovetopsecret.com...
reply to post by saturnine_sweet
You wont find many people on this site that claim GW is has a anthropogenic cause ALONE. I know that planetary systems are incredibly complex and I assume that there are many factors that play a roll in warming trends. Still this does not mean I will dismiss the impacts of our polluting this system.
I reviewed the link you posted too and I am left unconvinced. I am willing to believe that there is evidence fro warming on other planets (Pluto being the most convincing) but I do not think that the information shared here is conclusive enough to dismiss the effects human beings have on this planet.
Remember the ozone hole? Remember how we deduced that our chemical use was causing it to open more widely every year? Remember how we banned the use of certain chemicals and the ozone holes began to return to their normal aperture?
IT is silly to dismiss the effects we can have on this planet. Maybe 200 or more years ago when there were less than 1billion people on the planet these types of effects would be hard to produce, but remember, there are 6.5 billion people running about today. Ignoring the impacts we asa a species has on this planet is willful disregard for our home.
But comparing the ozone depleting abilities of CFC's to the "greenhouse effect" of carbon dioxide is misleading. CFC's directly interact with the
ozone layer. Carbon dioxide and its potential effects involve far more complex processes. For instance, the most popular way to explain it is that
increased carbon dioxide traps more heat....now, going off the top of my head, if I remember right, the amount of carbon dioxide in the environment is
around the scale of 0.3%. As you can see, that does give some difficulties with having enough particle density to have a greenhouse effect.
Also note, as show here manmade carbon dioxide comprises a very small amount of the actual carbon dioxide level. What does this tell us? One, that carbon dioxide has little to do with warming trends, and two, that man-made carbon dioxide isnt the problem. If you want to address rising levels, proper action would be to stop the destruction of rainforests, etc. That is where the rise in carbon levels comes from, more than anything. What we contribute is merely a drop in the bucket.
Why would there be so many scientists saying otherwise? Well, lets see...where does funding come from? Politicians...and who are the greatest proponents of GW? Politicians...it's politics, people, not truth.
new topics
-
Maestro Benedetto
Literature: 8 minutes ago -
Is AI Better Than the Hollywood Elite?
Movies: 16 minutes ago -
Las Vegas UFO Spotting Teen Traumatized by Demon Creature in Backyard
Aliens and UFOs: 3 hours ago -
2024 Pigeon Forge Rod Run - On the Strip (Video made for you)
Automotive Discussion: 4 hours ago -
Gaza Terrorists Attack US Humanitarian Pier During Construction
Middle East Issues: 4 hours ago -
The functionality of boldening and italics is clunky and no post char limit warning?
ATS Freshman's Forum: 6 hours ago -
Meadows, Giuliani Among 11 Indicted in Arizona in Latest 2020 Election Subversion Case
Mainstream News: 6 hours ago -
Massachusetts Drag Queen Leads Young Kids in Free Palestine Chant
Social Issues and Civil Unrest: 6 hours ago -
Weinstein's conviction overturned
Mainstream News: 8 hours ago -
Supreme Court Oral Arguments 4.25.2024 - Are PRESIDENTS IMMUNE From Later Being Prosecuted.
Above Politics: 9 hours ago
top topics
-
Krystalnacht on today's most elite Universities?
Social Issues and Civil Unrest: 9 hours ago, 9 flags -
Supreme Court Oral Arguments 4.25.2024 - Are PRESIDENTS IMMUNE From Later Being Prosecuted.
Above Politics: 9 hours ago, 8 flags -
Weinstein's conviction overturned
Mainstream News: 8 hours ago, 7 flags -
University of Texas Instantly Shuts Down Anti Israel Protests
Education and Media: 12 hours ago, 6 flags -
Massachusetts Drag Queen Leads Young Kids in Free Palestine Chant
Social Issues and Civil Unrest: 6 hours ago, 6 flags -
Gaza Terrorists Attack US Humanitarian Pier During Construction
Middle East Issues: 4 hours ago, 6 flags -
Meadows, Giuliani Among 11 Indicted in Arizona in Latest 2020 Election Subversion Case
Mainstream News: 6 hours ago, 5 flags -
Las Vegas UFO Spotting Teen Traumatized by Demon Creature in Backyard
Aliens and UFOs: 3 hours ago, 3 flags -
2024 Pigeon Forge Rod Run - On the Strip (Video made for you)
Automotive Discussion: 4 hours ago, 2 flags -
Any one suspicious of fever promotions events, major investor Goldman Sachs card only.
The Gray Area: 14 hours ago, 2 flags
active topics
-
University of Texas Instantly Shuts Down Anti Israel Protests
Education and Media • 210 • : DBCowboy -
Is AI Better Than the Hollywood Elite?
Movies • 1 • : 5thHead -
British TV Presenter Refuses To Use Guest's Preferred Pronouns
Education and Media • 164 • : Annee -
VP's Secret Service agent brawls with other agents at Andrews
Mainstream News • 56 • : CarlLaFong -
Maestro Benedetto
Literature • 0 • : BrotherKinsMan -
Massachusetts Drag Queen Leads Young Kids in Free Palestine Chant
Social Issues and Civil Unrest • 11 • : marg6043 -
Electrical tricks for saving money
Education and Media • 7 • : chr0naut -
Definitive 9.11 Pentagon EVIDENCE.
9/11 Conspiracies • 424 • : Zanti Misfit -
Las Vegas UFO Spotting Teen Traumatized by Demon Creature in Backyard
Aliens and UFOs • 8 • : Macenroe82 -
SHORT STORY WRITERS CONTEST -- April 2024 -- TIME -- TIME2024
Short Stories • 23 • : DontTreadOnMe