It looks like you're using an Ad Blocker.
Please white-list or disable AboveTopSecret.com in your ad-blocking tool.
Thank you.
Some features of ATS will be disabled while you continue to use an ad-blocker.

Pentagon "NTSB animation" is wrong!
page: 19share:
Nick, physics is physics. If nm/hr (knots) varies in the horizontal, then long/hr should vary. If nm/hr is variable and long/hr is not, then that does
not take a rocket scientist to know that there is a problem.
I'm beginning to suspect you are making this more complicated than it is.
Mr. lear, I have numerous frames and details posted in the FDR category on my blog.
[edit on 9-6-2007 by spcengineer]
[edit on 9-6-2007 by spcengineer]
I'm beginning to suspect you are making this more complicated than it is.
Mr. lear, I have numerous frames and details posted in the FDR category on my blog.
[edit on 9-6-2007 by spcengineer]
[edit on 9-6-2007 by spcengineer]
Originally posted by spcengineer
Nick, physics is physics. If nm/hr (knots) varies in the horizontal, then long/hr should vary. If nm/hr is variable and long/hr is not, then that does not take a rocket scientist to know that there is a problem.
I'm beginning to suspect you are making this more complicated than it is.
This is where I'm not familiar with the specific terms and variables you're referring to. I was planning on spending some time understanding this.
The way I understand it, long/hr is simply the east/west directional speed as measured in miles per hour. Is this correct, or am I misinterpreting this?
So what's the difference between nm/hr and long/hr? I'm just not familiar with how the variables are defined.
long/hr = degrees of longitude per hour
nm/hr = knots = nautical miles per hour
Just two measures of the same thing, horizontal speed.
horizontal defined = east-west directional
[edit on 9-6-2007 by spcengineer]
nm/hr = knots = nautical miles per hour
Just two measures of the same thing, horizontal speed.
horizontal defined = east-west directional
[edit on 9-6-2007 by spcengineer]
Originally posted by spcengineer
Nick, physics is physics. If nm/hr (knots) varies in the horizontal, then long/hr should vary.
Not necessarily. If an aircraft is flying due west at 200 kts lets say, this equals a long/hr rate of about 3 degrees. This is just a rough guess.
Now if the aircraft turns to a heading of, say....315, and maintains an airspeed of 200 kts, the long/hr rate will decrease proportionately to the variance of the new course from the original course.
Head winds and tail winds will also create discrepancies between indicated airspeed and long/hr rate which is an expression of ground speed along any line of lattitude.
Originally posted by darkbluesky
Originally posted by spcengineer
Nick, physics is physics. If nm/hr (knots) varies in the horizontal, then long/hr should vary.
Not necessarily. If an aircraft is flying due west at 200 kts lets say, this equals a long/hr rate of about 3 degrees. This is just a rough guess.
Now if the aircraft turns to a heading of, say....315, and maintains an airspeed of 200 kts, the long/hr rate will decrease proportionately to the variance of the new course from the original course.
Head winds and tail winds will also create discrepancies between indicated airspeed and long/hr rate which is an expression of ground speed along any line of lattitude.
That's what I was thinking about, but wasn't sure how the parameters are measured. FL 77 spent most of the time flying due west and due east, give or take. Therefore, it would seem that there would be a high correlation between long/hr and nm/hr. However, if I'm interpreting Mr. Farmer's analysis correctly, he thinks because there is a high correlation between nm/hr and long/hr that means that somethign fishy is going on with the data.
I'm I getting this right, or am I missing something?
Guys you can't say I did not try. I can't teach you guys first year college physics and statistics in a forum. Pointed out looooooong ago, we are
talking about velocity components. Speen and heading form a vector. Vectors have components. We are working with components here.
These are simple concepts, so I my guess is you guys are just playing games and wasting my time. Good luck with your "investigation".
These are simple concepts, so I my guess is you guys are just playing games and wasting my time. Good luck with your "investigation".
Originally posted by spcengineer
Guys you can't say I did not try. I can't teach you guys first year college physics and statistics in a forum. Pointed out looooooong ago, we are talking about velocity components. Speen and heading form a vector. Vectors have components. We are working with components here.
These are simple concepts, so I my guess is you guys are just playing games and wasting my time. Good luck with your "investigation".
As a matter of fact, I CAN say you didn't try. Your blog posts are less than clear, and in the time it would take to clarify this issue you instead chose to write a condescending reply. I will be willing to bet there isn't another peson on the planet, including Rob Balsamo, who can explain the point you're trying to make about the data being fitted.
It's always a bit suspicious when somebody dodges a simple question with the "you're too stupid to understand how smart I am" attitude. I am smart, I have two engineering degrees, have taken many statistics courses, and use pretty high end statistical analysis in the financial arena, and I'm having a hard time following the methodology and reasoning in your blog posts.
Let's start with something simple.
Why did you graph True Heading instead of Magnetic Heading in your blog entry about the data being fitted? Is there a reason for this? Nothing else in the data is referenced to True Heading, so I'm not sure right from the start why you chose this methodology.
Originally posted by spcengineer
Guys you can't say I did not try. I can't teach you guys first year college physics and statistics in a forum. Pointed out looooooong ago, we are talking about velocity components. Speen and heading form a vector. Vectors have components. We are working with components here.
These are simple concepts, so I my guess is you guys are just playing games and wasting my time. Good luck with your "investigation".
I'm sorry, I just haven't been following that closely. Since I've found the Pilots aren't arguing anything in particular, just looking endlessly at data of known dubiousness, inconsistency, etc, the whole thing just seems so boring and irrelevant. I need to scan back before I can say whether I agree with whoever on whatever on this point. I assure you sir, I am not playing games. Nick seems to have spotted some errors, which I can neither confirm nor deny. will be checking into your blog when I can try to absorb it. Some interesting stuff I've seen so far, just watch it's not misused too often. I appreciate your animation anlysis. Saw something else good once at 911files, but forget what.
One thing about this line of inquiry: it's scientific. Tho I only grasp what I do, it's grasped. Tangible. Verifiable. I've been dealing with others whose angle is psychological, undebunkable, subjective, apriori, whatever. No headway possible. This is numbers, formuas, known methods, - Herbert Hover said it I believe, an engineer has to have it right, he cannot spin his failures, they are there for the world to see. Not that I could see necessarily, without the applicable formulas and such, but I know what makes sense and that guides me.
Thanks for sharing, again, and I may be in touch if I have any Qs or anything.
Peace
[edit on 11-6-2007 by Caustic Logic]
Originally posted by spcengineer
Please bear with me spcengineer as I didn't take any college physics or statistics. Also I am not a rocket scientist but I do know one: Bob Lazar. My major was Industrial Design and it didn't include any mathematics.
In reading these three statements, the top 2 from this thread and the bottom one from your blog, I have a question spengineer:
Did you think that 1 degree of longitude is equal to 1 degree of latitude? The tip off is your 2 statements "The longitude data exhibits a non-normal distribution and appears “fitted” and "crashing somewhere well west of the Pentagon."
Also would you please give me the channel from the FDR that you got these coordinates from and include the coordinates themselves. I am referring to your statement "The csv simply by the beginning and ending coordinates (latitude and longitude) being erroneous indicates a problem."
Thanks for all your help.
Guys you can't say I did not try. I can't teach you guys first year college physics and statistics in a forum. Pointed out looooooong ago, we are talking about velocity components. Speen and heading form a vector. Vectors have components. We are working with components here.
These are simple concepts, so I my guess is you guys are just playing games and wasting my time. Good luck with your "investigation".
The csv simply by the beginning and ending coordinates (latitude and longitude) being erroneous indicates a problem. My analysis simply compared physics data with instrument data to see if they matched. There were areas they did not, and in the case of the longitude data, significant deviations were noted.
Nick, physics is physics. If nm/hr (knots) varies in the horizontal, then long/hr should vary. If nm/hr is variable and long/hr is not, then that does not take a rocket scientist to know that there is a problem.
In the case of the NTSB data, it is clearly unreliable data for my purposes. Here is why.
1. The FDR csv file has the plane taking off from a field west of Dulles and crashing somewhere well west of the Pentagon (look at the coordinates stupid). The longitude data exhibits a non-normal distribution and appears “fitted”. So for what should be obvious reasons, there is a problem with that data.
Please bear with me spcengineer as I didn't take any college physics or statistics. Also I am not a rocket scientist but I do know one: Bob Lazar. My major was Industrial Design and it didn't include any mathematics.
In reading these three statements, the top 2 from this thread and the bottom one from your blog, I have a question spengineer:
Did you think that 1 degree of longitude is equal to 1 degree of latitude? The tip off is your 2 statements "The longitude data exhibits a non-normal distribution and appears “fitted” and "crashing somewhere well west of the Pentagon."
Also would you please give me the channel from the FDR that you got these coordinates from and include the coordinates themselves. I am referring to your statement "The csv simply by the beginning and ending coordinates (latitude and longitude) being erroneous indicates a problem."
Thanks for all your help.
The final co-ordinates I have are:
That is as close as it gets. I'm surprised this data isn't higher resolution.
I've had a look at the video again and can't see anything that jumps out regarding heading vs. the animation itself. I used the gridlines within the video as a reference, even going to great lengths to see the aspect of the satellite imagery at the start of the video, but I can't see anything immediately wrong with it. The video appears to be internally consistent.
What did I miss?
[edit on 11-6-2007 by mirageofdeceit]
38.86
-77.08
That is as close as it gets. I'm surprised this data isn't higher resolution.
I've had a look at the video again and can't see anything that jumps out regarding heading vs. the animation itself. I used the gridlines within the video as a reference, even going to great lengths to see the aspect of the satellite imagery at the start of the video, but I can't see anything immediately wrong with it. The video appears to be internally consistent.
What did I miss?
[edit on 11-6-2007 by mirageofdeceit]
Originally posted by mirageofdeceit
I've had a look at the video again and can't see anything that jumps out regarding heading vs. the animation itself.
I used the gridlines within the video as a reference, even going to great lengths to see the aspect of the satellite imagery at the start of the video, but I can't see anything immediately wrong with it. The video appears to be internally consistent.
What did I miss?
[edit on 11-6-2007 by mirageofdeceit]
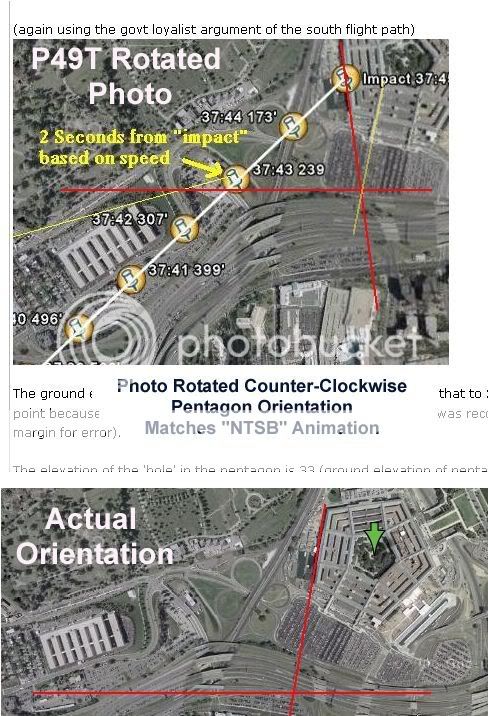
You missed the relative angles that the Dulles runway and the Pentagon are in relation to each other in real life compared to the angles shown in the animation video. The Pentagon is rotated more than 10 degrees counter-clockwise in the animation compared to how it sits in real life in relation to the Dulles runway 30. This is based on the heading indicator shown in the video.
Originally posted by mirageofdeceit
The final co-ordinates I have are:
38.86
-77.08
That is as close as it gets. I'm surprised this data isn't higher resolution.
That longitude - that's 77 degrees, right? So for what it's worth, a 77 foot tall building at 77 degrees hit by Flight 77. Didn't Rummy first serve as SecDef there in '77? Probably nothing...
I've had a look at the video again and can't see anything that jumps out regarding heading vs. the animation itself. I used the gridlines within the video as a reference, even going to great lengths to see the aspect of the satellite imagery at the start of the video, but I can't see anything immediately wrong with it. The video appears to be internally consistent.
What did I miss?
I don't know, nor do I know what I'm missing. You were there at the beginning, so how is this internally consistent?
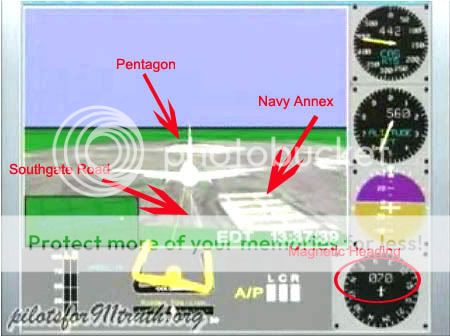
Dial mag heading of 70 mag, visual heading that becomes 90 mag; 20 degrees off. Whether this is from final map rotation relative to plane path, visual path shifted or, as I believe Farmer found, that the heading dial was altered relative to visual and presumed real path, I dunno. It was right on at the beginning and got off during the course of flight. A real plane can't do that, so it's a sign that something's wrong.
John Farmer's analysis here.
Originally posted by Caustic Logic
Dial mag heading of 70 mag, visual heading that becomes 90 mag; 20 degrees off.
Are you sure the visual heading is 90 and not 80? The reason I ask is because there are several close-up photos of the Pentagon floating around that are rotated counter-clockwise by 10 degrees, with North on the map pointing more towards magnetic north.
Pretty sure - my map is from Google maps, geo north - 70 mag/60 real maps out w/official path, and 80 real/90 mag is what the flight path shows.
I sure hope that' right 'cause I've hung my hat on it...
I sure hope that' right 'cause I've hung my hat on it...
Originally posted by Caustic Logic
Pretty sure - my map is from Google maps, geo north - 70 mag/60 real maps out w/official path, and 80 real/90 mag is what the flight path shows.
I sure hope that' right 'cause I've hung my hat on it...
These are the two different maps that I've seen:
I would saythat the visual flight path matches up to less than 90 degrees magnetic on the lower map, which has true north vertical. I didn't put a line on it where I thought the flight path was because I didn't want to influence where you think it is. Want to draw a line on the lower map so we can have a confirmed visual flight path for discussion purposes?
Originally posted by nick7261
I would saythat the visual flight path matches up to less than 90 degrees magnetic on the lower map, which has true north vertical. I didn't put a line on it where I thought the flight path was because I didn't want to influence where you think it is. Want to draw a line on the lower map so we can have a confirmed visual flight path for discussion purposes?
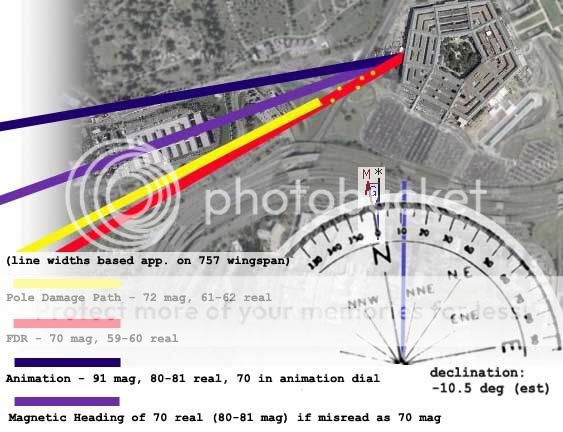
Here's the original graphic with the Google earth map I used. The path I just drew in by what the animation showed, so it may be off by like a few degrees. It's 80 real, and so about 90 mag, and oriented North as the lower picture above. Correct?
Originally posted by Caustic Logic
Here's the original graphic with the Google earth map I used. The path I just drew in by what the animation showed, so it may be off by like a few degrees. It's 80 real, and so about 90 mag, and oriented North as the lower picture above. Correct?
You're original graphic is accurate as far as I can tell. Between the mag and the real, and the rotated pics, it's easy to lose track of what headings are being referred to at times. The animation is 20 degrees different from the official flight path at the end of the flight, but in line with the official flight path at the start of the flight based on the orientation of the visual objects shown on the ground.
But how do we know that the objects are oriented properly? Maybe the animation actually shows the plane coming in along the official path, but the map in the video is not oriented properly? Is there a way we can confirm what is off, the map or the flight path?
I just completed a slightly more indepth comparative study of the UA93 and AA77 data. It might help Nick in understanding the discussion of velocity
components from earlier in the topic.
Summary - Post Summary
Full (pdf) - Comparative Study
Summary - Post Summary
Full (pdf) - Comparative Study
Originally posted by spcengineer
Thanks for the post spcengineer. What exactly are we looking at here? What are we comparing and to what end? What do we expect to find? How do velocity components fit into "NTSB animation is wrong". How would the comparison of 93 and 77 help in whatever we are trying to do?
Also, don't forget my questions from 2 weeks ago. It would be important to know if you thought 1 degree of latitude equaled 1 degree of longitude. Thanks.
I just completed a slightly more indepth comparative study of the UA93 and AA77 data. It might help Nick in understanding the discussion of velocity components from earlier in the topic.
Thanks for the post spcengineer. What exactly are we looking at here? What are we comparing and to what end? What do we expect to find? How do velocity components fit into "NTSB animation is wrong". How would the comparison of 93 and 77 help in whatever we are trying to do?
Also, don't forget my questions from 2 weeks ago. It would be important to know if you thought 1 degree of latitude equaled 1 degree of longitude. Thanks.
Sorry Lear, I just run the data...
All I have to say on the subject is in the study. I'll leave it to others to speculate.
All I have to say on the subject is in the study. I'll leave it to others to speculate.
new topics
-
God's Righteousness is Greater than Our Wrath
Religion, Faith, And Theology: 3 hours ago -
Electrical tricks for saving money
Education and Media: 6 hours ago -
VP's Secret Service agent brawls with other agents at Andrews
Mainstream News: 7 hours ago -
Sunak spinning the sickness figures
Other Current Events: 8 hours ago -
Nearly 70% Of Americans Want Talks To End War In Ukraine
Political Issues: 8 hours ago -
Late Night with the Devil - a really good unusual modern horror film.
Movies: 10 hours ago -
Cats Used as Live Bait to Train Ferocious Pitbulls in Illegal NYC Dogfighting
Social Issues and Civil Unrest: 11 hours ago
top topics
-
VP's Secret Service agent brawls with other agents at Andrews
Mainstream News: 7 hours ago, 9 flags -
Cats Used as Live Bait to Train Ferocious Pitbulls in Illegal NYC Dogfighting
Social Issues and Civil Unrest: 11 hours ago, 8 flags -
Electrical tricks for saving money
Education and Media: 6 hours ago, 4 flags -
HORRIBLE !! Russian Soldier Drinking Own Urine To Survive In Battle
World War Three: 15 hours ago, 3 flags -
Nearly 70% Of Americans Want Talks To End War In Ukraine
Political Issues: 8 hours ago, 3 flags -
Sunak spinning the sickness figures
Other Current Events: 8 hours ago, 3 flags -
Late Night with the Devil - a really good unusual modern horror film.
Movies: 10 hours ago, 2 flags -
The Good News According to Jesus - Episode 1
Religion, Faith, And Theology: 13 hours ago, 1 flags -
God's Righteousness is Greater than Our Wrath
Religion, Faith, And Theology: 3 hours ago, 0 flags
active topics
-
VP's Secret Service agent brawls with other agents at Andrews
Mainstream News • 41 • : ThatSmellsStrange -
HORRIBLE !! Russian Soldier Drinking Own Urine To Survive In Battle
World War Three • 32 • : DaRAGE -
New whistleblower Jason Sands speaks on Twitter Spaces last night.
Aliens and UFOs • 55 • : baablacksheep1 -
Cats Used as Live Bait to Train Ferocious Pitbulls in Illegal NYC Dogfighting
Social Issues and Civil Unrest • 20 • : Asher47 -
Nearly 70% Of Americans Want Talks To End War In Ukraine
Political Issues • 12 • : Asher47 -
Electrical tricks for saving money
Education and Media • 4 • : Lumenari -
DONALD J. TRUMP - 2024 Candidate for President - His Communications to Americans and the World.
2024 Elections • 514 • : WeMustCare -
The Acronym Game .. Pt.3
General Chit Chat • 7744 • : bally001 -
Truth Social goes public, be careful not to lose your money
Mainstream News • 128 • : Astyanax -
Sunak spinning the sickness figures
Other Current Events • 5 • : glen200376