It looks like you're using an Ad Blocker.
Please white-list or disable AboveTopSecret.com in your ad-blocking tool.
Thank you.
Some features of ATS will be disabled while you continue to use an ad-blocker.

No Evidence That Global Warming is manmade
page: 24share:
Originally posted by Gonjo
Oh I see so the official graph that shows a steady slowly increasing graph of CO2 instead thats clearly going up even when the temperatures were actually going down in the 1940-1980 and claim that it shows that CO2 is to blame here and shows the truth?
I'll set you some work, as it seems to be a case of you throwing questions and ignoring answers. Try to find out what the current explanation is. What you are doing again is falling back on a strawman view that only CO2 can affect climate. Maybe read a bit of the 'realclimate' blog.
Even though the whole icecore, treering and coral data is pretty much a joke to anyone because theres actual temperature measurements and CO2 flask measurements from the 1800 which everyone seems to forget about, maybe because the data shows that in the 1800 we had way higher CO2 than we have now and that the temperatures werent really skyrocketing at that time. Whats more interesting the CO2 went down until about the start of the 1900 century and now its dipping back up again.
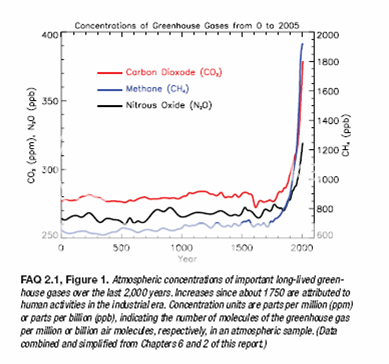
We have 2000 years of good CO2 data. From IPCC 4AR:
36-66% and 9-26% wow thats really narrowing it down!
What would you rather them do? Ignore the fact there is overlapping IR absorption?
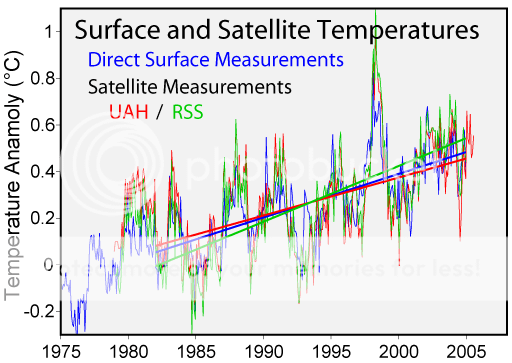
If CO2 had anything to do with the temperature raise we would have raising temperatures in the athmosphere, which we dont so why dont we stop this nonsense and face the facts the sun is radiating more, which causes the temperature rise as shown better than any CO2 nonsense which have no scientific proof behind it.
Depends which part of the atmosphere you are talking about, satellite data does show warming in the troposphere.
[edit on 8-6-2007 by melatonin]
I usually do not act in such a manner to assasinate one's character, but what I've read so far is something I'd hear in a high school auditorium
between debating 16 year olds.
Global warming is not this , and it's that....listen up now. I know what is causing global warming. I will not say what it is, and I have my reasons, but I am surprised none of you elite scientists mentioned it as a theory as of yet.
You people have the potential to break away from this enslavement, but you fail to seek or care to try to get out. You need to seek the proper factors and an equation will form. The equation is the cause of global warming. You people have the factors all over the net, but fail to come up with the answer. The information is out there.
Originally posted by melatonin
That's because the oceans are not saturated at this point, they are still able to remove more than they release. However, they seem to be becoming less efficient absorbers over time.
The oceans have absorbed much higher levels of CO2 and they are still working just fine... but of course melatonin does not address that fact, nor the fact that the global climate is fluctuating even when anthropogenic CO2 is still being released, and more so by countries like China and India who are increasing exponentially their emissions of CO2.
Experiments show that even a doubling of CO2 doe snot cause the wamring that melatonin and associates claim.
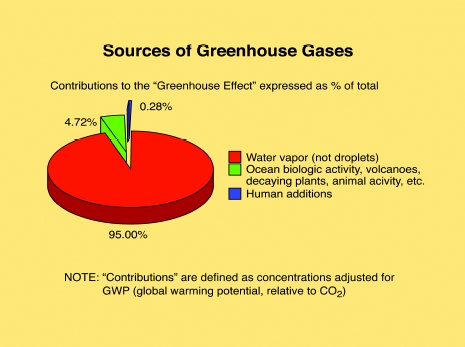
This is the amount of anthropogenic CO2 in reference to the most important GHG which is water vapor, and you can also see the amount of other natural GHGs, which includes CO2 btw, according to the Kansas Geological survey group.
[edit on 9-6-2007 by Muaddib]
Originally posted by Muaddib
The oceans have absorbed much higher levels of CO2 and they are still working just fine...
Southern Ocean Carbon Sink Weakened
Science Daily — Scientists have observed the first evidence that the Southern Ocean’s ability to absorb the major greenhouse gas, carbon dioxide, has weakened by about 15 per cent per decade since 1981.
www.sciencedaily.com...
I don't know why you bother.
Experiments show that even a doubling of CO2 doe snot cause the wamring that melatonin and associates claim.
I see the intellectual honesty never lasted long...
Yeah, in the central US grasslands, but I don't happen to live in one, and neither do the vast majority of people. Climate sensitivity is of the order of 2-4.5'C globally.
This is the amount of anthropogenic CO2 in reference to the most important GHG which is water vapor, and you can also see the amount of other natural GHGs, which includes CO2 btw, according to the Kansas Geological survey group.
I've seen that graph before and we went through why it is very misleading.
CO2 can be attributed to about 40% of current warming. Removing CO2 from climate models shows CO2 accounts for 9-26% of the GE, Ramanathan & Croakley (1978) found a value of 12%.
It's not hard to work out a rough guide, we increased CO2 ca. 30% from pre-industrial levels. So 0.30 x 9 and 0.30 x 26 = between about 3% and 8% of the greenhouse effect is due to human sourced CO2.
3-8% is much bigger than 0.28%.
[edit on 9-6-2007 by melatonin]
I haven't heard one discussion yet about the Aurora's at the poles. You people are forgetting about electromagnetic smog.
Link to PDF file of CO2 chemical measurements from 1800
Im sorry but I will go with the actual measured CO2 and not with the icecore estimates, thank you very much.
Which actually makes the point to forget about CO2 driving the temperature and atleast shows that its nowhere near record highs even on this century.
Image for those who just want a picture of the chart with the measured CO2 from the above document.
[edit on 10/6/07 by Gonjo]
Ok many other planets are heating up as well, due to solar activity increasing. I fail to see how we as humans have an effect on the sun. There are
many people that support this theory.
news.nationalgeographic.com...
www.space.com...
www.livescience.com...
www.lewrockwell.com...
www.redicecreations.com...
news.nationalgeographic.com...
www.space.com...
www.livescience.com...
www.lewrockwell.com...
www.redicecreations.com...
Originally posted by AcesInTheHole
Ok many other planets are heating up as well, due to solar activity increasing. I fail to see how we as humans have an effect on the sun. There are many people that support this theory.
Indeed. But it doesnt really matter, we have a believer here who keeps telling us about these magic models that can tell us the future. No matter what you produce here it will only end up with some computer model from some expert climatologist telling how he has calculated our climate. Same climatologists told us in the 1970 that we had an iceage on our hands but hey, why would we reguire them to give us any evidence besides their "scientific consensus" on the issue. Hell we used to have a "scientific consensus" on pretty much all the ridiculous claims that they cant really give any proof on. Just like back in the 1970.
Originally posted by AcesInTheHole
Ok many other planets are heating up as well, due to solar activity increasing. I fail to see how we as humans have an effect on the sun. There are many people that support this theory.
Solar activity has been fairly constant for several decades.It reached a peak in about 1940-1950 and has not been above that since.
To increase the temperature of Pluto 2'C would take a massive increase in solar activity, so much that we would be toasting.
As for the Glenn Beck article earlier, the paper is a joke. I can't be bothered going through it for you, so this will have to do. The reason it's published in the questionable journal E&E is very obvious.
The list of arguments against such variability in the carbon cycle is too long even for a post on RC but here are a few of the main ones:
The fluxes necessary to produce such variations are just unbelievably huge. Modern fossil fuel emissions are about 7.5GT (Giga Tons) Carbon per year which would correspond to about 3.5ppm increase per year (except that about half is absorbed by natural sinks in the ocean and the terrestrial biosphere). Beck’s supposed 150ppm source/sink in a decade corresponds therefore to a CO2 production/absorption about ten times stronger than the entire global industrial production of 2007 (putting aside for the moment additional complications since such CO2 levels had to be equilibrated at least partly with the ocean and the real CO2 source must even be larger).
Such huge biospheric fluxes would leave an enormous 13C signal in the atmosphere. Nothing remotely like that is observed in tree ring cellulose data.
Beck makes an association of some of the alleged huge CO2 peaks with volcanic eruptions. The Mauna Loa CO2 record started by Charles Keeling 1955 (cdiac.ornl.gov... cdiac.ornl.gov... ) however doesn’t show much variability associated with the big eruptions of El Chichon, Agung or Pinatubo. (Readers should know however that on much longer, geologic, timescales, CO2 levels are heavily influenced by volcanic and tectonic activity, but that is not important on the interannual (or even centennial) timescale).
The paper suggests that the CO2 peak in the 1940 is forced by the first temperature rise in the 20th century. That would make 150ppm due to a temperature shift of 0.4°C. What happened then with the next rise from the 1970s to today? The observed about 0.5°C rise corresponded to “only” 70ppm always assuming that fossil fuel combustion does not leave any remains in the atmosphere....
And most importantly, we know from ice core analysis the CO2 concentration from the pre-industrial to modern times. The results of three different Antarctic cores broadly confirm the picture of an accelerating rise of CO2 above levels of natural variability over the last 650.000 years.
www.realclimate.org...
[edit on 10-6-2007 by melatonin]
Ok so you just write of several nobel price winners data as a joke. You sir are a quite bold and obviously more correct than 200 years of actual
research data. Like I said earlier you cant do anything to chance the views of a believer. Anything not fitting his view is just air.
Originally posted by Gonjo
Ok so you just write of several nobel price winners data as a joke. You sir are a quite bold and obviously more correct than 200 years of actual research data. Like I said earlier you cant do anything to chance the views of a believer. Anything not fitting his view is just air.
No, bascially measurements of CO2 need to be taken in controlled conditions, using the most effective and reliable techniques. The early data was not as reliable as the measurements we take now. There is little reason to accept that CO2 can increase by almost 200ppm in 15 years, then decrease just as quick. That data is jarred and totally unreliable. I could go and measure 500ppm of CO2 in the middle of London at rush hour, but I wouldn't expect it to be relevant.
But basically, Gonjo, believe what you want dude. Science will just ignore such obviously crap data, it has some standards.
Just explain the one criticism. Tree ring C-13 data does not show such an increase in CO2 from the biosphere. Why not? It would be impossible to miss...
[edit on 10-6-2007 by melatonin]
Co2 is IRRELEVENT. Why doesn't anyone speak about the DROUGHTS, the HONEYBEE CCD DISORDER, why hasn't anyone mentioned weather control. Why doesn't
anyone know the effects of HAARP and why doesn't anyone have education on how oil reserves are detected? You are right, global warming is not man
made.
THIS IS HOW THE WORLD RESETS ITSELF !
Get ready to pay 100$ for a bottle of water. Start becoming Vegetarians right now as well.
THIS IS HOW THE WORLD RESETS ITSELF !
Get ready to pay 100$ for a bottle of water. Start becoming Vegetarians right now as well.
Electromagnetic smog is overlooked. Please read up on that, Droughts are killing US exports and a 3rd world existence is what's in store. Now for the
people in the Greenzones, they still have to worry because their money will be used on survival, not technological gadgets and automobiles.
news.aol.com... topnews/articles/_a/a-drought-for-the-ages-spreads-across-us/20070610103409990001?ncid=NWS00010000000001
news.aol.com... topnews/articles/_a/a-drought-for-the-ages-spreads-across-us/20070610103409990001?ncid=NWS00010000000001
All I want the climatologists to explain what has caused the rise in deep ocean temperature by 1 degree since 1900 globally.
Oh and how that is caused by CO2 and Greenhouse effect.
[edit on 11/6/07 by Gonjo]
Oh and how that is caused by CO2 and Greenhouse effect.
[edit on 11/6/07 by Gonjo]
Originally posted by Gonjo
Ok so you just write of several nobel price winners data as a joke. You sir are a quite bold and obviously more correct than 200 years of actual research data. Like I said earlier you cant do anything to chance the views of a believer. Anything not fitting his view is just air.
Gonjo, that's melatonin way to deal with data and research which refutes his claim.
Despite the fact that several research shows the Solar output, and the amount of solar flares has increased during the past 60 years more than for 1,000 for Solar Flares, and 8,000 years for the output of the sun, melatonin always tries to dismiss such data.
When he is shown several dozen research all which say the RWM, the MWP, and the LIA were global, he sides with Mann and associates and claims this is not true. If much of that same research shows that temperatures were on the overall much warmer all over the globe he posts more Mann et al data trying to dismiss the data/research which refutes his claims.
Although distance does play some part with how the sun warms other planets, it is not the main reason why or how planets are warmed by the sun.
As a matter of fact if the Earth didn't have it's GHGs, we wouldn't be able to exist on this planet, and temperatures would be 33C cooler.
If the output of the Sun increases, as well as Solar flares, every planet with an atmosphere will be affected by this increase without the "earth burning up" as melatonin claims...
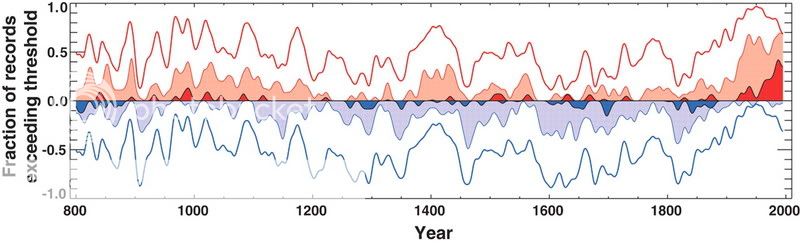
Originally posted by melatonin
Science 10 February 2006:
Vol. 311. no. 5762, pp. 841 - 844
DOI: 10.1126/science.1120514
Reports
The Spatial Extent of 20th-Century Warmth in the Context of the Past 1200 Years
Timothy J. Osborn* and Keith R. Briffa
Periods of widespread warmth or cold are identified by positive or negative deviations that are synchronous across a number of temperature-sensitive proxy records drawn from the Northern Hemisphere. The most significant and longest duration feature during the last 1200 years is the geographical extent of warmth in the middle to late 20th century. Positive anomalies during 890 to 1170 and negative anomalies during 1580 to 1850 are consistent with the concepts of a Medieval Warm Period and a Little Ice Age, but comparison with instrumental temperatures shows the spatial extent of recent warmth to be of greater significance than that during the medieval period.
Originally posted by Muaddib
Melatonin still trying to pull April's fools again?...
Accumulation and 18O records for ice cores from Quelccaya ice cap. The period of the Little Ice Age stands out clearly as an interval of colder temperature (lower 18O) and higher accumulation. Such evidence demonstrates the Little Ice Age was a climatic episode of global significance. From World Data Center for Paleoclimatology (educational slide set).
academic.emporia.edu...
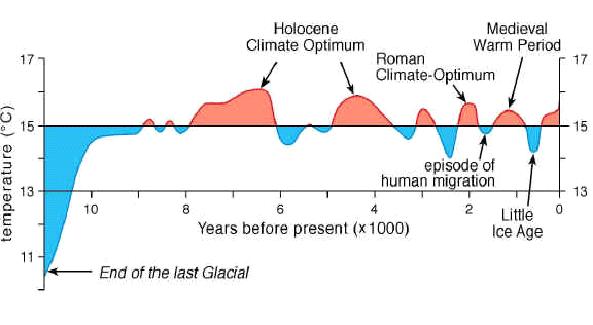
Let me get this straight... It appears the first graph shows deviations per year from "some mean", and the 2nd shows the actual temperature.
That seems to be important to distngiush because the first would be strictly for comparing CO2 lag, while the second would be better for determining how hot it actually was during that time and today. I've seen the first type presented in many places as if it's something to be dazzled by. It would then be deceptive to even show the first without the CO2 chart lined up under it with precision.
Am I confused here?
[edit on 12-6-2007 by IgnoranceIsntBlisss]
[edit on 12-6-2007 by IgnoranceIsntBlisss]
Originally posted by Muaddib
This is the amount of anthropogenic CO2 in reference to the most important GHG which is water vapor, and you can also see the amount of other natural GHGs, which includes CO2 btw, according to the Kansas Geological survey group.
Do you recall where that came from? That's important data if it's 100% true.
Originally posted by IgnoranceIsntBlisss
Let me get this straight... It appears the first graph shows deviations per year from "some mean", and the 2nd shows the actual temperature.
The article I posted shows the deviation from a threshold temperature. It shows what the proxies indicate during these particular periods.
What I would like is for you to actually try to find where the data for the second graph comes from, try to chase it down to its original scientific journal. The data I posted can easily be sourced, good luck for muaddib's data, heh.
I likey that you've quoted Muaddib's cherrypicked Quelccaya ice-core, ask him about the fact that when the rest of Lonnie Thompson's ice core data is used it confirms Mann's reconstruction, heh.
As for the 0.28% data in the pie chart, you know yourself that this is wrong. Ramanathan & Croakley's (1978) data show CO2 at 12% of the greenhouse effect. This 0.28% figure is produced by some BS maths on some website by a group of amateurs. It is not from a scientific source.
That seems to be important to distngiush because the first would be strictly for comparing CO2 lag, while the second would be better for determining how hot it actually was during that time and today. I've seen the first type presented in many places as if it's something to be dazzled by. It would then be deceptive to even show the first without the CO2 chart lined up under it with precision.
Am I confused here?
The graph I posted has nothing to do with CO2 lag. It is attempting to show that current warming is over a greater spatial extent than any time in the last 1000 or so years. What we know is that current warming is likely to a greater spatial extent, greater synchronicity, a to higher level than for 1000 years.
If you want to know the likely temperature trends over the past 1000 years, it is contained in the IPCC report, there are a dozen high quality high resolution multi-proxy reconstructions that provide insight into this question:
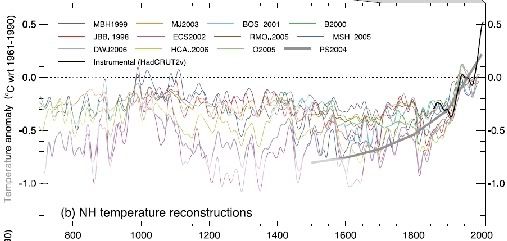
All are present in the scientific literature from various researchers. This is why you need to read the actual science, and not BS from unreliable amateur websites. Try to source the data back to the original science, if it is in anyway reliable you will find it.
[edit on 12-6-2007 by melatonin]
Ok pick a point anywhere on the graph, any position of any line. Place a dot there. Now go across the graph and find another spot with the same
horizontal plot; place a dot there. Is the temperature at each dot precisely the same?
For example, one timeframe its +.1, next it's +.4 ... +.07 ... +.3 ... etc.
My point is does the position of that line corespond to a precise measurment of temp, or is it going up,up,up,down,up,up,up,etc in an accumlative fashion? The reason for scrutiny is they never seem to explain what the actual temperature is 'wherever', which for me opens up a possibility that there's some sort of algorithmic process in the graph.
new topics
-
Israel attacking Iran again.
Middle East Issues: 32 minutes ago -
Michigan school district cancels lesson on gender identity and pronouns after backlash
Education and Media: 36 minutes ago -
When an Angel gets his or her wings
Religion, Faith, And Theology: 1 hours ago -
Comparing the theology of Paul and Hebrews
Religion, Faith, And Theology: 2 hours ago -
Pentagon acknowledges secret UFO project, the Kona Blue program | Vargas Reports
Aliens and UFOs: 3 hours ago -
Boston Dynamics say Farewell to Atlas
Science & Technology: 3 hours ago -
I hate dreaming
Rant: 4 hours ago -
Man sets himself on fire outside Donald Trump trial
Mainstream News: 6 hours ago -
Biden says little kids flip him the bird all the time.
Politicians & People: 6 hours ago -
The Democrats Take Control the House - Look what happened while you were sleeping
US Political Madness: 6 hours ago
top topics
-
The Democrats Take Control the House - Look what happened while you were sleeping
US Political Madness: 6 hours ago, 17 flags -
In an Historic First, In N Out Burger Permanently Closes a Location
Mainstream News: 8 hours ago, 14 flags -
Biden says little kids flip him the bird all the time.
Politicians & People: 6 hours ago, 8 flags -
A man of the people
Medical Issues & Conspiracies: 14 hours ago, 8 flags -
Man sets himself on fire outside Donald Trump trial
Mainstream News: 6 hours ago, 7 flags -
Pentagon acknowledges secret UFO project, the Kona Blue program | Vargas Reports
Aliens and UFOs: 3 hours ago, 5 flags -
4 plans of US elites to defeat Russia
New World Order: 15 hours ago, 4 flags -
Sheetz facing racial discrimination lawsuit for considering criminal history in hiring
Social Issues and Civil Unrest: 6 hours ago, 3 flags -
Boston Dynamics say Farewell to Atlas
Science & Technology: 3 hours ago, 3 flags -
Are you ready for the return of Jesus Christ? Have you been cleansed by His blood?
Religion, Faith, And Theology: 11 hours ago, 3 flags
active topics
-
Candidate TRUMP Now Has Crazy Judge JUAN MERCHAN After Him - The Stormy Daniels Hush-Money Case.
Political Conspiracies • 403 • : Threadbarer -
Israel attacking Iran again.
Middle East Issues • 11 • : theatreboy -
Cat Movies
Movies • 19 • : 5thHead -
Man sets himself on fire outside Donald Trump trial
Mainstream News • 33 • : ByeByeAmericanPie -
Pentagon acknowledges secret UFO project, the Kona Blue program | Vargas Reports
Aliens and UFOs • 6 • : Ophiuchus1 -
Israeli Missile Strikes in Iran, Explosions in Syria + Iraq
World War Three • 104 • : CCoburn -
The Acronym Game .. Pt.3
General Chit Chat • 7732 • : RAY1990 -
Michigan school district cancels lesson on gender identity and pronouns after backlash
Education and Media • 3 • : Consvoli -
Are you ready for the return of Jesus Christ? Have you been cleansed by His blood?
Religion, Faith, And Theology • 20 • : RAY1990 -
The Democrats Take Control the House - Look what happened while you were sleeping
US Political Madness • 63 • : NoCorruptionAllowed