It looks like you're using an Ad Blocker.
Please white-list or disable AboveTopSecret.com in your ad-blocking tool.
Thank you.
Some features of ATS will be disabled while you continue to use an ad-blocker.

No Evidence That Global Warming is manmade
page: 14share:
Originally posted by melatonin
Yeah, thanks. This would be important if we were worried about the visible wavelengths rather than IR.
in case you still don't want to get it: these absorption pattersn are only applicable if the substance in question is a gas.
clouds block out much more than visible light, or can you still feel the sun's warmth (IR light) under heavy cloud cover, say before a thunderstorm?
the fact that clouds provide good overall insulation can be proven easily by observing night temperature patterns with clear skies vs. overcast conditions: night frost is much more likely under clear skies, for example.
[edit on 11.4.2007 by Long Lance]
Originally posted by TheAvenger
1. They point out that solar radiation is the dominating source of heat and light to the planet. 99.95% is the figure they give for Earth's energy derived from the sun. The heating and cooling of the atmosphere are mostly due to insolation of the Earth.
No-one doubts that solar effects are very important. The fact that most energy is derived from the sun is a red-herring for this issue, the issue is the enhancement of the GE.
And I'm sure you know, as you stated something similar earlier - without the GE, the earth's atmosphere would be quite a bit cooler.
2. They cite models, other sources and state that a 1% increase in solar radiation increases the temp of the planet 0.86 degrees C.
You would first need to show that a 1% increase is what we are seeing. Most research shows that even the last two 11 year cycles show no more than 0.1% variation. The highest contribution to current warming in the recent literature is around 25-35% (Scafetta & West, 2006), this is also seen as being a little high. Solar effects can account for much of the warming before 1975.
3. They state that the combined energy produced by humankind is very small compared to solar energy. All man-made activities combined used to heat the atmosphere would increase the atmospheric temperature by 0.01 degree C or less.
This is totally irrelevant. We are not assessing direct heating of the atmosphere, which is what they focus on. The major issue is changes in GE and other human effects - which they do not even talk about.
4. They talk of Orbital deviations and mass redistribution of the Earth. A chart is shown comparing the deviation of temp to solar magnetic cycles. They match very closely. They say that natural cycles control temps and the recent (last century) 0.56 degree C change is meaningless.
Salient, ....and compelling.
From some flaky graph that provides no indication, apart from the 'Marshall Institute' for where this data comes from. I'd rather take my science from scientific sources than right-wing think-tanks. The same can be said of Gerhard's temperature reconstruction, totally unsupported by any reliable proxy studies 0f the last 10 years.
Like the temp. reconstruction, the solar data is not reflected in the literature in the slightest. Solanki & Krivova (2002; presented earlier), Laut (2003; Damon & Laut, 2004), would be a good place to start. Any correlation clearly broke down in the 70s/80s.
If thats not enough:
They go on to talk of Earth's outgassing,Inner-Earth energy, smoothing of the ocean, microbial activity in the atmosphere, and ice ages. A short discussion of global warming vs. global cooling indicating again that the evidence shows that CO2 in the atmosphere did not cause the global warming of the past 150 years. They conclude that radiation and other forces of nature along with their variations caused the temperature change, that humans account for 0.01 degree C of the change,
Most of which is totally irrelevant.
The earth's outgssing part is particularly telling of the scientific credibility of this article. Comparing the amount of CO2 we have produced in a couple of hundred years to that produced during the 4.5 billion years of the earth is the funniest and most vacuous argument against anthropogenic climate effects I've seen for a while.
There are charts, equations and references are copiously cited everywhere.
Obviously very well done and convincing research. An excellent paper.
I can tell you read little real science if you think this is a coherent argument. It lacks any real scientific weight - focuses on completely irrelevant and incoherent arguments, makes inferences not supported by data, and ignores much of the credible and reliable scientific literature for think-tank sources and obscure russian articles - even going as far as referencing websites like 'junkscience', heh.
This article is only useful to show that peer-review is not a sufficient quality control on science. Maybe it was published so we can see the scientific vacuity of contrarian arguments.
I'll answer your questions later.
[edit on 11-4-2007 by melatonin]
Originally posted by Long Lance
in case you still don't want to get it: these absorption pattersn are only applicable if the substance in question is a gas.
clouds block out much more than visible light, or can you still feel the sun's warmth (IR light) under heavy cloud cover, say before a thunderstorm?
the fact that clouds provide good overall insulation can be proven easily by observing night temperature patterns with clear skies vs. overcast conditions: night frost is much more likely under clear skies, for example.
I don't think I said that clouds have no effect.
The issue is at what wavelengths do clouds absorb radiation. They overlap significantly for water vapour, but not so much for CO2.
I really can't see the issue here. Yes, clouds increase the GE effect.
ABE: This is from an article I posted earlier. It shows the wavelengths at which clouds are active forcings (have a GE).
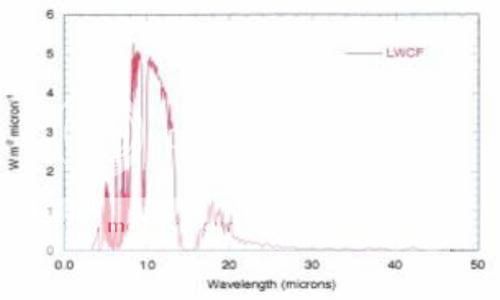
FIG. 3. Longwave cloud forcing (W m-2 mm-1), difference between top-ofatmosphere clear and cloudy outgoing longwave flux.
www.atmo.arizona.edu...
Note that the 15 micron wavelength area is not absorbed strongly by clouds, clouds allow a fairly clear window at this wavelength. This is where CO2 is important- by adding CO2 to the atmosphere, we make this wavelength more opaque.
[edit on 11-4-2007 by melatonin]
Originally posted by melatonin
I don't think I said that clouds have no effect.
The issue is at what wavelengths do clouds absorb radiation. They overlap significantly for water vapour, but not so much for CO2.
I really can't see the issue here. Yes, clouds increase the GE effect.
...
according to the document you linked, they do not,
Thus, combining shortwave and longwave
contributions, the net global effect of clouds in our
current climate, as also determined by space-based
measurements, is a net cooling of the system of -20 W m-2.
regarding 'could conditions' well, the graph shows a marked gap at 15µ, yet a bit earlier they state:
The longwave radiative forcing by other
gases is less affected by the presence of
clouds, but cloud influence is still important
since the total radiative forcing for
clear and cloudy conditions differs by
39 W m-2, a value that is as large as the
longwave cloud forcing. Thus, clouds
have a direct effect on the longwave flux
escaping to space due to their absorption
and emission, and they have an indirect
effect on the flux by shielding absorption
and emission by gases (mainly water vapor).
i may try to verify later (if i can), for now i'll say that the problem with condensed clouds is that they are not uniform, ie. droplet size, distribution and phase state vary. i'd be very surprised if every cloud was the same, tbh, they even say so:
We do not explicitly include the effects
of aerosols in the shortwave budget
calculations because aerosol optical
properties vary greatly due to chemical
composition. Thus it is problematic to
include them in a global budget.
..although 'chemical composition' is not what i had in mind when i was looking for that paragraph..-
anyways, i now have proof of my earlier statement that clouds are not included in the models.
PS: thanx for the .pdf!
Originally posted by melatonin
There is no Briffa et al 1998 in those reconstructions. Briffa et al 2001 is there though.
There is
P.D. Jones, K.R. Briffa, T.P. Barnett, and S.F.B. Tett (1998).
From that same link you gave.
en.wikipedia.org...:2000_Year_Temperature_Comparison.png
Meanwhile their data, shown as a dark blue line, shows that the MWP was as warm as temperatures until the late 90s, Briffa's data alone shows almost no fluctuations and instead a downward trend towards the end of the 20th century.
That graph I gave is from 1998. It is obvious Briffa's data/graph does not corroborate that the 20th century has been warmer, and even when puting their data together, it shows the MWP almost as warm as the 20th century.
[edit on 11-4-2007 by Muaddib]
Originally posted by reaganero
Didn't tesla have a weather machine?
Doesn't the current administration for usa like to prey on christian apocalyptic fears?
I mean, (quotes) it's the end of times (end quotes) folks.
I don't know what all Telsa supposedly invented.
According to popular conspiracy theory here on A.T.S. , I think we have until December 21, 2012 unless the reptilians or the greys invade earlier. There is likely a host of other ideas about it. Just think though, if you want to believe the end is the last day of the Mayan calendar as given above, you can apply for every possible loan and credit card, quit your job, leave your old wife for a 20 year old Hooter's gal. Max those credit cards out and live like a king for your final days. On the other hand, if the Mayan theory is wrong.....well, why plan for that? After all there's a consensus.... Well, somewhere there may be a consensus.....
[edit on 4/11/2007 by TheAvenger]
Originally posted by Long Lance
more material:
www.friendsofscience.org...
they claimed that satellite data is differing from ground samples... if someone could back this up with links, thanx
Yes, Lindzen has noted that in his writings. I will try to find you a source of information on it.
Originally posted by budski
this allows governments to tax us more
this allows governments to impose more controls
need I go on?
I agree with these comments. The good old taxman is grinning from ear to ear as he rubs his hands in anticipation of receiving even more of your hard-earned cash. I know the taxman well, and I think that Caesar is becoming a greedier bastard everyday.
Originally posted by frenzy_boy
you don't even answer questions asking about your degrees.
I have answered that question elsewhere.
I noticed from the very beginning it is you who is actually turning emotional very rapidly. I believe nobody was really trying to be offensive or the way you say it "disgust" you.
Yes, I am a cranky old man. I will try to improve my patience level. I also apologize for posting the sloppy references. I have posted others.
This article is only useful to show that peer-review is not a sufficient quality control on science. Maybe it was published so we can see the
scientific vacuity of contrarian arguments.
It seems no evidence is satisfactory for you. Peer reviewed, refereed, nothing is good enough. Obscure huh? Cited how many times? Right. If you can't discredit rhe science, discredit the scientist(s). Rule #1 of the green playbook.
You believe what you choose to believe, so there's little point in continuing this exchange. Peer reviewed papers show that there is a valid reason to disbelieve A.G.W. I may comment more later if time allows.
[edit on 4/11/2007 by TheAvenger]
Originally posted by Muaddib
There is
P.D. Jones, K.R. Briffa, T.P. Barnett, and S.F.B. Tett (1998).
From that same link you gave.
en.wikipedia.org...:2000_Year_Temperature_Comparison.png
Umm, if that is the case, this is just because you, or whoever did the chart, doesn't know how to use references. For the wiki reference you highlight, it would be Jones et al. (1998).
Meanwhile their data, shown as a dark blue line, shows that the MWP was as warm as temperatures until the late 90s, Briffa's data alone shows almost no fluctuations and instead a downward trend towards the end of the 20th century.
That graph I gave is from 1998. It is obvious Briffa's data/graph does not corroborate that the 20th century has been warmer, and even when puting their data together, it shows the MWP almost as warm as the 20th century.
If the downward trend thing is related to the Briffa data you presented earlier, you'll may have missed it doesn't include any data after 1975. Maybe that's why you have interpreted it in this way. Briffa et al. (1998), is extended in Briffa et al. (2001), I posted that earlier...
I doubt you can look at this data and say the latter 20th century was not warmer. Well, I'm sure you will.
[edit on 11-4-2007 by melatonin]
Originally posted by TheAvenger
It seems no evidence is satisfactory for you. Peer reviewed, refereed, nothing is good enough. Obscure huh? Cited how many times? Right. If you can't discredit rhe science, discredit the scientist(s). Rule #1 of the green playbook.
I'm far from a 'green', heh.
I've given an assessment of the parts you found compelling, what more can I do? The article is barely worth the paper it's written on. If a scientist can't even be bothered to use conventional sources of scientific information, what's the point? We may as well take science from 'Winnie the Pooh'.
Originally posted by Long Lance
according to the document you linked, they do not,
Thus, combining shortwave and longwave
contributions, the net global effect of clouds in our
current climate, as also determined by space-based
measurements, is a net cooling of the system of -20 W m-2.
I think I said earlier that clouds have both reflective and absorbant properties. But I am specifically talking about GE effect, which is a result of absorbance of longwave radiation.
Clouds can reflect shortwave and absorb longwave. The incoming radiation is mainly shortwave, the outgoing is mainly longwave.
So, they still add to the GE. Which is what I said:
I really can't see the issue here. Yes, clouds increase the GE effect.
regarding 'could conditions' well, the graph shows a marked gap at 15µ, yet a bit earlier they state:
The longwave radiative forcing by other
gases is less affected by the presence of
clouds, but cloud influence is still important
since the total radiative forcing for
clear and cloudy conditions differs by
39 W m-2, a value that is as large as the
longwave cloud forcing. Thus, clouds
have a direct effect on the longwave flux
escaping to space due to their absorption
and emission, and they have an indirect
effect on the flux by shielding absorption
and emission by gases (mainly water vapor).
Yes, clouds add to the GE effect, I agreed with this earlier. As the above quote mentions, it mainly shields water vapour effects rather than other GHG effects.
i may try to verify later (if i can), for now i'll say that the problem with condensed clouds is that they are not uniform, ie. droplet size, distribution and phase state vary. i'd be very surprised if every cloud was the same, tbh, they even say so:
We do not explicitly include the effects
of aerosols in the shortwave budget
calculations because aerosol optical
properties vary greatly due to chemical
composition. Thus it is problematic to
include them in a global budget.
..although 'chemical composition' is not what i had in mind when i was looking for that paragraph..-
anyways, i now have proof of my earlier statement that clouds are not included in the models.
Well you would be wrong. Modern GCMs contain interactive clouds, but their simulation is not as good as would be liked.
Gavin Schmidt has a good article on them:
www.physicstoday.org...
PS: thanx for the .pdf!
No problem.
[edit on 11-4-2007 by melatonin]
Originally posted by melatonin
Why does the chart say "contributions to greenhouse effect as % of total"? And why are these figures consistently spread as showing human contributions to GE?
Do note first of all that the title of that graph says Sources of Greenhouse Gases, and the sources of greenhouse gases are.... "contributions to the greenhouse effect as % of the total..."
There is also a note at the end of that graph that furthermore explains: "Contributions" are defined as concentrations adjusted for Global Warming Potential, relative to CO2.
There is only one percentage which is showing "human contribution to the GE", because CO2 is the main anthropogenic greenhouse gas which has been blamed by some scientists as the cause of the current warming...
Anyways, you are trying now to evade the fact that you didn't even understand what each one of those graphs shows...and now you are trying to dismiss this graph when I have given links to it before and i have stated on several occasions who compiled the data and the graph....
ff.org...
That graph alongside some others I have given in the forums, were compiled by the Kansas Geological Survey. That graph has been used by Dr. Gerhard in many of his presentations.
Here is a link to that powerpoint presentation.
ff.org...
Water vapor exists in the atmosphere at about 3-4% of total gases, although some sources state the balanced percentage of water vapor is about 2%, it's percentage is not constant, meanwhile CO2 exists in the atmosphere as 0.038% of total gases.
All trace gases/greenhouse gases amount to a whooping 1% of gases in the atmosphere, more or less. Nitrogen makes up 78%, oxygen makes up 21% of the atmosphere, and all other trace gases/greenhouse gases are the other about 1%
Of that 1% water vapor is the most abundant of all trace gases/greenhouse gases.
Knowing that water vapor retains a bit more than twice the amount of heat than CO2, due to the fact that water vapor absorbs more radiation in all spectrums than CO2, and knowing that water vapor exists in larger amounts than CO2, it is only obvious that water vapor is the most important heat trapping greenhouse gas, but the "let's blame mankind crowd" want to claim that it is CO2 and the small amount of anthropogenic CO2 which is to blame for Global Warming/Climate Change.
BTW, the heat trapping efficiency of trace gases were performed in controlled experiments with each one of those gases, by itself.
In the absence of other greenhouse gases it is known that if the levels of CO2 were to "double", the increase in absorption of heat by CO2 would increase 1.5%. When other greenhouse gases, such as water vapor are present, and CO2 levels were to "double", the increase in absorption of heat by CO2 would be 0.5%.
We know that CO2 levels have not "doubled"...in fact in 150 years CO2 levels have only increased 0.01%.
Originally posted by melatonin
Do you know how Ramanathan & Coakley actually produced these figures? The key will be understanding the meaning of the title of the paper 'CLIMATE MODELING THROUGH RADIATIVE-CONVECTIVE MODELS"
As i have stated above, there is much scepticism whether or not the overlapping effect of other greenhouse gases has been properly build into models of the atmosphere, because in the absence of other GHGs, if CO2 levels double, the absorption of heat by CO2 increases 1.5%, while in the presence of other GHGs that abosorption of heat by CO2, when it's level is doubled, only increases 0.5%.
Originally posted by melatonin
So why does the KGS chart say "contributions to greenhouse effect as % of total". I can see they play games in the note, I said that - pure obfuscation of the fact this figure is BS. So, I guess I should ask you how they calculated these figures? I doubt you could tell me, so we can see them here:
mysite.verizon.net...
This is just total disinformation, readily spread by numerous people like yourself.
Disinformation you say?...
Given the present composition of the atmosphere, the contribution to the total heating rate in the troposphere is around 5 percent from carbon dioxide and around 95 percent from water vapor. In the stratosphere, the contribution is about 80 percent from carbon dioxide and about 20 percent from water vapor.
www.eia.doe.gov...
The troposhere is the layer of Earth's atmosphere where all weather takes place. This layer is about 14 Km thick, or about 7.5 miles, and this is where all of the warming is occurring...
In the following link we see the temperature trends of both the stratosphere and the troposphere.
That jpg file is too large to upload.
Now, since in the stratosphere the contribution of total heating of carbon dioxide is higher than that of water vapor, the conclusion would be that there should be more warming in the stratosphere than in the troposphere right?... Well, is that what we are seeing "melatonin"?....
BTW melatonin, next time you want to claim someone is posting disinformation, make sure "you know what you are talking about"...
[edit on 11-4-2007 by Muaddib]
Originally posted by melatonin
I've given an assessment of the parts you found compelling, what more can I do? The article is barely worth the paper it's written on. If a scientist can't even be bothered to use conventional sources of scientific information, what's the point? We may as well take science from 'Winnie the Pooh'.
Your tactics are amusing to me, and this thread is headed nowhere. As a last ditch effort to save you and your bad science from yourself, let's see what this gent says:
Lindzen, Richard S.
Alfred P. Sloan Professor of Meteorology, Department of Earth, Atmospheric and Planetary Sciences, Massachusetts Institute of Technology
Professor Lindzen is a dynamical meteorologist with interests in the broad topics of climate, planetary waves, monsoon meteorology, planetary atmospheres, and hydrodynamic instability. His research involves studies of the role of the tropics in mid-latitude weather and global heat transport, the moisture budget and its role in global change, the origins of ice ages, seasonal effects in atmospheric transport, stratospheric waves, and the observational determination of climate sensitivity. He has made major contributions to the development of the current theory for the Hadley Circulation, which dominates the atmospheric transport of heat and momentum from the tropics to higher latitudes, and has advanced the understanding of the role of small scale gravity waves in producing the reversal of global temperature gradients at the mesopause. He pioneered the study of how ozone photochemistry, radiative transfer and dynamics interact with each other. He is currently studying the ways in which unstable eddies determine the pole to equator temperature difference, and the nonlinear equilibration of baroclinic instability and the contribution of such instabilities to global heat transport. He has also been developing a new approach to air-sea interaction in the tropics, and is actively involved in parameterizing the role of cumulus convection in heating and drying the atmosphere. He has developed models for the Earth's climate with specific concern for the stability of the ice caps, the sensitivity to increases in CO2, the origin of the 100,000 year cycle in glaciation, and the maintenance of regional variations in climate. In cooperation with colleagues and students, he is developing a sophisticated, but computationally simple, climate model to test whether the proper treatment of cumulus convection will significantly reduce climate sensitivity to the increase of greenhouse gases. Prof. Lindzen is a recipient of the AMS's Meisinger, and Charney Awards, and AGU's Macelwane Medal. He is a corresponding member of the NAS Committee on Human Rights, a member of the NRC Board on Atmospheric Sciences and Climate, and a Fellow of the AAAS1. He is a consultant to the Global Modeling and Simulation Group at NASA's Goddard Space Flight Center, and a Distinguished Visiting Scientist at California Institute of Technology's Jet Propulsion Laboratory. (Ph.D., '64, S.M., '61, A.B., '60, Harvard University)
Lindzen
Lindzen
Lindzen
Lindzen
For the non-scientist:
Lindzen
I do not intend to explain these publications to you, I tire of that game. You have shown me that you are able to read and comprehend most of the time. In fact, you have impressed me as a decent fellow with some rough edges, not unlike myself. I would be the first to admit that atmospheric chemistry is
not my specialty in the private environmental laboratory business I work in.
Later tonight I will write my final thoughts on this thread and be done with it,
because of it's convoluted path to nowhere. I have especially enjoyed your input, and salute your knowledge of the material although I do not agree with your position about A.G.W. Cheers.
Originally posted by Muaddib
There is also a note at the end of that graph that furthermore explains: "Contributions" are defined as concentrations adjusted for Global Warming Potential, relative to CO2.
There is only one percentage which is showing "human contribution to the GE", because CO2 is the main anthropogenic greenhouse gas which has been blamed by some scientists as the cause of the current warming...
Anyways, you are trying now to evade the fact that you didn't even understand what each one of those graphs shows...and now you are trying to dismiss this graph when I have given links to it before and i have stated on several occasions who compiled the data and the graph....
Yup, and that is the obfuscating point. The site I linked to shows how this figure is used. TheAvenger had the same issue, the graph is a piece of disinformation.
I did some rough maths earlier, the human contribution to the GE is at least 3%, show me where my calculation was wrong.
Water vapor exists in the atmosphere at about 3-4% of total gases, although some sources state the balanced percentage of water vapor is about 2%, it's percentage is not constant, meanwhile CO2 exists in the atmosphere as 0.038% of total gases.
Doesn't mean a thing. For its small abundance it has a big effect.
If we take your 2% WV and 0.038% CO2. WV is over 50 times more abundant, does it have 50 times the GE effect?
No.
Using the R&C number it is only has 3 times more effect on the GE. Seems CO2 is much more efficient than WV. Molecules are not created equally.
BTW, the heat trapping efficiency of trace gases were performed in controlled experiments with each one of those gases, by itself.
Not by Ramanathan & Coakley (1978). Their figures are derived from a simple climate models, check the name of the article again. It was a single column model to be exact, the method is the same used by Gavin Schmidt at realclimate with the NASA-GISS model.
In the absence of other greenhouse gases it is known that if the levels of CO2 were to "double", the increase in absorption of heat by CO2 would increase 1.5%. When other greenhouse gases, such as water vapor are present, and CO2 levels were to "double", the increase in absorption of heat by CO2 would be 0.5%.
Only if you don't understand the physics. We have already contributed at least 3% to the GE with 100ppm according to my maths. Show me where I was wrong. The maths was simple, work me through it, show me my error.
Given the present composition of the atmosphere, the contribution to the total heating rate in the troposphere is around 5 percent from carbon dioxide and around 95 percent from water vapor. In the stratosphere, the contribution is about 80 percent from carbon dioxide and about 20 percent from water vapor.
www.eia.doe.gov...
The troposhere is the layer of Earth's atmosphere where all weather takes place. This layer is about 14 Km thick, or about 7.5 miles, and this is where all of the warming is occurring...
I think I'll take my data from better sources, cheers.
In the following link we see the temperature trends of both the stratosphere and the troposphere.
Now, since in the stratosphere the contribution of total heating of carbon dioxide is higher than that of water vapor, the conclusion would be that there should be more warming in the stratosphere than in the troposphere right?... Well, is that what we are seeing "melatonin"?....
heheh, and you say I don't know what I'm talking about...
It was predicted back in 1989 what increased GHGs would do. It would cool the middle atmosphere and warm the troposphere and surface. Stop with the amateur physics, I might break a rib.
[edit on 11-4-2007 by melatonin]
Originally posted by TheAvenger
Your tactics are amusing to me, and this thread is headed nowhere. As a last ditch effort to save you and your bad science from yourself, let's see what this gent says:
What is more interesting is the fact you have ignored all the scientific points I made. You prefer to throw authority figures into the pot, rather than discuss this.
As it is often said, there is only one true authority in science, nature.
ABE: From one of Lindzen links:
More recently, a study in the journal Science by the social scientist [Naomi] Oreskes claimed that a search of the ISI Web of Knowledge Database for the years 1993 to 2003 under the key words "global climate change" produced 928 articles, all of whose abstracts supported what she referred to as the consensus view. A British social scientist, Benny Peiser, checked her procedure and found that only 905 of the 928 articles had abstracts at all, and that only 13 of the remaining 905 explicitly endorsed the so-called consensus view. Several actually opposed it.
Except for the fact Peiser was wrong. Peiser never even replicated Oreskes' study. Of the 34 he said challenged the science from his own variant of the study, only one was found to actually do so, an AAPG article, who would have known...
timlambert.org...
linky 2
[edit on 11-4-2007 by melatonin]
I started this thread to present a lecture by Dr. Art Robinson which questions anthropogenic global warming and whether there is really a consensus
of scientists that agree with it. I have been criticized for the title, but that came with the video link and was not of my choosing. It was intended
that this video is what would be discussed here. As things often do, the video led to a climate change debate which has gone around 14 pages now.
There is a lot of good material presented here by both sides of the A.G.W. issue: Charts and graphs, scientific research papers by world class
scientists, good science, bad science and even a little comedy. Anthropogenic global warming is a unique subject on A.T.S. because it is a field
wherein the government and environmental activists actually agree that it is occurring. (What, no conspiracy?) The scientific take on it? Well,
that's what we're discussing here. I have heard that worldwide 2/3 of our world's scientists agree it is happening, but that is less than clearly
established, at least to me. It is the contention of some of us scientists that the conspiracy is in the believing that global warming is chiefly
caused by humans. I would recommend reading the entire thread if one has not.
I am a skeptic that humans have had more than a minor role in the minuscule amount of increase in average global temperatures of 0.6 degrees C, 1 degree F, over the past 100 years which is commonly attributed to an increase in the amount of atmospheric carbon dioxide. This increase itself is about 100 parts-per million, or 0.01% of the content of the atmosphere. To put that amount into perspective, that would be like someone holding 10,000 one hundred dollar bills, then handing you a single $100 bill. That $100 bill represents the entire CO2 increase in the atmosphere in the past 100 years versus the entire atmosphere. Pretty small amount compared to a million bucks, you think? Anyway, the theory is that adding more CO2 to the air by our motor vehicles, power plants and other human activities will increase that 0.6 degree C temperature to an even higher level, thereby supposedly creating a series of disasters worldwide. Now, let's move on to why I don't believe that human-made CO2 has more than a minor effect on the climate.
First, we all agree that the Earth has warmed that 0.6 degrees C in the past 100 or so years. We all agree that the CO2 content of the atmosphere is about 100 P.P.M. higher than in the years 1865-1900. The disagreement is why this small temperature change has occurred. There are many ideas about the mechanisms of global warming, and there is great concern about how higher levels of CO2, like twice as much, will affect the future of the planet's temperatures. my opinion as to why I believe little of it was caused by humankind and why I have little concern for the future global temperature change follow. I presented hard scientific evidence but it was criticized by some here who are unwilling to accept that man is less powerful than nature. Further argument with them being futile, I will continue in layman's terms as much as possible so as to inform those who may be capable of changing their mind.
1. Earth and It's climate are dynamic. they constantly change. always have as far as we know. Many things affect the world's climate. The increase in temperature may be a natural phenomenon. As clever as we think we are with our science, I estimate that we know less than 1/10 of 1 % about how our planet functions. Remember, we scientists are the ones who gave you ozone depletion, the DDT ban which killed millions, the "safe" herbicide agent orange, global cooling, saccharin ban, the "safe"diet drug Dexfenfluramine (Redux). In the early 1970s we told you the world was almost out of crude oil to make fuel. Now, global warming? anyone see a pattern here? All of the above had a good consensus of scientific evidence. Bad, bad science. Take it all with a box of salt. Even if you had randomly bet 1/2 the field in a horse race you would win 1/2 of the time. Beware when science says "trust in me....."
2. The theoretically predicted temperature increase when CO2 is added to our climate has not occurred. Has been much lower. Water vapor is the chief greenhouse gas, not CO2, so I surmise that is the place to find the answer, Time will tell. The climate models used to predict effect of changes do not account for and cannot account for unknown climatic factors. Yes, folks, theres a whole lot we don't know, just like I said above.
3. The Vostok ice core data is flawed. This seems to be Al Gore's favorite, I think, like for 20 years. The linear temperature graph plotted against the oxygen isotope O18 is incorrect. A nice linear plot doesn't always properly account for cause and effect. Indeed, in this case it does not. This is brand new work by Dr. Lindzen, of M.I.T., the closest us skeptics have to an anti-Al Gore. At any rate, charts in "An inconvenient Truth" do not bear close examination. The modelers could not decide how to account for the recent warming so they "guessed" it was caused by anthropogenic factors.
3. The energy absorbed from the sun as radiation is both absorbed and EMITTED by greenhouse gases then goes into space. In grossly oversimplified models, the emission part of this process is swept under the rug and not accounted for Also part of that sunlight is reflected by clouds, again, to space.
4. Satellite data used by the I.P.C.C. is incorrect, does not account for troposphere vs. surface changes. No warming has been shown in the atmosphere since 1979. Evidence restricted to model data is simply unsatisfactory. The I.P.C.C. telling us that the data that models do not account for is unimportant is just not credible. It is also incorrect to say that all of these effects are unknown to science. The models are too sensitive and generate very high results over theoretical when atmospheric CO2 is doubled. Models can be made to prove anything. Garbage in, garbage out. I do not trust them.
I could keep going, but I have almost reached the word count limit.
Briefly, in my opinion, There is no proof that compels me to believe that CO2 is a driving mechanism for climate change. All things considered, IF global warming has had any anthropogenic causation, I decided it is at most 1/3 the usual value of 0.6 degrees C or a 0.2 degrees C rise over the past century. There is no crisis.
FAREWELL.
[edit on 4/12/2007 by TheAvenger]
Originally posted by melatonin
.............
I did some rough maths earlier, the human contribution to the GE is at least 3%, show me where my calculation was wrong.
If anyone is "obfuscating" the topic it is you...
This is supposedly your infallible math calculation...
If we take Ramanathan & Coakley's figures, 12% of the GE effect remains when CO2 is removed. Just for CO2, the human contribution to the current GE is well over 0.28%. The current rise in CO2 is predominately anthropogenic, making it about 26% of current CO2 forcing.
0.26 x 12 = 3.12%
The rise of CO2 in the last 150 years has been 0.01%, and most of it is not anthropogenic in origin...
I really would like to know from where did you pulled the 26% anthropogenic CO2....
Are you really trying to claim that the 25% CO2 increase since 1850 is all anthropogenic?... BS.... prove it...
It has been proven by controlled experiments than only by doubling CO2 supposedly there would be a noticeable increase in temperatures by 0.5%, with the other GHGs added to the equation....
Originally posted by melatonin
Doesn't mean a thing. For its small abundance it has a big effect.
If we take your 2% WV and 0.038% CO2. WV is over 50 times more abundant, does it have 50 times the GE effect?
No.
Using the R&C number it is only has 3 times more effect on the GE. Seems CO2 is much more efficient than WV. Molecules are not created equally.
Really?... i wonder what is it that causes most of the weather patterns around the world to warm suddenly...
Water vapor has a higher heat trapping capacity than CO2 by a factor much greater than 3.
In fact experiments have shown that an increase of CO2 levels from 360 to 560 ppm, in the tropics (a 200 ppm increase..) there is a total increase of 0.09 Wm2. When CO2 levels increase from 0 to 360 ppm, the total increase is 0.41 Wm2.
Meanwhile a net increase of only 5% water vapor in the tropics produces 3.88 Wm2, and if the change of concentration of water vapor is from 0 to it's present level there is an increase of 303.84 Wm2.
A smaller increase in water vapor of 5% produces more warming than a 200ppm increase of CO2, and a 200ppm increase of CO2 from 360 is more than a 50% increase...
So an increase of 100ppm, which is the amount of CO2 which has increased for the past 150 years there would be an increase of 0.045 Wm2.
Water vapor levels increase in a warming world, and since most of the world has been warming about 260 years before CO2 levels were increaing... a warmer world, more water vapor, which increases temperature more....
The following video from NASA shows what happens to the atmosphere when moisture is added each year.
www.nasa.gov...
There are two tables that Norm Woods prepared that are insightful in terms of the effect of different atmospheric concentrations of CO2 and water vapor. For the tropical sounding, the downwelling longwave flux at the surface when the CO2 concentration changes from 360ppm to 560ppm is 0.09 Watts per meter squared, as contrasted with a change of 0.41 Watts per meter squared when the concentration changes to 360ppm from 0 ppm. The reason for this relative insensitivity to added CO2 in the tropics is due to the high concentrations of water vapor which results in additional long wave flux changes due to CO2 being very muted.
...................
For water vapor, with the tropical sounding, the change of the concentration from zero to its current value, results in a 303.84 Watts per meter squared change in the downwelling longwave flux at the surface. Adding 5% more water vapor, results in a 3.88 Watts per meter squared increase in the downwelling longwave flux. In contrast, due to the much lower atmospheric concentrations of water vapor in the subarctic winter sounding, the change from a zero concentration to its current value results in an increase of 116.46 Watts per meter squared, while adding 5% to the current value results in a 0.70 Watts per meter squared increase.
climatesci.colorado.edu...
Furthermore the results from those experiments prove that I am correct in my assesment that the graph you melatonin are trying to claim is accounting for all levels of GHG is in fact not doing such, it just shows the heat trapping efficiency of each one of those gases.... So again, you have demonstrated not to know what you are talking about.
Of course scientists like Lindzen agree with the results of experiments like the above.
But he goes further. Lindzen believes that even if man were indeed responsible for the vast majority of the warming observed in the last 100 years, he thinks there is still no cause for alarm. In its 2001 report, the IPCC concluded that between 1990 and 2100 the Earth would heat up by between 1.4 °C and 5.8 °C, with the exact amount depending on future trends in greenhouse-gas emissions, as well as on the specific model used to carry out the projection. For Lindzen, these figures are way off the mark. He claims the climate models used by the IPCC are far too sensitive to changes in the concentration of atmospheric carbon dioxide, and estimates that the Earth will in fact warm up by perhaps just a few tenths of a degree over the next century. Needless to say, this is a conclusion that other climate researchers strongly disagree with (see "How sensitive is the climate?").
physicsweb.org...
Originally posted by melatonin
I think I'll take my data from better sources, cheers.
Oh i forgot, and in your above statement, once again, you are giving credence to the "Real Climate website"....
Originally posted by melatonin
heheh, and you say I don't know what I'm talking about...
So you are telling us that the more CO2 in the upper atmosphere there shouldn't be higher warming trends?.... How come the models say the oposite?...
The higher you go in the atmosphere CO2 levels are higher, except for ozone, than that of other greenhouse gases such as H2Ov which decrease the higher we go, yet we see a cooling effect. Not only that but as stated in that excerpt and link I gave, water vapor is one of the major causes for a warming increase in the troposphere, not CO2.
Originally posted by melatonin
It was predicted back in 1989 what increased GHGs would do. It would cool the middle atmosphere and warm the troposphere and surface. Stop with the amateur physics, I might break a rib.
Here is a review of what happened during 1989, before and after according to Professor Richard Lindzen...
Predicting what will happen to carbon dioxide over the next century is a rather uncertain matter. By assuming a shift toward the increased use of coal, rapid advances in the third world's standard of living, large population increases, and a reduction in nuclear and other nonfossil fuels, one can generate an emissions scenario that will lead to a doubling of carbon dioxide by 2030--if one uses a particular model for the chemical response to carbon dioxide emissions. The Intergovernmental Panel on Climate Change Working Group I's model referred to that as the "business as usual'' scenario. As it turns out, the chemical model used was inconsistent with the past century's record; it would have predicted that we would already have about 400 parts per million by volume. An improved model developed at the Max Planck Institute in Hamburg shows that even the "business as usual'' scenario does not double carbon dioxide by the year 2100. It seems unlikely moreover that the indefinite future of energy belongs to coal. I also find it difficult to believe that technology will not lead to improved nuclear reactors within fifty years.
www.cato.org...
The predictions from back in 1989 were "wrong"....
[edit on 12-4-2007 by Muaddib]
The whole Global Warming being manmade issue comes down to one basic question as far as I can gather:
"Is co2 the main culprit causing global warming?"
If the answer is Yes, which from all accounts it appears to be, then the debate is over, because Global Warming is most definitely manmade.
Prior to the industrial revolution the vast majority of co2 in the atmosphere would originate as a by product of breathing oxygen. How else would significant quantities accumulate in the atmosphere? Since the industrial revolution the quantites of co2 in the atmosphere as a result of breathing must pale insignificance to those levels generated by industry.
In summary, all skeptical of global warming being man made must believe co2 is not the cause of global warming. Is this correct?
new topics
-
The Witcher IV — Cinematic Reveal Trailer | The Game Awards 2024
Video Games: 54 minutes ago -
Friday thoughts
General Chit Chat: 1 hours ago -
More Ons?
Political Conspiracies: 1 hours ago -
Canada Post strike ended by the Government of Canada
Mainstream News: 1 hours ago -
They Know
Aliens and UFOs: 6 hours ago -
Drones (QUESTION) TERMINATOR (QUESTION)
General Chit Chat: 7 hours ago -
Canada Banning more Shovels
General Chit Chat: 11 hours ago
top topics
-
They Know
Aliens and UFOs: 6 hours ago, 15 flags -
Canada Banning more Shovels
General Chit Chat: 11 hours ago, 10 flags -
The goal of UFO's/ fallen angels doesn't need to be questioned - It can be discerned
Aliens and UFOs: 16 hours ago, 6 flags -
More Ons?
Political Conspiracies: 1 hours ago, 3 flags -
Friday thoughts
General Chit Chat: 1 hours ago, 3 flags -
A priest who sexually assaulted a sleeping man on a train has been jailed for 16 months.
Social Issues and Civil Unrest: 16 hours ago, 2 flags -
Canada Post strike ended by the Government of Canada
Mainstream News: 1 hours ago, 2 flags -
Drones (QUESTION) TERMINATOR (QUESTION)
General Chit Chat: 7 hours ago, 1 flags -
The Witcher IV — Cinematic Reveal Trailer | The Game Awards 2024
Video Games: 55 minutes ago, 0 flags
active topics
-
They Know
Aliens and UFOs • 47 • : GENERAL EYES -
A Bunch of Maybe Drones Just Flew Across Hillsborough County
Aircraft Projects • 40 • : GENERAL EYES -
Jan 6th truth is starting to leak out.
US Political Madness • 29 • : fringeofthefringe -
More Ons?
Political Conspiracies • 12 • : some_stupid_name -
A priest who sexually assaulted a sleeping man on a train has been jailed for 16 months.
Social Issues and Civil Unrest • 21 • : andy06shake -
Drones (QUESTION) TERMINATOR (QUESTION)
General Chit Chat • 8 • : bluesman023 -
Biden pardons 39 and commutes 1500 sentences…
Mainstream News • 27 • : Astrocometus -
President-Elect DONALD TRUMP's 2nd-Term Administration Takes Shape.
Political Ideology • 327 • : Oldcarpy2 -
TRUMP: Release Hostages or there will be HELL TO PAY
US Political Madness • 71 • : Oldcarpy2 -
-@TH3WH17ERABB17- -Q- ---TIME TO SHOW THE WORLD--- -Part- --44--
Dissecting Disinformation • 3665 • : fringeofthefringe