It looks like you're using an Ad Blocker.
Please white-list or disable AboveTopSecret.com in your ad-blocking tool.
Thank you.
Some features of ATS will be disabled while you continue to use an ad-blocker.

Flight 77 FDR research
page: 1share:
Not a story on the BBC footage! Yay!
I've been looking into Flight 77's flight Data recorder, recovered at the Pentagon, and it's an odd case -
Several notes:
- Animation questions: the supposedly FDR-based animation used in Pilots49T video "Pandora's Black Box." It is what established the new northerly flight path, new altitude questions, and stops short at the right time but with the plane in the wrong place - in-air and short of the Pentagon. Is it accurate?
- I located a copy of the NTSB FDR study for 77. PDF available here: appears ov't and official. www.ntsb.gov...
- This document was released directly to Pilots member "UnderTow" vis FOIA lawsuit in July 2006. It looks legit but has not been widely published.
- The animation was obtained separately by Pilot via "Snowygrouch," a UK researrcher, who says he got it straight from the NTSB, again via FOIA requests. Does the FOIA apply to foreign nationals as well? He handed it over to the Pilots, who were able to thus use it and show the new flight path questions. z9.invisionfree.com...
- Both the study and the animation were sent to CTers, both signed off by the same officer, Melba Moye, according to the cover letters, on July 25 and August 11 respectively. Anything from 77 FDR is ignored elsewhere, only Pilots for 9/11 Truth are cavorting with it. The 9/11 commission used its altitude readings, but only as copied from another doc, avoiding any direct mention or citation of this FDR study.
- Neither the animation nor the FDR study were released along with the "total" NTSB material released by the National Security Archive Aug 11 2006.
www.gwu.edu...
According to them, the FDR info for Flight 77 NEVER EXISTED! Only 93's survived, they say...
- But of course it does exist, the data is now semi-public, and the Pilots ay the study matches the animation. It doesn't. The altitude in the animation read "300" at takeoff, and "180" while well above the Pentgon at 9:37;45. The FDR study shows the plane beginning and ending at zero altitude (ground level) at 9:37 Other discrepancies are possible as well, but that's enough for me to start wondering what else might be off. the flight path? Is tis even based on the FDR?
- Why did the CIT ignore the FDR in making the PentaCon video (other than a brief nod to the Pilots video), even tho it seems the most damning evidence? Are they aware of some problem with it? I it really authentic?
I'm still sorting it out.. just fishing for thoughts.
Originally posted by Caustic Logic
- Why did the CIT ignore the FDR in making the PentaCon video (other than a brief nod to the Pilots video), even tho it seems the most damning evidence? Are they aware of some problem with it? I it really authentic?
I'm still sorting it out.. just fishing for thoughts.
Great research!
When this is done, somebody is going to have some 'splainin to do -either the pilots or the U.S. government.
I noticed the discrepancy re the take-off altitude too, but I thought I saw something later that explained it when I watched the YouTube video on Pandora's Black Box. Is it showing 300 on the ground before take off?
Also, when I post Jack Tripper about his video before he released, he was noticeably silent when asked if the video is related to the NTSB animation.
Jack, if you're reading this, what's up with that??
Thanks Nick! I should have everything I have organized by late tonight, and a full pot at my blog. (partly up now:
[url=http://frustratingfraud.blogspot.com/2007/02/flight-data-recorder.html]http://frustratingfraud.blogspot.com/2007/02/flight-data-recorder.html[/ur
l])
Then I'll look into remaining questions and go from there. Congrats on being in the running for the top 5 contest BTW. It's good company.
Then I'll look into remaining questions and go from there. Congrats on being in the running for the top 5 contest BTW. It's good company.
When this is done, somebody is going to have some 'splainin to do -either the pilots or the U.S. government.
And it may be me with the 'splainin to do. Okay, so I'm still working out the blog post - more questions than I thot. Here's a link that works.
Flight 77 FDR post - in the works. I can see speed, altitude, and directional heading (incl. the loop)on the data, but still working out how well and hat it says re: the animation.
- Altitude per the "FDR" video in PBB: the resolution here is hard to read (note to self - buy this excellent DVD in full-res $$$ for Pilots and your chicks for free) Honestly, I hate the music and the guy's voice and taking the time to watch the whole thing, so I admit I missed any explanation they may have offered for alt. discrepancy. I just zoom to the parts I want and keep the volume down. This is a weakness, and i'll have to watch it all-thru sometime I suppose.
But... it looks like 300 at ground level: Part One - 2:30-3:30, cross fade as the numbers start ticking up.
Descent: Part Two - 5:45 - 6:15
Sample alts at second rollovers:
13:37:00 - 2441 feet
13:37:15 - 2080
13:37:30 - 1412
13:37:35 - 962
13:37:40 - 504
13:37:41 - 404 (-100)
13:37:42 - 316 (-88)
13:37:43 - 235 (-81)
13:37:44 - 180 (-55)
13:37:45 - Zero? Difference of 180 feet compared to second drops of 50-100 up to then. 2,261 feet descended in 45 sec. avg rate: 50/sec. Accelerating near the end obv. and levelling out again at near 50/sec. By this animation, a Pentagon strike seems nearly impossible to have happened in another second.
Yet the FDR study matches the official story: The FDR printout below, from pae 26 - looks like the last 45 seconds had a descent less like a 2250-foot drop to 180 than something on the scale of 250 foot drop to zero.
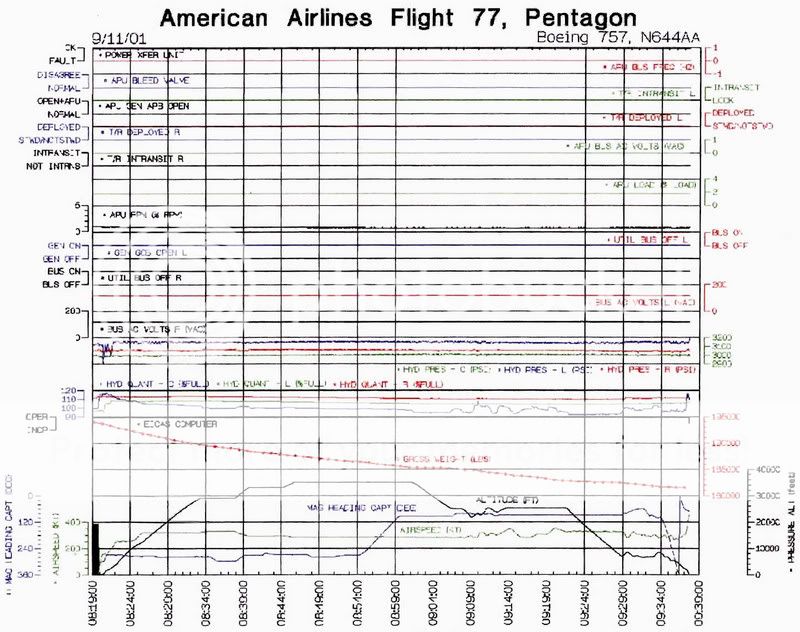
Notes: Relevant lines are all near bottom - altitude, airspeed, and magnetic heading - that one's interesting to read - left to right is timeline of course, two straight lines, one east, one west, marked by a turnaround and a final near-full circle loop, all visible here.
does this looptake it north or south of the Citgo? Have at it, folks and I'll be back with what I find.
Re altitude stuff I just double-checked: P49T explain the on-screen altitude is wrong, making the plane appear lower than it actually was - pressure settings were off by a big degree from actual local settings (a claim I haven't checked), giving a discrepancy of 300 feet. From the animation, with "300" at Ground Level, I'd guess this might be right, and would guess we subtract 300. But that would give us a plane 120 feet in the ground at 9:37:45. So they decide to add 300 ft, giving a final altitude FAR too high to have hit, meaning it's even further from the FDR study than it actually is.
FDR analysis based on animation, NOT based on FDR study
John Doe X, Dec 20 2006 : "[the animation] matches the information we have that UnderTow received through the FOIA from the NTSB (except for the blatant cover-up of the altimeter not being set on descent in the animation to make the animation aircraft appear lower than it actually is.. will be explained in full in upcoming documentary.)"
That is, it matched until they changed it. But it doesn't match, and if they changed it, the changes made it actually come closer to matching, but still far off.
- I also found the NTSB does have a website where the FDR report can be downloaded.
www.ntsb.gov...
It's got the same exact PDF report I found. It's the one the pilots used, first released to UnderTow and I guess later released to everyone. It's probably been up there forever but I didn't see it - Thanks to John Doe X at P49T for the link. One part of the oddity made less odd. Too bad it's not fitting so well with their other findings...
[edit on 1-3-2007 by Caustic Logic]
[edit on 1-3-2007 by Caustic Logic]
[edit on 1-3-2007 by Caustic Logic]
Originally posted by Caustic Logic
Too bad it's not fitting so well with their other findings...
Awesome job on this!!! Somebody needed to do this research. It needs to be determined if the FDR matches the official flight path. If it does, then P49T are going to look pretty foolish. If it doesn't then this is going to make the BBC story seem small in comparison.
Question:
How does the FDR data show the actual path? What fixed reference points are given in relation to heaing that would allow somebody to place the plane at a specific location on a map?
Also, re altitude, keep in mind that the altitude is relative to sea level. I'm not sure that we can assume that the Pentagon and the runway where the plane took off from have are at the same sea level.
I do recall very specifically thinking the P49T video was bogus in terms of the starting altitude, and then thinking I was wrong to think this later on in the video. I'm not sure that they specifically talked about the starting altitude. My memory is that I saw something that answered the question I had in my own mind.
I'm going to be out most of the day today, so I don't have time to look at the data. If there's anything specific you'd like me to check out let me know -I'll try to get to it tonight.
Thanks man! I'm checking out PBB now for explanations - while it loads, I'll address your other Qs.
Flight path re the FDR data. This is interesting to read, showing East/West/North/south in a single line. First half of dark blue line (Mag heading Capt CEE) is starting at dulles and going West/southwest - in the middle is the famous southern turnaround (? South is up?), the line after is in the East/northeast direction. If you can see how that works you can read it. The dramatic loop is visible at end - it goes near-full circle we're told, heading east-south-(down?)-west-north-northeast and then hits. If one take the start point as Dulles and end point as Pentagon, carefully mapped the heading and speed, we could get a flight path that probably looks like the official one except in the detail of the final approach - wheteher the loop was big enough to go nort of the CITGO. I doubt we can tell this for sure from the chart here. And I can't read exact directions from it anyway, just matching this with hat I've seen. maybe its inverted and the plane actually flew East over the ocean and then returned. I dunno. anyone else?
As for alt: Thanks for spurring me here - I was wrong on that - Dulles is higher than I thought. Heard the Pentagon was only like 40 ft above sea level, but Dulles is at 313 AMSL per Wikipedia anyway - so the "300" at takeoff is about accurate at that point. There are some peaks just west of there as high as 4,000 feet+, so it's bound to be up there a bit. Pentagon is closer to shore, by topo maps significantly lower. I can't find it right now, but the plane looks what, 150-200 feet high? is the on-screen altitude actually correct for Sea Level?
Okay, that took longer than it should have and I still didn't play the video. Next post...
Other points: The pilots didn't mention the actual PDF of the FDR study in the beginning anyway, but rather a spread sheet for Excel (a csv filewhich
I can'topen) that's supposed to match the animation. This is what still needs to checked.
z9.invisionfree.com... &
The NTSB cover letter said it was provided with the PDF and used to map it out, so it should match the PDF. Odd that they don't talk about the PDF itself.
Four hour difference on-screen: It says "EDT" but is actually in Grenich Mean - for the convenience of snowygrouch I guess.
- at 23:50 in the video (part one) the altitude needle suddenly falls to zero while numbers stay steady (??)
I'm into part two and still nothing new on altitude...
Okay here's the part - seeing the reset to 2992 pressure -
oops on noting the needle droppint to zero, that's normal -
Okay, so they say the CSV spread sheet does show the reset, and the animation doesn't match that. It's an NTSB cover-up, they feel, but only in one of their sources.
They imply the CSV doc shows the alt reset and the altitude at end then would be 480 feet. The cover letter said those numbers were used in the FDR study. So is the spread sheet closer to the animation or to the PDF I've been looking at? I'll need to look more...
Hmmm...
I don't have time to reply in detail now, but I was just wondering if you know what flight simulator software was used? Is there software readily
available that you can input the CSV file into to reproduce the flight path?
No idea on the software. and agian, we don't have the actual digits, just the print-out. So we'd have to analyze the shot above, decide what
direction is what, and map it out from that. With speed accounted for, and knowing start and (alleged) end points, it could be mapped out reasonably
close. but again, look at the line we'd be woring with - not sure how high-res the original can come out - i extracted it at 144 dpi, cropped and
enlarged it at 72 dpi. It could be extracted better, but a precise enough reading to answer the relevant Qs might be impossible. worth a try tho. i
was thinking of doing it with math, step by step, but prob. wasn't going to...
Also: I have a Mac and no program to open the CSV fil provided by John Doe X. z9.invisionfree.com...
I'll be able to figure it out eventually, but if you have time and Excel or a converter or something? It would speed things up and might give better numbers for plotting the course.
[edit on 1-3-2007 by Caustic Logic]
I got it open. It opens as text in Word, so never mind.
I'll look at it tonight. To work now.
I'll look at it tonight. To work now.
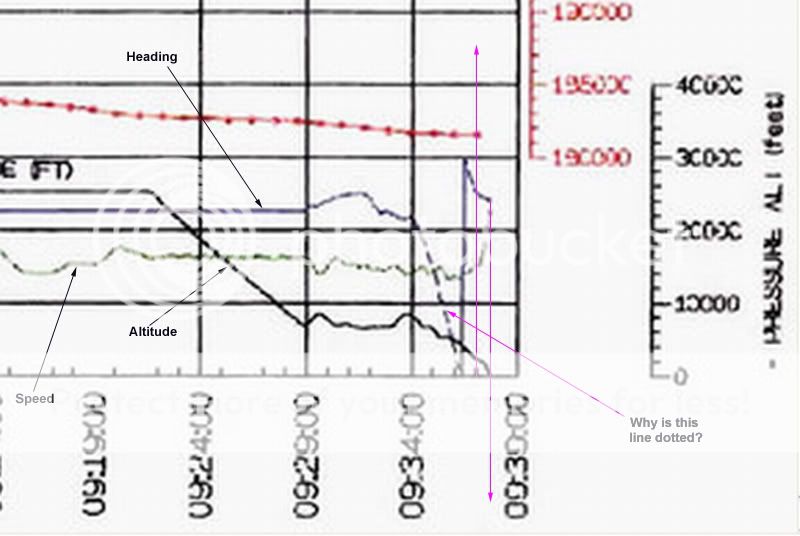
This is a close-up of the last few minutes of the Flight 77 FDR info.
Here's what I find incredibly amazing....
Amazing Fact 1
Notice how when the final clockwise turn started at 9:29 the heading was almost exactly 90 (due east) and the altitude was about 8000 feet. The plane started climbing as it turned north, almost as if to get lined up for the final 360+ clockwise turn.
Now notice that at 9:34 the heading line becomes dotted. I'm not sure why this line become dotted. But more importantly, look at the altitude line beginning at 9:34.
From 9:34 until the crash, the plane began descending at an almost constant rate. Also, at this same time, the plane went into a clockwise turn that was at a constant rate of turn as well.
Do you realize the implication of this?
This means that when the plane was 3 minutes away from crashing, the pilot initiated a turning radius AND a rate of descent that landed the plane a foot above the Pentagon lawn 3 minutes later.
How is this possible? It's not a matter of whether Hanjour was a good pilot. It was an incredible feat of navigation to lock in the rate of turn and the rate of descent simultaneously 3 minutes before the crash in such a way as to end up at the exact base of a Pentagon wall.
In other words, the pilot did not manuever the plane into the target. He set the *course* for the target 3 minutes out by simultaneously banking right and descending at the perfect rotational and vertical speed. To get *either* the rotation correct, OR the descent correct would have been a 1 in a million chance. To get both correct defies belief.
Plus, this was allegedly done manually. How could Hanjour have visually seen any visual cue at 9:34 *as he was climbing* ?
Also, look closely near the last 1 minute of the flight. The speed increased exponentially *while the plane was still turning and descending*.
Amazing Fact 2
Remember Mineta's testimony:
Mineta: “During the time that the airplane was coming into the Pentagon, there was a young man who would come in and say to the Vice President…the plane is 50 miles out…the plane is 30 miles out….and when it got down to the plane is 10 miles out, the young man also said to the vice president “do the orders still stand?” And the Vice President turned and whipped his neck around and said “Of course the orders still stand, have you heard anything to the contrary!??”
WTF? This implies that the plane was coming in straight, but we know the plane wasn't coming in straight -it was approaching in a giant clockwise turn.
Let's do some math...
The plane was traveling at 300 MPH when it was approaching. That's 5 miles per minute. That means it would have taken 4 minutes for the plane to go from 50 miles out to 30 miles out, and another 4 minutes to go from 30 miles out to 10 miles out. This would put the plane right in the middle of it's giant turn when the "young man" informed Cheney of how far out the plane was.
Now either Mineta's testimony is a complete fairy tale, or somebody was telling the "young man" about the planes approach without filling in a very important detail -the plane was drastically changing couse at this point. In other words, the plane stopped "coming in" at some point because it was doing a 360+ turn. It didn't simply come in at 50 miles out, then 30, then 10. In fact, if I'm not mistaken, at some point it had to be moving *away* from capitol, right?
EXCELLENT analysis! I was just about to bump it up too... I just got home a bit ago and am just getting to work - it's pain to scan a CSV file in
word, and its insanely long and full of commas. but I've located the alt. trim 29.92 at precisely 8:28:10, as in the video! Well I didn't check the
seconds, but it was at 8:28. now I'm scanning for later instances of trim adjustment. So far "no trim" repeating a lot...
As per your "Amazing facts," the Mineta thing is interesting, but I'm not sure what to make of it. It's certainly an early time to admit a shoot-down order. No one else, including the Commission has it passed Bush to Cheney at any time before 10:10 or so depoending on who you ask. The implications on the current case - I'm too one-track to see it right now.
But your the final maneuver observations are right on. I'm glad your brain app. works a little better than mine; I knew it was intersting but hadn't thought it all out like that. I'm not sure about the dotted line - something to do with, like, going off the chart?
Full steady loop, full steady descent, and steady acceleration to boot to get just the right altitude to clip the lightpoles, skim the highway and lawn at near 600 mph into the West Wall BAM! Kinda looks precision-guided, huh? Somehow I'm not surprised at all. Of course it's also the oldest observation - how could a flunky pilot do that? But that's really something to see up close.
Stellar work, glad to see this going somewhere.
All right back to the trim scan tedium...
[edit on 2-3-2007 by Caustic Logic]
To anybody reading this! I apologize fir the tedium, but this is at the moment a research thread. Feel free to pop in with casual encouragements or
any helpful thoughts. We will eventually get to the point, and I think I'll start a new thread then to present the summarized findings and let
discussion open.
and if you don't know the significance of the new flight path, check either the videos
Pandora's Black Box
the PentaCon
They claim to blow the whole official story out of the water with this, and prove the government evil - because of this flight path/altitude data plus some eyewitnesses (whose stories don't all add up BTW, nor do they line up with the altitude changes in PBB). It's not that I disagree with their ultimate case, but that it's important to get our facts straight and I'm not gonna let my total ignorance of aeronautics stand in the way of looking into it myself.
Here's what I found on trim settings in the FDR Tab CSV file.
The plane seems to have an initial trim/altitude/pressure whatever exactly setting that fluctuates slightly but is centered around around 30.2 whatevers until after takeoff.
initially the even seconds run as such:
08:19:18: 30.21
08:19:20: 30.20
08:19:22: 30.21
and so on. Then even the evens start to fluctuate with other numbers closer to 29.92:
8:26:48: 30.2
8:26:50: 30.21
8:26:52: 29.96
8:26:54: 30.21
8:26:56: 29.91
[...]
8:27:12: 29.91
8:27:52: 29.91
8:27:54: 30.21
8:27:56: 29.91
8:27:58: 30.21
8:28:00: 29.91
8:28:02: 30.21
8:28:04: 29.91
8:28:06: 29.94
8:28:08: 29.91
8:28:10: 29.92
8:28:12: 29.91
8:28:14: 29.92
At 8:28, by the altitude chart, the plane ascends over 18,000 feet and as the PBB video explains per FAA regulations, switches the setting to 29.92. This happens by the data above at 8:28:04 and from there the even seconds hold steady between 29.92 and 29.91. This is as it happens in the video.
And how is the reset done? A knob on the dashboard, the video explains. Manually. keep this in mind.
08:50:00: trim at 29.91
At about 8:55 the plane is seized by terrorists hellbent on traumatizing America.
09:00:00: trim at 29.91
By 9:37:45 the plane was - well that's the contentious point. If the PBB video is correct, the next batch of numbers will show that the alleged Hani Hanjour knew FAA protocol and observed it, adjusting the trim back to 30.2 as he descended below 18,000 feet, something that WASN'T in the video, and that the plane was therefore not just too high to have struck the Pentagon (as in the animation) but FAR too high.
That sounds just silly, but I looked at the slot around 9:24, as the attack plane descended past that 18,000-foot barrier.
9:24:12: 29.91
9:24;14: 29.92
9:24:16: 30.23
09:24:18: 30.01
09:24:20: 30.23
After holds steady at about 30.23, a bit higher than the original setting.
9:25:00 - 30.23
9:29:00 - 30.23
9:34:00 - 30.23
9:36:30 - 30.24
9:37:00 - 30.23
9:37:44 – Last second recorded: NO TRIM DN,,,NO TRIM DN,,,NO TRIM UP,,,NO TRIM UP,,,,30.23
There it is. Silly or not.
the pilots were right, at least about the trim being reset in this jumble of numbers.
Next to see where the altitude is listed and look for the impact of these changes and see what I can read.
[edit on 2-3-2007 by Caustic Logic]
Backing away from the numbers, i looked into Snowygrouch's FOIA request that got the animation video sent to him, and may have found the weak link in
the Pilots' evidentiary chain. or not...
it's near time to place one of those rare but fruitful phone calls...
When a poster at the Pilots' forum questioned the animation's authenticity, John Doe X promised with a link "the paperwork can be found here." The link is to another thread at the forum about Snowygrouch's revolutionary find. The key post there is where Mr. X posted "Cover letter/Envelope from Animation FOIA,” showing a stamped air mailer addressed from the NTSB in Washington no less! and the letter, oh the letter. Regarding a request from august 4, Moye was responding on August 11. “specifically, you requested NTSB report of the flight path study for [flights 11, 175, 77]," she reminded Mr. __. The information requested is on three CD-ROMs.”
Wow! there you have it, the animation is legit, and he's got two more to boot. Members agreed to post the animation everywhere possible, no more questions needed answered. Problem is, “Flight path study” may mean an animation, or it could refer to the previously mentioned NTSB reports – on paper or PDF – entitled “Flight Path Study,” and were compiled for flights 11, 175, and 77. the word "animation" or anything implying viewing or bit-rates or anything was not mentioned in the letter.
Anybody can get these @ the National Security Archive or the NTSB downlaod page, which includes the FDR report for 77 that the NS Archive says doesn't exist. These are NOT animated. They have a flat drawing of the flight path and the altitude profile for each plane. If the NTSB are also putting out animations of the flights with the same titles, Snowygrouch got the only copies I’ve heard of.
Otherise, mr. Grouch simply animated this himself using the numbers in the FDR report – not even in the docs sent him. Perhaps this was done in good faith and is even accurate. From what I've seen it matches the officially released FDR data at least partly. But it would certainly raise questions in that this has been uniformaly passed of as an official, NTSB-created animation.
[edit on 2-3-2007 by Caustic Logic]
Caustic I apologize if you've covered this in the thread but frankly I didn't have the time to read through all of your data. Regarding the often
cited altitude discrepencies:
The elevation of Dulles is 313 ft MSL which is why the flight data shows 300 at take-off. The altimeter is always set at local pressure or field elevation (which are basically one and the same) prior to takeoff.
As an aircraft flies a route BELOW 18,000ft the pilot regularly changes the barometric pressure setting in the altimeter to reflect the local barometric pressure (ATC provides this during handoffs).
When an aircraft CLIMBS through 18,000ft (as this one does) the pilot abandons the 'local barometric pressure reference' and all planes above 18,000ft set their altimeters to 29.92. You can see this happen in the FDR animation when the alimeter jumps.
When an aircraft gets instructions to descend below 18,000ft, ATC gives them the local barometric pressure and the crew adjust the altimeter accordingly (you should see another 'jump' of the altimeter in the animation but you don't). Remember, the plane is in the control of the hijackers as it descends from 18,000ft and they're not going to worry about resetting the altimeter (if they even had a clue that it is normal procedure).
Barometric pressure increases as you descend --- depending upon the weather system in place. On Sept 11 the weather was beautiful so the barometric pressure would be relatively high --- higher than 29.92. As a result, as the plane descended below 18,000ft the altimeter would read increasingly low. That is, as it descended the plane's altimeter would display an altitude that was LOWER than the actual altitude at any given point and that difference would increase the lower the plane got.
Now I read a thread on some other boards from some self-professed FDR expert that said the problem was in the conversion of the actual linear data on the FDR to the .CSV data published. I'm a data professional. I can't see how that is possible. I can understand that there could be data anomalies but they would show up as just that. Not a nice, smooth data series that is all off.
Again, sorry if you covered all this. Pilots for 911 Truth doa great job presenting all this.
Originally posted by Caustic Logic
Full steady loop, full steady descent, and steady acceleration to boot to get just the right altitude to clip the lightpoles, skim the highway and lawn at near 600 mph into the West Wall BAM! Kinda looks precision-guided, huh? Somehow I'm not surprised at all.
Not just precision guided. That would be interesting enough. But precision *planned*. The 360 loop was initiated with a constant rate of turn and constant rate of descent 3 minutes before the crash. The word "guided" implies, at least to me, locking onto the target and adjusting course until you hit the target.
This was more than guided. The course to the Pentagon was SET and MAINTAINED CONSTANT 3 minutes before the impact.
Of course it's also the oldest observation - how could a flunky pilot do that?
Not exactly. This is MUCH different. A flunky pilot *might* be able to line up a target and steer the plane into the target. But there's zero... *ZERO*... chance that even a good pilot could initiate a simultaneous turning speed and rate of descent that *STAYED CONSTANT* for 3 minutes without being adjusted.
That would be like driving into a parking lot of a huge mall, driving past a parking space, and then starting a huge right turn at 35 mph, holding the steering wheel steady, then flooring the car up to 90 mph, and sliding right into the parking space you passed by when you drove in.
The only difference is the plane had to descend 8000 feet too!
I wish I could animate that with a car!!
I.e., the turn was a perfect circle, and the descent was linear -simultaneously. All while keeping a constant speed until an ACCELERATION at the last 60 seconds.
My first thought is that this could only happen in 1 of 3 ways:
1) the course was pre-planned and programmed into some sort of autopilot system, or
2) there was some sort of beacon inside the Pentagon that a navigation device controlling the plane locked onto. or,
3) there was some sort of Tomahawk-like cruise missile technology in play where a visual of the Pentagon was obtained from overhead on board the plane, and then the guidance system took over.
Stellar work, glad to see this going somewhere.
Thanks! You too!!!
All right back to the trim scan tedium...
As they say, the devil is in the details... of course I never did figure out what the hell that saying was supposed to mean??!!
Originally posted by Caustic Logic
9:37:44 – Last second recorded: NO TRIM DN,,,NO TRIM DN,,,NO TRIM UP,,,NO TRIM UP,,,,30.23
There it is. Silly or not.
the pilots were right, at least about the trim being reset in this jumble of numbers.
Next to see where the altitude is listed and look for the impact of these changes and see what I can read.
Am I understanding you correctly that this entire analyis is using the CSV file at the NTSB website?
If that's the case, then it's looking like the pilots were correct. The FDR data is either phony, and they screwed up by forgetting about the altimeter adjustment, OR the plane that the data came from (not necessarily Flight 77) went over the Pentagon at some point, not into it.
This really opens up a huge can of worms you know...
Originally posted by jtma508
Caustic I apologize if you've covered this in the thread but frankly I didn't have the time to read through all of your data. Regarding the often cited altitude discrepencies:
The elevation of Dulles is 313 ft MSL [...]
Barometric pressure increases as you descend --- depending upon the weather system in place. On Sept 11 the weather was beautiful so the barometric pressure would be relatively high --- higher than 29.92. [...] Remember, the plane is in the control of the hijackers as it descends from 18,000ft and they're not going to worry about resetting the altimeter (if they even had a clue that it is normal procedure). [...] Again, sorry if you covered all this. Pilots for 911 Truth doa great job presenting all this.
I don't blame you one bit for not reading it all. I'll be summarizing and presenting at the end whatever I find. all the stuff you mentioned I've been finding as I go. The only ne thing is the pressure changing with descent, which I guessed.
Two things in my last two posts you missed:
1) the "hijacker" does reset the trim from 29.92 to 20.23 at about 9:24, as the plane sescended past 18,000. That's what the pilots said, the animation didn't sho that, that's the problem. located the switch in the CSV. (second to last before yours)
2) The animation may have never been sent from the NTSB - the letter supposedly accompanying it refers instead to a document anybody can get, NOT any animation. I'm not sure but the animation looks to be made by "Snowygrouch." That's a big charge tho... (last post before yours)
I'm a data professional.
good, then perhaps you can have some insights. i'm getting my bearings here but still a bit lost.
Originally posted by nick7261
Am I understanding you correctly that this entire analyis is using the CSV file at the NTSB website?
If that's the case, then it's looking like the pilots were correct. The FDR data is either phony, and they screwed up by forgetting about the altimeter adjustment, OR the plane that the data came from (not necessarily Flight 77) went over the Pentagon at some point, not into it.
This really opens up a huge can of worms you know...
And re; your other observations first: I'm not sure this is locked in. It's pretty steady, and looks like excellent piloting. I'd also add to your list the possibility of a maverick ace terrorist pilot who we've been TOLD was bad and acted bad. It's not the most likely but is possible I feel.
And as for the source: this is all via "AAL_&&_Tabular" hich is a CSV file from the Pilots' website. It's at neither the NS Archive nor NTSB site, seems to be an "extra" they threw in with UnderTow's packet.
the Pliots were correct. the hijacker reset the alt. per FAA regulations at 9:24. At least according to this document hich, like the animation it so far matches, I can't totally verify as legit.
And what do you think about the animation source? Ho it's not referred to in the letter? Am I way off there? What is a "flight path study?" Time to call the NTSB and sort this out? If Mr. Grouch made this himelf, of course that changes the nature of the video's charge of an NTSB altitude cover-up, since that was all in the conversion from data to animation. I was suspecting that, and the cover letter for the animation mentioning something instead that seems to NOT be an animation sure looks suspicious...
I was hoping for comments before work, but oh well...
[edit on 2-3-2007 by Caustic Logic]
new topics
-
Any one suspicious of fever promotions events, card only.
The Gray Area: 6 minutes ago -
God's Righteousness is Greater than Our Wrath
Religion, Faith, And Theology: 4 hours ago -
Electrical tricks for saving money
Education and Media: 7 hours ago -
VP's Secret Service agent brawls with other agents at Andrews
Mainstream News: 9 hours ago -
Sunak spinning the sickness figures
Other Current Events: 9 hours ago -
Nearly 70% Of Americans Want Talks To End War In Ukraine
Political Issues: 9 hours ago -
Late Night with the Devil - a really good unusual modern horror film.
Movies: 11 hours ago
top topics
-
VP's Secret Service agent brawls with other agents at Andrews
Mainstream News: 9 hours ago, 9 flags -
Cats Used as Live Bait to Train Ferocious Pitbulls in Illegal NYC Dogfighting
Social Issues and Civil Unrest: 13 hours ago, 8 flags -
Electrical tricks for saving money
Education and Media: 7 hours ago, 4 flags -
HORRIBLE !! Russian Soldier Drinking Own Urine To Survive In Battle
World War Three: 17 hours ago, 3 flags -
Sunak spinning the sickness figures
Other Current Events: 9 hours ago, 3 flags -
Nearly 70% Of Americans Want Talks To End War In Ukraine
Political Issues: 9 hours ago, 3 flags -
Late Night with the Devil - a really good unusual modern horror film.
Movies: 11 hours ago, 2 flags -
The Good News According to Jesus - Episode 1
Religion, Faith, And Theology: 14 hours ago, 1 flags -
God's Righteousness is Greater than Our Wrath
Religion, Faith, And Theology: 4 hours ago, 0 flags -
Any one suspicious of fever promotions events, card only.
The Gray Area: 6 minutes ago, 0 flags
active topics
-
SETI chief says US has no evidence for alien technology. 'And we never have'
Aliens and UFOs • 47 • : andy06shake -
Any one suspicious of fever promotions events, card only.
The Gray Area • 0 • : Cavemannick -
God's Righteousness is Greater than Our Wrath
Religion, Faith, And Theology • 1 • : andy06shake -
Sunak spinning the sickness figures
Other Current Events • 7 • : xWorldxGonexMadx -
HORRIBLE !! Russian Soldier Drinking Own Urine To Survive In Battle
World War Three • 33 • : Degradation33 -
How ageing is" immune deficiency"
Medical Issues & Conspiracies • 34 • : angelchemuel -
Nearly 70% Of Americans Want Talks To End War In Ukraine
Political Issues • 13 • : Freeborn -
Mood Music Part VI
Music • 3101 • : ThatSmellsStrange -
VP's Secret Service agent brawls with other agents at Andrews
Mainstream News • 41 • : ThatSmellsStrange -
New whistleblower Jason Sands speaks on Twitter Spaces last night.
Aliens and UFOs • 55 • : baablacksheep1