It looks like you're using an Ad Blocker.
Please white-list or disable AboveTopSecret.com in your ad-blocking tool.
Thank you.
Some features of ATS will be disabled while you continue to use an ad-blocker.

NIST WTC7 status report
page: 5share:
Then also read this post with my best NIST-LDEO time comparison table posted on the subject :
www.abovetopsecret.com...
Please read that table also carefully!
Then read this post :
www.abovetopsecret.com...
You can find many more seismic posts from me to address the sloppy scientific interpretation from Pallisades institute, in that same above mentioned thread, and in this one :
www.abovetopsecret.com...
( The Complete 9/11 Timeline ( interactive ).)
f.ex. this post :
www.abovetopsecret.com...
and many more in that thread also.
Somewhere Long_Lance has helped to bring the WTC 1 and 2 seismic charts back from the rougher 10 to 100 sensitivity to the same as the WTC 7 chart, the more precise 0 to 10 sensitivity.
He posted those 2 charts with the 0 to 10 scales, and then you suddenly saw how damn big these small peaks in front of the even much bigger peaks in the 10 to 100 WTC 1+2 scales in reality were, and definitely indicated a MAJOR seismic event, comparable to the +500 miles/hr head on collision of 2 aircrafts with the 2 WTC towers, so, not a minor event at all.
We definitely heard the sound of those plane impacts on tv, so why does only the man with the Pier videos, where you can hear those low Herz-scale explosion noises, report on seismic events, like can be seen in those (10 to 100) re-scaled to (0 to 10) sensitivity seismic charts.
Can't find the re-scaled seismic charts posted by Long_Lance at the moment, someone knows where to find them at this 9/11 forum ?
They were not posted in these above 2 mentioned threads however. Could be in the huge Boeing thread.
www.abovetopsecret.com...
Please read that table also carefully!
Thus, the 31.0 sec point on the LDEO graph of the collapse sequence of WTC-7 can be compared to the real-time moment when we all saw WTC-7 starting to totally collapse on tv at 5:20:54 p.m. on September 11, 2001.
To confirm to yourself that there actually is a seismic signal-arrival delay time of 17 seconds in ALL 5 LDEO seismic graphs implemented, you just have to look at the two first ones, the plane impacts, to see that the moment of the first plane's impact is at 16.95 seconds, and the second plane's impact is at 16.35 seconds after the zero starting point on the graphs.
Popular Mechanics served us this image link from the LDEO site :
media.popularmechanics.com...
where you can confirm these R =Rayleigh seismic-signal arrival times yourself. (Image already posted in my answer to bsbray11 earlier in this thread).
The S? 12.8 sec signal arrival on this chart for both WTC-tower collapses is their assumption of the first S-wave (Love-waves) arrival at Pallisades seismic station. An S-wave travels somewhat faster than an R-wave in the upper earth crust.
I am still confused why LDEO did not include their WTC-7 collapse graph in this overall graph of their 9/11 seismic events, since they went to great length to allign the zero starting points of the 4 events they showed, and even compensated the nm/sec data of all 4 events to arrive at a comparable size of all 4 graphs (they did not use in that Popular Mechanics image their 0-10 and 0-100 nm/sec usual scales like in their other pages), which in fact obscured the fact that the Tower collapses were of a 10 times greater magnitude. They must have known these graphs were gone to be viewed by an overwhelmingly non-scientificly schooled audience, but they still opted to adhere to a difficult to interprete and/or compare attitude. The fact that they did not indicate clearly the signal delay time of 17 sec was also not helpfull. You had to read another pdf file of dr. Kim to find a short mentioning of this fact.
When it became clear to me that the first sign of internal collapse aligned on their graph with a moment, 4 or 5 seconds AFTER those first huge spikes on their graph, I have taken one month time to check and re-check all other possibilities, but could not find a plausible explanation for those huge spikes, long before even the penthouse roof of WTC-7 dented a bit.
And the most damning evidence for the NIST draft report conclusion is the fact that the energy involved in the first plane's WTC tower impact graph, (which btw was straight bulls-eye at the centre collumns of that tower, sending a huge vibration into the bedrock) and the energy involved in those huge spikes in the WTC-7 graph BEFORE visual signs of collapse, are clearly nearly identical, WHEN plotted at the same scale of 0-10 nm/sec.
And the actual collapse spikes are much smaller than those first pre-collapse spikes, while in fact the whole building mass roared to the ground, instead of a few columns giving way.
The only difference is the height of the WTC tower and WTC-7.
Just perform a little test yourself. Take a 30 cm metal rod or ruler, press it at 5 cm of it's top firmly with your thumb against a flat side of a table, snap one's other hand index finger against the top. Repeat that same force used for the finger snap for 15 cm of the same rod. Note which event caused the strongest vibration in the table and which event had the longest duration.
It's the 15 cm rod.
That means that the earliest huge spikes in the WTC-7 graph were caused by an event even more energy-rich than the impact of the first plane, to be able to cause a nearly identical spike length in the seismic graph with the same 0-10 nm/sec scale. And 5 seconds later the penthouse roof dented a bit (23s graph position), and another 8 seconds later -13 seconds total- (31s graph position) the obvious collapse started, which lasted about 8 - 9 seconds, the visual collapse ending at a total of 21 seconds after those first huge spikes at the 18-19 s point on the LDEO WTC-7 graph. That visual collapse end is the 40s graph position.
Then read this post :
www.abovetopsecret.com...
Equality of seismic graphs observation.
Don't let yourself get fooled by these two LDEO Palissade's 10 times smaller plotted (0-100 nm/s), seismic graphs of the WTC 2 (south tower), first collapse; and the WTC 1 (north tower), second collapse.
Do yourself a favour, and blow these 2 seismic graphs up 10 times, to the same sensibility as the WTC 7 collapse graph.
Do not pay attention yet to the actual immens collapse peaks, which will run off the paper, but look at the ones in front of them.
If you compare these 2 new (0-10 nm/s) enlarged ones to the WTC 7 graph, to your surprise, you will find the same huge spikes suddenly pre-run the actual visual collapse points, same as in the WTC 7 graph.
Interesting, how some people really used every trick in the book to give the average Joe the impression that all was well with these seismic graphs.
What's much more interesting, is the fact that these pre-collapse, suddenly appearing huge spikes are of the same magnitude as the huge precollapse spikes in the WTC 7 seismic graph.
That means that the originating event was for all 3 collapses the SAME kind of event.
However, if we saw here the effect of bearing columns snap, we should expect that the resulting vibrational force on the bedrock would be MUCH bigger for the 110 stories high collumns of WTC 1 and 2 snapping, than for the 44 stories high collumns in the WTC 7 building snapping.
Perhaps as big as 3 times more.
However, the effects on the bedrock are nearly identical.......
Tell me, how to explain that observation.
You can find many more seismic posts from me to address the sloppy scientific interpretation from Pallisades institute, in that same above mentioned thread, and in this one :
www.abovetopsecret.com...
( The Complete 9/11 Timeline ( interactive ).)
f.ex. this post :
www.abovetopsecret.com...
and many more in that thread also.
Somewhere Long_Lance has helped to bring the WTC 1 and 2 seismic charts back from the rougher 10 to 100 sensitivity to the same as the WTC 7 chart, the more precise 0 to 10 sensitivity.
He posted those 2 charts with the 0 to 10 scales, and then you suddenly saw how damn big these small peaks in front of the even much bigger peaks in the 10 to 100 WTC 1+2 scales in reality were, and definitely indicated a MAJOR seismic event, comparable to the +500 miles/hr head on collision of 2 aircrafts with the 2 WTC towers, so, not a minor event at all.
We definitely heard the sound of those plane impacts on tv, so why does only the man with the Pier videos, where you can hear those low Herz-scale explosion noises, report on seismic events, like can be seen in those (10 to 100) re-scaled to (0 to 10) sensitivity seismic charts.
Can't find the re-scaled seismic charts posted by Long_Lance at the moment, someone knows where to find them at this 9/11 forum ?
They were not posted in these above 2 mentioned threads however. Could be in the huge Boeing thread.
WATS. That is prime research, man.
Long story short, WTC7 suffered a massive seismic event comparable to the plane impacts into the Twin Towers, before the Penthouse collapsed. The ensuing global collapse of WTC7 didn't even compare to the initial, pre-collapse event, and most all of the building fell to the ground during that time. Right?
Therefore there was a release of energy before the Penthouse collapse that was greater than the energy of almost all of the building smashing to the ground in 8 seconds.
So what packs more energy than the building itself collapsing?
[edit on 27-10-2006 by bsbray11]
But only by hours of manually sifting through all threads I ever posted in, the ATS Search function does not bring the Long Lance posts up with the
terms " Long Lance seismic LaBTop ". And also not by adding whatever other terms. Strange indeed.
www.abovetopsecret.com...
Thread title : Physics Prof Says Bombs not Planes brought down wtc .
Here you expect to find at the bottom of page 8 those, re-scaled by Long Lance, seismic LDEO charts after I posted this :
www.abovetopsecret.com...
The problem is, they are not in Long Lance post anymore :
www.abovetopsecret.com...
So I give them back to the readers again :
First Collapse: 13:59:04 (UTC), 09:59:04 (EDT)
1. Collapse South Tower, scale 0 to 10 nm/s :

images5.theimagehosting.com...
Second Collapse: 14:28:31 (UTC), 10:28:31 (EDT)
2. Collapse North Tower, scale 0 to 10 nm/s :

images5.theimagehosting.com...
Building 7 Collapse: 21:20:33 (UTC), 17:20:33 (EDT)
Collapse WTC 7, scale 0 to 10 nm/s :

images5.theimagehosting.com...
IMPORTANT NOTE: the 23 sec point in this graph shows in fact the time registered by NIST of the visually noticeable denting of the WTC 7 penthouse in New York. All big peaks in front of that 23 sec point were not noted in New York as visual events!
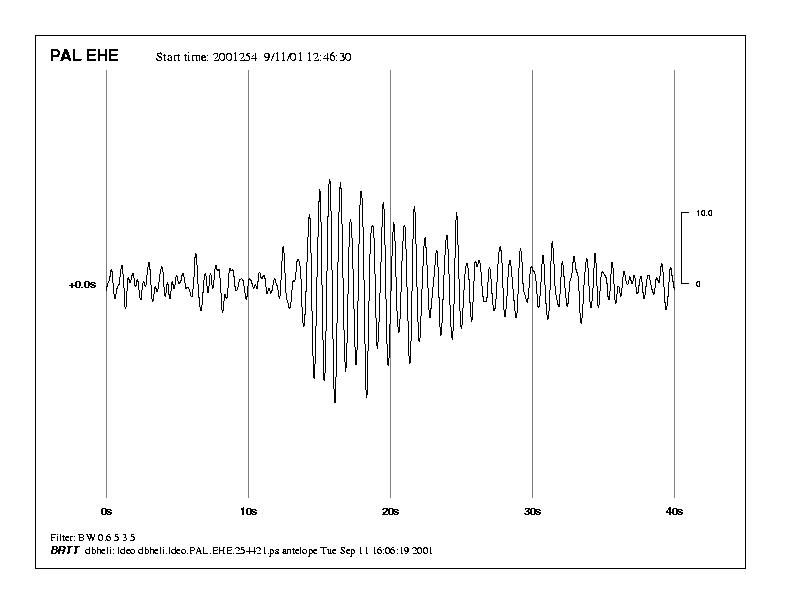
To compare the seismic planes impact energies to the above pre-collapse peaks, look at the big impact peaks in the next 2 graphs, they are identical in energy amount to the pre collapse peaks from WTC 1, 2 and 7. :
First Impact: 12:46:26 (UTC), 08:46:26 (EDT)
First impact, scale 0 to 10 nm/s :
www.ldeo.columbia.edu...
Second Impact: 13:02:54 (UTC), 09:02:54 (EDT)
Second Impact, scale 0 to 10 nm/s :
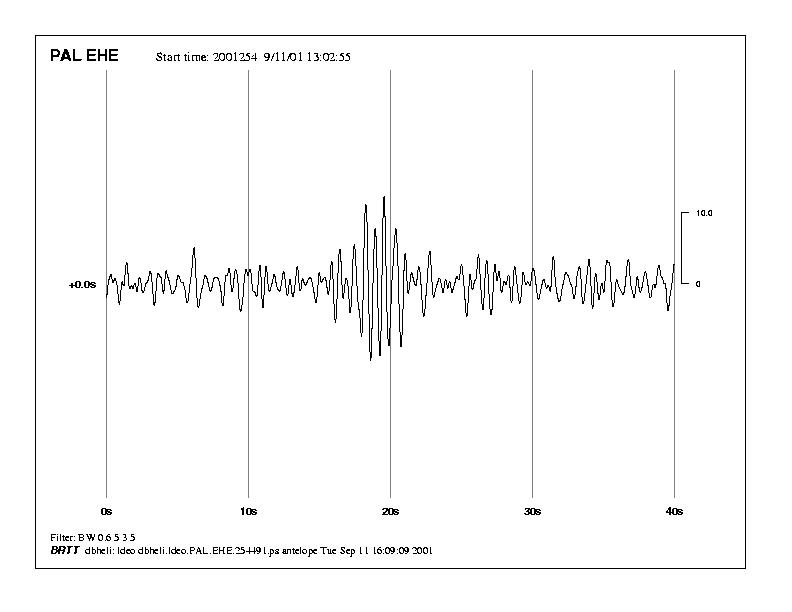
www.ldeo.columbia.edu...
Again, here you can find the 5 -original, with all texts- LDEO graphs online :
www.ldeo.columbia.edu...
PS: if all of the 5 graphs do not show at first, like they did for me, then first open them in other new browser tabs or windows, by clicking the red .jpg links under the pictures.
Then all 5 pictures will show when you reload this ATS page.
[edit on 28/10/06 by LaBTop]
Originally posted by LaBTop on 25/11/05 at 23:20
If you convert the 2 seismic charts of WTC 1 and 2 to the same sensitivity of 0-10 nm/s, instead of the offered by LDEO sensitivity of 10-100 nm/s, you will see that suddenly these 2 charts have collapse-preceeding peaks exactly as high as in the WTC 7 chart. And all three of them are identical, meaning they used the same type and power of charges for the first hard blow to all three structures.
Do not get detoriated by the wicked way they presented those graphs, the 23 second point in that WTC 7 chart is the actual, REAL time event in New York when the roof of the penthouse dented, the first visual sign of collapse there.
It took 17 seconds for the accompanying seismic signal to reach the LDEO station. (and they threw in another trick, their chart starting point is 7 seconds off ! They really tried everything to mud the picture)
And what do you see?
There is a huge set of magnitude-peaks in front of that 23 seconds signal, and it is even 1/3 bigger as the actual collapse signals after the 23 seconds point on that WTC 7 chart.
And those peaks are also suddenly showing up on those 2 other charts from WTC 1 and 2, preceeding the actual collapse signals.
All you have to do is blow up those 2 charts with a factor 10. (Then they are converted to the same 0-10 nm/s sensitivity as the chart from WTC 7)
www.abovetopsecret.com...
Thread title : Physics Prof Says Bombs not Planes brought down wtc .
Here you expect to find at the bottom of page 8 those, re-scaled by Long Lance, seismic LDEO charts after I posted this :
www.abovetopsecret.com...
The problem is, they are not in Long Lance post anymore :
www.abovetopsecret.com...
So I give them back to the readers again :
First Collapse: 13:59:04 (UTC), 09:59:04 (EDT)
1. Collapse South Tower, scale 0 to 10 nm/s :
images5.theimagehosting.com...
Second Collapse: 14:28:31 (UTC), 10:28:31 (EDT)
2. Collapse North Tower, scale 0 to 10 nm/s :
images5.theimagehosting.com...
Building 7 Collapse: 21:20:33 (UTC), 17:20:33 (EDT)
Collapse WTC 7, scale 0 to 10 nm/s :
images5.theimagehosting.com...
IMPORTANT NOTE: the 23 sec point in this graph shows in fact the time registered by NIST of the visually noticeable denting of the WTC 7 penthouse in New York. All big peaks in front of that 23 sec point were not noted in New York as visual events!
To compare the seismic planes impact energies to the above pre-collapse peaks, look at the big impact peaks in the next 2 graphs, they are identical in energy amount to the pre collapse peaks from WTC 1, 2 and 7. :
First Impact: 12:46:26 (UTC), 08:46:26 (EDT)
First impact, scale 0 to 10 nm/s :
www.ldeo.columbia.edu...
Second Impact: 13:02:54 (UTC), 09:02:54 (EDT)
Second Impact, scale 0 to 10 nm/s :
www.ldeo.columbia.edu...
Again, here you can find the 5 -original, with all texts- LDEO graphs online :
www.ldeo.columbia.edu...
PS: if all of the 5 graphs do not show at first, like they did for me, then first open them in other new browser tabs or windows, by clicking the red .jpg links under the pictures.
Then all 5 pictures will show when you reload this ATS page.
[edit on 28/10/06 by LaBTop]
Question LabTop:
Do these graphs show "p" waves as stated by Maudib that an explosive has to show "p" waves? I don't know how to analyze these graphs. Is it true that explosives would have to show "p" waves on the graphs? Thanks.
OK. More than one question but.
Do these graphs show "p" waves as stated by Maudib that an explosive has to show "p" waves? I don't know how to analyze these graphs. Is it true that explosives would have to show "p" waves on the graphs? Thanks.
OK. More than one question but.
LaBTop may be better informed on this than I am, but I'll try an answer, Griff.
P waves move by compression laterally through the ground, while S waves create a motion that moves perpendicularly to the direction in which the wave is traveling.
A website I found has these representations of P and S waves, respectively:
If I have this correct, an explosive will only necessarily produce mainly P-waves if the explosive itself is in the bedrock, etc., causing a compression motion to issue directly into and through the ground. This would be a very weak assumption for Muaddib to make.
If a charge cuts a column (either laterally or diagonally), and the column transfers momentum down into the bedrock perpendicularly to the ground (both from the shock of the explosion, AND any momentum transfers resulting from higher structures falling downwards), then would that not create S-waves? It shouldn't cause any major lateral compression motions, as the explosives aren't sending out shock waves through the ground laterally, but causing the columns to transfer momentum downwards, perpendicularly into the Earth, which would be an S-wave.
[edit on 28-10-2006 by bsbray11]
P waves move by compression laterally through the ground, while S waves create a motion that moves perpendicularly to the direction in which the wave is traveling.
A website I found has these representations of P and S waves, respectively:


If I have this correct, an explosive will only necessarily produce mainly P-waves if the explosive itself is in the bedrock, etc., causing a compression motion to issue directly into and through the ground. This would be a very weak assumption for Muaddib to make.
If a charge cuts a column (either laterally or diagonally), and the column transfers momentum down into the bedrock perpendicularly to the ground (both from the shock of the explosion, AND any momentum transfers resulting from higher structures falling downwards), then would that not create S-waves? It shouldn't cause any major lateral compression motions, as the explosives aren't sending out shock waves through the ground laterally, but causing the columns to transfer momentum downwards, perpendicularly into the Earth, which would be an S-wave.
[edit on 28-10-2006 by bsbray11]
Makes sense BsBray. BTW, IMO, you're gonna make a great engineer when you graduate.
You have voted LaBTop for the Way Above Top Secret award. You have used all of your votes for this month.
Sorry BsBray, I wanted to vote for both of you guys but I guess I've used mine for this month. Next month, you get one from me automatically.
Good research both of you. Keep up the good work.
Nah, this is totally LaBTop here. I feel like an ass for not noticing it before, because I remember him posting all this stuff about the seismic
activity months ago, and I guess I just didn't get the significance of it, skimmed too much or something.
On the subject of seismic stuff, though:
What are all of these "further collapses", after WTC1 had already fallen?
On the subject of seismic stuff, though:

What are all of these "further collapses", after WTC1 had already fallen?
look awfully lot like delayed mis-firings of explosive charges to me. Why? :
1. The signals are spaced exactly 14 minutes between eachother ; the 3 visible ones on this chart. At 11:01 - 11:15 - 11:29 EDT.
2. The signals seem too massive to account to shifting debris masses, we would have seen firefighters, sifting through the debris for their 'brothers', running away like hell, and reporting these events afterwards.
3. The first 11:01 signal strength is comparable to the second plane impact, the plane which nearly missed the south tower.
4. The second 11:15 signal is more massive than the first plane impact, the head on hit on the North Tower. It is also at least 4 to 5 times bigger in magnitude.
That was quite an event. Never heard or read anything about it however!
We must find some mentioning of a big boom around 11:15 on 9/11, preferably in the NIST reports, or anywhere else.
5. The last signal is too small to even concider as a collapse, especially if you compare it to the 11:22 signal they not even indicate on their chart, while that is clearly much bigger than the 11:29 signal.
This chart is so full with different data, it get's my price for second-best smokescreen of the year.
They introduce times as EDT and UTC, they throw nm/s magnitude-values around from 273 to 4545 to 1600 nm/s (these are in fact the max magnitude values for respectively first plane impact, first collapse South Tower, and the max spacing between the 30 min timelines intervals.)
It does however not give the most important data on the chart, namely which wave form is depicted here, s- (Love-waves) , r- (Raleigh-waves) or p -waves.
My guess is R-waves.
So, Griff,
then why did Muaddib never asked the next logical question to himself and us :
"Why did LDEO, in casu the US government, never showed us the telltaling P-waves seismic charts of the 9/11 seismic events ?
Here is another seismic LDEO chart, my price for first-best smokescreen of the year :

media.popularmechanics.com...
Here we have to deal with a heap of different data :
East-west component (so, where's the North-south one?)
0.6 to 5.0 Herz (scale sensitivity or magnitude or what?)
R and S waves, (but you see just one graph line for all 4 events, the R-wave)
R-arrival values between 16.95, 16.35, 16.95 and 16.42 (seconds?)
Time in seconds, magnitude in nm/s (=nanometer per second)
288, 206, 4204 and 5777 nm/s for the 4 graphs, which differ again from the 273 and 4545 nm/s values from bsbray's chart above.
Seismic earthquake energy values of ML = 0.9, 0.7, 2.1 and 2.3 .
Distances in km, az and baz values (?)
Red and blue grouped graph lines to indicate which events belonged to which tower.
This makes these graphs utterly difficult to interprete for non scientificly schooled readers, which is their exact purpose in my opinion.
The "People" have a right to get informed in an understandable manner, not like this, for such an earthshattering historical event like 9/11/2001.
I think I am one of a few on this board who think they really do understand these LDEO graphs.
The rest doesn't grab the grave implications at all from what can be read in those graphs, and what not in the missing ones.
There were a LOT of 'handheld' seismic instruments at several Manhattan spots operating during 9/11.
The all seeing and knowing government has decided we don't need to see these, they are "too vague" to be applicable.
YEAH, RIGHT! the only ones which were operating, so to say, on top of the events !
And were designed to read P-WAVES, because they monitored EXPLOSIONS at building sites in the middle of NEW YORK !
Wake up. See the enemy within. NAZIES. Persons who prefere torture above law.
NAZIES! The offspring of the 20,000-plus hardcore german nazies brought to the USA just after the war, to "help" encounter the communist danger.
Yup, RIGHT.
Do some research WHO exactly gave the orders to import these SWINES.
And let them and their families gather immense power in the last decenniae.
1. The signals are spaced exactly 14 minutes between eachother ; the 3 visible ones on this chart. At 11:01 - 11:15 - 11:29 EDT.
2. The signals seem too massive to account to shifting debris masses, we would have seen firefighters, sifting through the debris for their 'brothers', running away like hell, and reporting these events afterwards.
3. The first 11:01 signal strength is comparable to the second plane impact, the plane which nearly missed the south tower.
4. The second 11:15 signal is more massive than the first plane impact, the head on hit on the North Tower. It is also at least 4 to 5 times bigger in magnitude.
That was quite an event. Never heard or read anything about it however!
We must find some mentioning of a big boom around 11:15 on 9/11, preferably in the NIST reports, or anywhere else.
5. The last signal is too small to even concider as a collapse, especially if you compare it to the 11:22 signal they not even indicate on their chart, while that is clearly much bigger than the 11:29 signal.
This chart is so full with different data, it get's my price for second-best smokescreen of the year.
They introduce times as EDT and UTC, they throw nm/s magnitude-values around from 273 to 4545 to 1600 nm/s (these are in fact the max magnitude values for respectively first plane impact, first collapse South Tower, and the max spacing between the 30 min timelines intervals.)
It does however not give the most important data on the chart, namely which wave form is depicted here, s- (Love-waves) , r- (Raleigh-waves) or p -waves.
My guess is R-waves.
So, Griff,
then why did Muaddib never asked the next logical question to himself and us :
"Why did LDEO, in casu the US government, never showed us the telltaling P-waves seismic charts of the 9/11 seismic events ?
Here is another seismic LDEO chart, my price for first-best smokescreen of the year :
media.popularmechanics.com...
Here we have to deal with a heap of different data :
East-west component (so, where's the North-south one?)
0.6 to 5.0 Herz (scale sensitivity or magnitude or what?)
R and S waves, (but you see just one graph line for all 4 events, the R-wave)
R-arrival values between 16.95, 16.35, 16.95 and 16.42 (seconds?)
Time in seconds, magnitude in nm/s (=nanometer per second)
288, 206, 4204 and 5777 nm/s for the 4 graphs, which differ again from the 273 and 4545 nm/s values from bsbray's chart above.
Seismic earthquake energy values of ML = 0.9, 0.7, 2.1 and 2.3 .
Distances in km, az and baz values (?)
Red and blue grouped graph lines to indicate which events belonged to which tower.
This makes these graphs utterly difficult to interprete for non scientificly schooled readers, which is their exact purpose in my opinion.
The "People" have a right to get informed in an understandable manner, not like this, for such an earthshattering historical event like 9/11/2001.
I think I am one of a few on this board who think they really do understand these LDEO graphs.
The rest doesn't grab the grave implications at all from what can be read in those graphs, and what not in the missing ones.
There were a LOT of 'handheld' seismic instruments at several Manhattan spots operating during 9/11.
The all seeing and knowing government has decided we don't need to see these, they are "too vague" to be applicable.
YEAH, RIGHT! the only ones which were operating, so to say, on top of the events !
And were designed to read P-WAVES, because they monitored EXPLOSIONS at building sites in the middle of NEW YORK !
Wake up. See the enemy within. NAZIES. Persons who prefere torture above law.
NAZIES! The offspring of the 20,000-plus hardcore german nazies brought to the USA just after the war, to "help" encounter the communist danger.
Yup, RIGHT.
Do some research WHO exactly gave the orders to import these SWINES.
And let them and their families gather immense power in the last decenniae.
The most important observations to interprete all 5 graphs are 2 facts :
The clocks in New York and in Pallisades (N.Y.) showed ofcourse the exact same time on 9/11.
But the seismic signal needed 17 seconds to travel through the bedrock to be written on seismic instruments in Pallisades.
Thus, if a building showed signs of collapse in New York, the seismic signal accompanying that visual sign needed 34 km / 2 km per sec = 17 seconds to travel to Pallisades. (+ or - 2 sec uncertainty stated by LDEO)
That's the most important feature they did not clearly stated in those LDEO graphs.
The last above seismic chart posted by me shows a few interesting features :
The small S- wave arrives first at 12.8 seconds (but they doubt it is an S-wave, use of ? ), then the huge R-(surface)waves arrive thereafter, much bigger, starting at 16.35, 16.42 and 16.95 seconds after the graphs zero point.
So quite well within the uncertainty boundaries of LDEO bedrock passage proposal, 17 seconds, + or - 2 seconds.
I suppose the R-waves are the surface waves from above.
(P=primary, S=secondary and R=Raleigh or surface waves)
This means that we should see some P-waves first, then S-waves and then R-waves.
I suppose all these waves are written as separate lines on seismographs, as we have seen so often at the Discovery Channel films.
Then they made one graph of the 3 waveforms, overlapping in one single line.
But we can't see properly if there are P-waves, because they show us the 2 collapse graphs again with a sensitivity far rougher than the plane impacts and the WTC 7 collapse, here not even depicted btw.
Can someone do that trick again to show all those 4 graphs (2 impacts, 2 collapses) from that last seismic graph in the same sensitivity?
So in fact, you only have to blow up the 2 collapse ones with a factor 100x in Paint.
That's what Long Lance did btw.
I'll promise you, you suddenly will see all those fastests P-waves from Muaddib, (explosives, he said himself, remember), pre-running those 2 then suddenly much bigger S-waves, and those R-waves will run off the paper again, no big deal, we want to see those smaller first arriving waves much clearer then we can see now. Now we do not see them at all since they are shown as 4204 and 5777 nm/s sensitive lines. against the 288 and 206 nm/s sensitivity of the plane impacts.
The clocks in New York and in Pallisades (N.Y.) showed ofcourse the exact same time on 9/11.
But the seismic signal needed 17 seconds to travel through the bedrock to be written on seismic instruments in Pallisades.
Thus, if a building showed signs of collapse in New York, the seismic signal accompanying that visual sign needed 34 km / 2 km per sec = 17 seconds to travel to Pallisades. (+ or - 2 sec uncertainty stated by LDEO)
That's the most important feature they did not clearly stated in those LDEO graphs.
The last above seismic chart posted by me shows a few interesting features :
The small S- wave arrives first at 12.8 seconds (but they doubt it is an S-wave, use of ? ), then the huge R-(surface)waves arrive thereafter, much bigger, starting at 16.35, 16.42 and 16.95 seconds after the graphs zero point.
So quite well within the uncertainty boundaries of LDEO bedrock passage proposal, 17 seconds, + or - 2 seconds.
www.thetech.org... (Source).
A seismogram is a record of the ground shaking recorded by a seismograph.
The P waves travel fastest through the Earth so they arrive at a seismograph first, followed by the S waves and lastly by the surface waves.

I suppose the R-waves are the surface waves from above.
(P=primary, S=secondary and R=Raleigh or surface waves)
This means that we should see some P-waves first, then S-waves and then R-waves.
I suppose all these waves are written as separate lines on seismographs, as we have seen so often at the Discovery Channel films.
Then they made one graph of the 3 waveforms, overlapping in one single line.
But we can't see properly if there are P-waves, because they show us the 2 collapse graphs again with a sensitivity far rougher than the plane impacts and the WTC 7 collapse, here not even depicted btw.
Can someone do that trick again to show all those 4 graphs (2 impacts, 2 collapses) from that last seismic graph in the same sensitivity?
So in fact, you only have to blow up the 2 collapse ones with a factor 100x in Paint.
That's what Long Lance did btw.
I'll promise you, you suddenly will see all those fastests P-waves from Muaddib, (explosives, he said himself, remember), pre-running those 2 then suddenly much bigger S-waves, and those R-waves will run off the paper again, no big deal, we want to see those smaller first arriving waves much clearer then we can see now. Now we do not see them at all since they are shown as 4204 and 5777 nm/s sensitive lines. against the 288 and 206 nm/s sensitivity of the plane impacts.
quote:
==================================================================
..NIST......NIST...NIST-times are in:........NYRT.................................17sec later in:....PSRT
Interval.....Total...NY events observed by NIST in televised time..........LDEO sig.arrival (sec)
==================================================================
.........................LDEO states begin of collaps at NYRT+PSRT 5:20:33 pm...................-7.0s
...............0.0......LDEO seismic-graph starts at....NYRT+PSRT 5:20:40 pm....................0.0s
.........................Time for first (by New York soil and bedrock) delayed seismic
.........................signals to arrive at LDEO Pallisades seismic station...........................17.0s
..0.0.........0.0.....Movement of east penthouse roofline at 5:20:46 NYRT.....................23.0s
.........................(17+ 6s = 23s PSRT) or (5:20:46+17s = 5:20:63 NYRT)
..0.9.........0.9.....East penthouse kinks between columns 44 and 45............................23.9s
.........................2 windows at floor 40 fail between columns 44 - 45.................23.9s - 24.2s
..0.3.........1.2.....4 windows fail at floor 40................................................................24.2s
.........................East penthouse submerged from view (now inside building).....24.2s - 24.6s
..0.4.....->.1.7.....3 windows break at floors 41 to 44..................................................24.6s
..0.5.........2.2.....East penthouse completely submerged............................................25.1s
..1.8.........4.0.....Windows break along column 46 at floors 37 and 40.........................26.9s
..3.0.........7.0.....North side of west penthouse moves................................................29.9s
.........................Movement of entire north face of WTC7 (vis.above floor 21)....29.9s - 30.1s
..0.2.........7.2.....West end of roof starts to move......................................................30.1s
..0.5.........7.7.....East end of roof starts to move.......................................................30.6s
.........................Façade kink formed along column 46-47...............................30.6s - 30.7s
..0.1.....->.7.9.....West penthouse submerged...........................................................30.7s
..0.3.........8.2.....Global collapse occurs as windows fail between floors 33-39................31.0s
.........................around column 55
==================================================================
Thus, the 31.2 sec point on the LDEO graph of the collapse sequence of WTC-7 ( which is 8.2 sec after the first visual dent in the penthouse roof), can be compared to the real-time moment when we all saw WTC-7 starting to totally collapse on tv at 5:20:54 p.m. on September 11, 2001 (the 14s position on the graph). Because the 23s point on the graph is the arrival of the dent signal, then 8.2 sec pass by, till the 31.2s point on the graph, and then the global collapse signals arrive at Pallisades.
Because we know from NIST that the movement of the east penthouse roofline started at 5:20:46 in New York, and was written on Pallisades seismographs 17 sec later at 5:20:63 pm, we now know there is something fishy going on.
Which is btw the 23s on the LDEO WTC 7 chart. That was their written recording of the arrival of the dent signals.
In fact ofcourse 5:21:03 real time, but my 20:63 time is clearer to see in the WTC 7 graph from LDEO if you write 20:40 at their 0s start time point and 20:50 at their 10s point, and 20:60 (or 21:00!) at their 20s point.
Then 20:63 becomes their 23s point.
Then their 0s chart point is the real time 5:20:40 pm in New York AND in Pallisades !
Because they say so in the left top corner : Start time 21:20:40 = 5:20:40 pm .
The whole damn trick they tried to play on all of you out there in the rest of the world, is the simple lie they put above that WTC 7 graph :
Building 7 Collapse: 17:20:33 (EDT)
And so to see they succeeded all these years to fool all of you.
Because when you write at the front of the 0s=20:40 point their proposed collapse initiation time of 20:33 on that damn chart, and then add 17 seconds you arrive at the convenient chart time of exactly 10 seconds, where all the bigger signals start to arrive, lucky for them !
BUT IT IS ALL A HUGE LIE, because we know already for a year now, that the first visual, a dent, in New York was at 20:46, which is damnit the 6s position on their graph, and then it took 17 sec for that dent signal to pass from New York through the bedrock to Pallisades to be written on their graph at the damn 23s position !
So what do all those HUGE signals in front of the 23s position mean THEN ?
First signals you see is a group of smaller P-waves (explosion waves according to some) between the 5s and 8s position,
then you see a bit bigger and longer group of S-waves arrive between 10s and 16s position,
and then the big R-waves, the surface waves arrive, between the 15s and 20s position on the LDEO graph of WTC 7 collapse.
Of some huge seismic events far before the first arrival of the visual dent signals of the penthouse roof in New York.
Are you average people in the USA so blind that you can't grasp this simple math ?
Do something.
Bring them to justice, the swines who planned all this.
[edit on 29/10/06 by LaBTop]
==================================================================
..NIST......NIST...NIST-times are in:........NYRT.................................17sec later in:....PSRT
Interval.....Total...NY events observed by NIST in televised time..........LDEO sig.arrival (sec)
==================================================================
.........................LDEO states begin of collaps at NYRT+PSRT 5:20:33 pm...................-7.0s
...............0.0......LDEO seismic-graph starts at....NYRT+PSRT 5:20:40 pm....................0.0s
.........................Time for first (by New York soil and bedrock) delayed seismic
.........................signals to arrive at LDEO Pallisades seismic station...........................17.0s
..0.0.........0.0.....Movement of east penthouse roofline at 5:20:46 NYRT.....................23.0s
.........................(17+ 6s = 23s PSRT) or (5:20:46+17s = 5:20:63 NYRT)
..0.9.........0.9.....East penthouse kinks between columns 44 and 45............................23.9s
.........................2 windows at floor 40 fail between columns 44 - 45.................23.9s - 24.2s
..0.3.........1.2.....4 windows fail at floor 40................................................................24.2s
.........................East penthouse submerged from view (now inside building).....24.2s - 24.6s
..0.4.....->.1.7.....3 windows break at floors 41 to 44..................................................24.6s
..0.5.........2.2.....East penthouse completely submerged............................................25.1s
..1.8.........4.0.....Windows break along column 46 at floors 37 and 40.........................26.9s
..3.0.........7.0.....North side of west penthouse moves................................................29.9s
.........................Movement of entire north face of WTC7 (vis.above floor 21)....29.9s - 30.1s
..0.2.........7.2.....West end of roof starts to move......................................................30.1s
..0.5.........7.7.....East end of roof starts to move.......................................................30.6s
.........................Façade kink formed along column 46-47...............................30.6s - 30.7s
..0.1.....->.7.9.....West penthouse submerged...........................................................30.7s
..0.3.........8.2.....Global collapse occurs as windows fail between floors 33-39................31.0s
.........................around column 55
==================================================================
Thus, the 31.2 sec point on the LDEO graph of the collapse sequence of WTC-7 ( which is 8.2 sec after the first visual dent in the penthouse roof), can be compared to the real-time moment when we all saw WTC-7 starting to totally collapse on tv at 5:20:54 p.m. on September 11, 2001 (the 14s position on the graph). Because the 23s point on the graph is the arrival of the dent signal, then 8.2 sec pass by, till the 31.2s point on the graph, and then the global collapse signals arrive at Pallisades.
Because we know from NIST that the movement of the east penthouse roofline started at 5:20:46 in New York, and was written on Pallisades seismographs 17 sec later at 5:20:63 pm, we now know there is something fishy going on.
Which is btw the 23s on the LDEO WTC 7 chart. That was their written recording of the arrival of the dent signals.
In fact ofcourse 5:21:03 real time, but my 20:63 time is clearer to see in the WTC 7 graph from LDEO if you write 20:40 at their 0s start time point and 20:50 at their 10s point, and 20:60 (or 21:00!) at their 20s point.
Then 20:63 becomes their 23s point.
Then their 0s chart point is the real time 5:20:40 pm in New York AND in Pallisades !
Because they say so in the left top corner : Start time 21:20:40 = 5:20:40 pm .
The whole damn trick they tried to play on all of you out there in the rest of the world, is the simple lie they put above that WTC 7 graph :
Building 7 Collapse: 17:20:33 (EDT)
And so to see they succeeded all these years to fool all of you.
Because when you write at the front of the 0s=20:40 point their proposed collapse initiation time of 20:33 on that damn chart, and then add 17 seconds you arrive at the convenient chart time of exactly 10 seconds, where all the bigger signals start to arrive, lucky for them !
BUT IT IS ALL A HUGE LIE, because we know already for a year now, that the first visual, a dent, in New York was at 20:46, which is damnit the 6s position on their graph, and then it took 17 sec for that dent signal to pass from New York through the bedrock to Pallisades to be written on their graph at the damn 23s position !
So what do all those HUGE signals in front of the 23s position mean THEN ?
First signals you see is a group of smaller P-waves (explosion waves according to some) between the 5s and 8s position,
then you see a bit bigger and longer group of S-waves arrive between 10s and 16s position,
and then the big R-waves, the surface waves arrive, between the 15s and 20s position on the LDEO graph of WTC 7 collapse.
Of some huge seismic events far before the first arrival of the visual dent signals of the penthouse roof in New York.
Are you average people in the USA so blind that you can't grasp this simple math ?
Do something.
Bring them to justice, the swines who planned all this.
[edit on 29/10/06 by LaBTop]
Great work, LabTop, as always.
I've placed the times and events on the graph so that it's easier to digest for those who can't be bothered wading through all of your posts.

Playing devil's advocate here since no one seems to ever challenge you on this stuff...
Firstly what is NIST's source for the 17:20:46 time for the penthouse dent? If they made a mistake with that, then it would explain away the discrepancy. You might want to confirm how they arrived at their time if you can.
Secondly in regards to this:
Do you have any scientific support or basis for this other than a test with a ruler? In fact, even in that practical example, I would maintain that the ruler transfers more energy into the table when it is shorter. Hang 15cm of the ruler out over the edge and hit it with a hammer - the ruler will flail wildly, experiencing the strongest vibration and longest duration waves due to it's elastic nature, however the energy transmitted to the table will be minimal. Most of the energy is used up in the elastic motion of the ruler. Now shorten the hang-over to 2cm and hit it with a hammer - the ruler will experience mild vibration while you'll likely put a nasty dent in the table as most of the energy is transferred it. Try putting your thumb under the ruler in both examples and see which hit you'd rather take.
In addition, the plane impacts were perpendicular to the tower support columns, so most of the energy went into bending the building, whereas the event which caused the seismic event from WTC7 is an unknown. If it was a vertical collapse (or indeed an explosion at the base columns) then the energy would be transferred directly down the lengths of the support columns and thus transferred to the earth more efficiently, though allowing of course for energy loss through deflection and inelastic compression.
So my point is that those seismic readings are very damning if NIST's timing of the penthouse dent is correct, however comparing the energy of that seismic event to the plane impacts has debateable merit. Perhaps a more valid comparison would be with the global collapse of the building itself. Something happened before any visible signs of collapse which released more peak energy than the collapse of the entire building to the very ground 8 seconds later.
[edit on 2006-10-29 by wecomeinpeace]
I've placed the times and events on the graph so that it's easier to digest for those who can't be bothered wading through all of your posts.
Playing devil's advocate here since no one seems to ever challenge you on this stuff...
Firstly what is NIST's source for the 17:20:46 time for the penthouse dent? If they made a mistake with that, then it would explain away the discrepancy. You might want to confirm how they arrived at their time if you can.
Secondly in regards to this:
Originally posted by LabTop
And the most damning evidence for the NIST draft report conclusion is the fact that the energy involved in the first plane's WTC tower impact graph, (which btw was straight bulls-eye at the centre collumns of that tower, sending a huge vibration into the bedrock) and the energy involved in those huge spikes in the WTC-7 graph BEFORE visual signs of collapse, are clearly nearly identical, WHEN plotted at the same scale of 0-10 nm/sec.
[...]
Just perform a little test yourself. Take a 30 cm metal rod or ruler, press it at 5 cm of it's top firmly with your thumb against a flat side of a table, snap one's other hand index finger against the top. Repeat that same force used for the finger snap for 15 cm of the same rod. Note which event caused the strongest vibration in the table and which event had the longest duration. It's the 15 cm rod.
That means that the earliest huge spikes in the WTC-7 graph were caused by an event even more energy-rich than the impact of the first plane, to be able to cause a nearly identical spike length in the seismic graph with the same 0-10 nm/sec scale.
Do you have any scientific support or basis for this other than a test with a ruler? In fact, even in that practical example, I would maintain that the ruler transfers more energy into the table when it is shorter. Hang 15cm of the ruler out over the edge and hit it with a hammer - the ruler will flail wildly, experiencing the strongest vibration and longest duration waves due to it's elastic nature, however the energy transmitted to the table will be minimal. Most of the energy is used up in the elastic motion of the ruler. Now shorten the hang-over to 2cm and hit it with a hammer - the ruler will experience mild vibration while you'll likely put a nasty dent in the table as most of the energy is transferred it. Try putting your thumb under the ruler in both examples and see which hit you'd rather take.
In addition, the plane impacts were perpendicular to the tower support columns, so most of the energy went into bending the building, whereas the event which caused the seismic event from WTC7 is an unknown. If it was a vertical collapse (or indeed an explosion at the base columns) then the energy would be transferred directly down the lengths of the support columns and thus transferred to the earth more efficiently, though allowing of course for energy loss through deflection and inelastic compression.
So my point is that those seismic readings are very damning if NIST's timing of the penthouse dent is correct, however comparing the energy of that seismic event to the plane impacts has debateable merit. Perhaps a more valid comparison would be with the global collapse of the building itself. Something happened before any visible signs of collapse which released more peak energy than the collapse of the entire building to the very ground 8 seconds later.
[edit on 2006-10-29 by wecomeinpeace]
the time in the second red text must read (LDEO 17:21:03) and not 17:20:03.
Or eventually 17:20:63 . (I know you were in a hurry, hehhe. I was making a nearly identical drawing also already, we both used nearly the same text, logic rules.
You saved me from having to find my password back again for one of those picture uploading sites.)
The NIST timestamp of 17:20:46 was printed inside the picture made by some italian named photographer, who made that picture of the dent, NIST used it on one of its last pages of the draft report about WTC 7.
Howard caused me to find that picture by starting a post about the NIST Draft report last year april, and by reading the draft report, I found that picture in the last pages, and then I thanked him for given me a very solid timestamp comparison between the dent and both NIST times and LDEO times.
I have it somewhere on my HD's, but I also posted a link to that picture in one of the 2 threads I hinted at before. I will look it up and post it, asap.
The ruler :
You must clamp it in a vertical position (to the side of the table) and not in a horizontal one.
It must resemble a steel skyscraper embedded in bedrock for at least 5 % of its total height.
And I tried to explain the tuning-fork vibrations effect of two 110 stories and one 44 stories high buildings on their underlaying bedrock, when hit by explosions at their bases, and the same effect when hit by 2 planes at or near the top.
Seemed not to have been clear enough, my bad.
www.abovetopsecret.com...
I would be extremely surprised when NIST would come up with a rehash of that timestamp in exactly that penthouse dent picture.....
Or eventually 17:20:63 . (I know you were in a hurry, hehhe. I was making a nearly identical drawing also already, we both used nearly the same text, logic rules.
You saved me from having to find my password back again for one of those picture uploading sites.)
The NIST timestamp of 17:20:46 was printed inside the picture made by some italian named photographer, who made that picture of the dent, NIST used it on one of its last pages of the draft report about WTC 7.
Howard caused me to find that picture by starting a post about the NIST Draft report last year april, and by reading the draft report, I found that picture in the last pages, and then I thanked him for given me a very solid timestamp comparison between the dent and both NIST times and LDEO times.
I have it somewhere on my HD's, but I also posted a link to that picture in one of the 2 threads I hinted at before. I will look it up and post it, asap.
The ruler :
You must clamp it in a vertical position (to the side of the table) and not in a horizontal one.
It must resemble a steel skyscraper embedded in bedrock for at least 5 % of its total height.
And I tried to explain the tuning-fork vibrations effect of two 110 stories and one 44 stories high buildings on their underlaying bedrock, when hit by explosions at their bases, and the same effect when hit by 2 planes at or near the top.
Seemed not to have been clear enough, my bad.
www.abovetopsecret.com...
If you compare these 2 new (0-10 nm/s) enlarged and more sensitive ones to the same sensitive WTC 7 graph, to your surprise, you will find the same huge spikes suddenly pre-run the actual visual collapse points, same as in the WTC 7 graph.
Interesting, how some people really used every trick in the book to give the average Joe the impression that all was well with these seismic graphs.
What's much more interesting, is the fact that these 2 WTC 1 and 2 pre-collapse, suddenly appearing, huge spikes, are of the same magnitude and amplitude as the huge precollapse spikes in the WTC 7 seismic graph.
That means that the originating event was for all 3 collapses the SAME kind of event.
However, if we saw here the effect of bearing columns snap, we should expect that the resulting vibrational force on the bedrock would be MUCH bigger for the 110 stories high collumns of WTC 1 and 2 snapping, than for the 44 stories high collumns in the WTC 7 building snapping.
Perhaps as big as 3 times more.
However, the effects on the bedrock are nearly identical.......
Tell me, how to explain that observation.
I would be extremely surprised when NIST would come up with a rehash of that timestamp in exactly that penthouse dent picture.....
Originally posted by Slap Nuts
Originally posted by LeftBehind
And since there is no credible evidence, nor is there a "smoking gun" so to speak, none of the demolition theories would stand up in court.
Theres more than two of us mate.
cheers
[edit on 20-10-2006 by LeftBehind]
My full deconstruction of this steaming pile of NIST dool is forthcoming.
I love how the gov't story lovers always make it OK that the gov't has presented us with crap research, crap hypothesis and crap data.
There will be no "smoking gun". The same precious groups story that you all cling to are the same people that destroyed the evidence, seald the area and obstructed investigations.
All that leaves for us is to show how very silly, unscientific, flawed and occasionally TOTALLY BASELESS the goverments "reports" are".
If what they spew satisfies you, than good... It does not satisify many, many collegians, engineers, physicists, theologians or ordinary blokes. Why? Big post to follow with answer. I need some eggs and toast first.
[edit on 21-10-2006 by Slap Nuts]
Check your six, men, check your six.
We got bombs in the basements, repeat...bombs in the basements before the planes hit.
This is a smoking gun...repeat, a smoking gun.
The following data has not been refuted by anyone yet.
Many proponents of the "official conspiracy theory" reject these times out-of-hand stating these facts are false, but unfounded opinions with no factual basis are meaningless.
These times are true and corroborate William Rodriguez and all the other eyewitnesses that morning who testified to explosions in the sub-basements of WTC1 BEFORE THE PLANE HIT THE BUILDING.
The data herein is from two official government sources that were charged with looking into what happened on 9/11, and both approved these times as real, accurate, and precise to the second.
I found these times on the internet this last July 24th by accident.
Craig T. Furlong
---------------------------------------------------------------------------------
Summary:
Plane Impact Times – Indicting New Evidence of 9/11 Coverup & Involvement
“Seismic Proof – 9/11 Was An Inside Job (Updated Version II)”
Link: worldtradecentertruth.com...
By Craig T. Furlong & Gordon Ross
Scholars for 9/11 Truth: www.st911.org... /
One World Trade, September 11th, 2001
American Airlines Flight 11
8:46:40 UTC - FAA last primary radar contact
8:46:30 UTC - LDEO/NIST
Both times: real, accurate to the second
Q- What caused the 8:46:30 seismic event ~10 seconds before the aircrash?
A- The only possibility...huge explosion(s).
Q- Who caused these explosions?
Notes:
Ginny Carr audiotape ~9.2 second gap between initial explosion and aircrash.
The 9/11 Commission avoided the time of the initial seismic event.
The 9/11 Commission avoided the many witnesses who testified of explosions in the basements before the plane crashed, and NIST avoided the witnesses as well.
NIST avoided the 9/11 Commission’s time of the aircrash.
Demand a new 9/11 investigation now, THIS TIME ONE WITH TEETH.
Justice waits.
[There is no Statute of Limitation on murder.]
And although we are looking at WTC7 here, all these events are intertwined in the nexus of coverup & complicity. You uncover one, they all come undone.
This is why we need a REAL INVESTIGATION NOW! Waiting for the Government for a report that should have been done years ago is not only counter-productive but is also ridiculous.
We are out of time.
Last week it was the death of habeas corpus and (I just found out today) the opening of the door for martial law in this country (i.e., the death of posse comitatus):
signs-of-the-times.org...
We are at the precipice as a free Republic.
Hi, LabTop,
I am so glad to see your expertise and attack in this area of seismic data concerning WTC7. When I was in the thick of it concerning the seismic data and the planes hitting the buildings, I noticed the glaring facts that veritably shouted "explosions" pertaining to WTC7. FYI, here is a brief excerpt I wrote and sent to a forum about this back on Sept. 5th. Maybe it can help you.:
--------------------------------------------------------------------------------------------------
I thought you might like to see this. It’s about the controlled demolition of the Murrah Bldg after the OK bombing back in 1995, and how it relates to WTC7.
Scientists back then concluded, from the data of the controlled demolition of the remaining 75% of the building, that explosions are much more efficient at exciting ground motion than building collapses. Here is the paragraph and link: www.thenewamerican.com...
-------
"Now I think that there is no longer a question that there was energy activity at the Murrah Building in addition to the original explosion, and we simply need to determine the source of that activity," Brown told THE NEW AMERICAN. The leading contenders for the source of that energy are either another explosion inside the building or the falling of the building debris. But the demolition seismic data from the Murrah site make the latter explanation no longer tenable, says Brown. The demolition charges were detonated in five groups, he notes, and the oscillations on the seismogram from the site correspond closely with those explosions. "Even the smallest of those detonations had a larger effect on the recording than the collapse of the building, which demonstrates that the explosives are much more efficient at exciting the ground motion than is the collapse of three-fourths of the building. So it is very unlikely that one-fourth of the building falling on April 19th could have created an energy wave similar to that caused by the large [truck bomb] explosion." The most logical explanation for the second event, says Dr. Brown, is "a bomb on the inside of the building."
-------
The implications of this are interesting when you consider WTC7. With the additional 9 seconds added [per NIST sponsored contract with Kim in 2005] to the original seismic time of 5:20:33, which brings it to 5:20:42, you then add the 18 seconds of seismic activity, which brings the seismic end-time to 5:21:00.
www.ldeo.columbia.edu...
However, the FEMA timeline states the actual visible collapse didn’t begin until 3 seconds after that at 5:21:03.
FEMA Timeline, WTC7, pg 5-23
So, when you consider the 1995 results of the above seismic analysis from the OK CD...
[i.e., "Even the smallest of those detonations had a larger effect on the recording than the collapse of the building, which demonstrates that the explosives are much more efficient at exciting the ground motion than is the collapse of three-fourths of the building"]...
it indicates the possibility that the 18 seconds of seismic activity, which happened before the actual visible collapse of WTC7, was due to hidden, inside explosions for a controlled demolition of the building, and when the building finally fell visibly to all the world, this event was not even strong enough to register seismically.
And on top of that, if it walks like a duck, and it quacks like a duck,...
--------------------------------------------------------------------------------------------------
But I am glad we've got the first string working on this--that would be you!
Thanks for your hard work and analysis--please continue with it!
Howards post :
www.abovetopsecret.com...
And his link to NIST 5 april report on WTC 7 :
Then my post: www.abovetopsecret.com...
I now found also a timestamped picture from the same photographer, Nicolas Cianca , at page 23 from 42. Time is also 5:20:46 p.pm.
On page 24 you can see clearly that the dent in that picture is exactly the same as in the pictures on page 23 and 42.
On page 42 from 42 the text says :
""First exterior sign of structural failure in WTC 7, the start of the sinking of the east penthouse roof structure into the building.""
www.abovetopsecret.com...
And his link to NIST 5 april report on WTC 7 :
Check out the NIST time sequence of the collapse. on page 26. the collapse started 8 seconds before the global collapse that everyone likes to look at.
Then my post: www.abovetopsecret.com...
HowardRoark,
thank you for that link. That was the info I needed, so I could compare videos, NIST table and LDEO graphs.
Have a look at the righthand picture on the last page 42 of your NIST report WTC-7 link, which depicts the first exterior sign of structural failure in WTC 7, the start of the sinking of the east penthouse roof structure into the building.
You clearly see the kink in the east penthouse roof.
The timestamp indicates it occured at 5:20:46 p.m. An even better picture is on page 24, but without timestamp.
Then have another look at the LDEO graph from the seismic event of the WTC-7 collaps in my post above.
Their graph start time is 21:20:40, which is local New York city time 5:20:40 p.m.
And exactly 6 seconds later, 5:20:46 p.m. you observe the first major anomalous seismic peak.
So now we have a definite common for the LDEO WTC-7 seismic event graph and the NIST Part IIC-WTC 7 Collaps Draft report.
Now, we can compare scientificly observed data on page 26 of the NIST report with the scientific seismic data of the LDEO graph
I now found also a timestamped picture from the same photographer, Nicolas Cianca , at page 23 from 42. Time is also 5:20:46 p.pm.
On page 24 you can see clearly that the dent in that picture is exactly the same as in the pictures on page 23 and 42.
On page 42 from 42 the text says :
""First exterior sign of structural failure in WTC 7, the start of the sinking of the east penthouse roof structure into the building.""
have read it all, and I also have studied the Oklahoma city bombings extensively.
There were definitely FIVE bombs exploded and not 1 (or 2).
A secret pentagon study group came to that conclusion.
See my posts in the two threads of mine.
1. www.abovetopsecret.com...
2. www.abovetopsecret.com...
I now need some sleep, will come back to the 10 seconds discrepancy between the radar data and LDEO seismic data as soon as I wake up again.
Thanks for pointing out my mistake with the time there. Here's an updated one:

I don't know much about photographic equipment, but I would assume that timestamps can be off (my computer clock gains a minute a week), especially if they are set manually by the user. A mere 4 - 6 second innaccuracy in the time set by that camera will render moot your entire argument for seismic activity before collapse, so if I were you I would seek a way to confirm the accuracy somehow, or preferably, look for a second source for that 46s time. You may be able to obtain such confirmation from CBS who has uninterrupted footage of the collapse. If you can do that, you'll have a concrete case.
The problem is not with your explanation - I understood it quite well - I just don't agree with it. Whether the ruler is horizontal or vertical, embedded or attached, or if it's a tuning fork effect or not, the principle is the same. Perhaps it was I who did not explain well enough, so I'll try again. The seismic activity recorded from these events is simply energy propagated through the structure and transformed into ground motion. The stronger the object affected is coupled to the ground, and the less flex in that object, the more energy is transferred to the ground and hence into ground motion, i.e. seismic activity. When the planes struck the towers high up, much of the kinetic energy would be used to do work bending the structure and thus be absorbed by it, therefore less energy is transferred to the ground. (And the buildings did sway a lot when struck, as is documented). It's the same principle which makes air bags and crumple zones work for crash safety. If the planes had struck the buildings low down near to the ground where there is less flex and therefore less work done in bending the structure, then more energy would be transferred into peak seismic motion. The same applies for explosions on the base columns.
Here's another practical experiment akin to yours. Plant a small, 50cm high sapling in a pot of earth. Stand a toy soldier next to the base. Now strike the top of the sapling with a hammer and watch the toy soldier. He will barely move if at all, but the sapling will bend a lot. Now strike the sapling just above where it enters the earth. The sapling will not bend and the energy of the blow will instead be transferred efficiently into moving the earth in the pot. A miniature earthquake! The toy soldier will fall over. The high strike will produce longer duration "seismic activity" in the pot as the sapling sways, but lower peak seismic energy. This practical and common sense observation is why I asked if you have any scientific, observational, or experimental support for your contention.
So my point is that comparing the energy of the plane impacts to the energy of explosions on the base columns of WTC7 is moot, because only a certain portion of the energy of the plane impacts would be transferred into ground motion, hence the seismic signals are not representative of the energy of the impacts. What clinches it for me is that the WTC7 pre-collapse signal was larger in peak energy than the collapse of the entire building, so it simply cannot be explained away by a partial collapse inside the building as HowardRoark has attempted before, and this is true whether the event occurred before the penthouse or was concurrent with it. Regardless of the timing, that large peak is a smoking gun.
[edit on 2006-10-30 by wecomeinpeace]
The NIST timestamp of 17:20:46 was printed inside the picture made by some italian named photographer, who made that picture of the dent, NIST used it on one of its last pages of the draft report about WTC 7.
I don't know much about photographic equipment, but I would assume that timestamps can be off (my computer clock gains a minute a week), especially if they are set manually by the user. A mere 4 - 6 second innaccuracy in the time set by that camera will render moot your entire argument for seismic activity before collapse, so if I were you I would seek a way to confirm the accuracy somehow, or preferably, look for a second source for that 46s time. You may be able to obtain such confirmation from CBS who has uninterrupted footage of the collapse. If you can do that, you'll have a concrete case.
The ruler :
You must clamp it in a vertical position (to the side of the table) and not in a horizontal one.
It must resemble a steel skyscraper embedded in bedrock for at least 5 % of its total height.
And I tried to explain the tuning-fork vibrations effect of two 110 stories and one 44 stories high buildings on their underlaying bedrock, when hit by explosions at their bases, and the same effect when hit by 2 planes at or near the top.
Seemed not to have been clear enough, my bad.
The problem is not with your explanation - I understood it quite well - I just don't agree with it. Whether the ruler is horizontal or vertical, embedded or attached, or if it's a tuning fork effect or not, the principle is the same. Perhaps it was I who did not explain well enough, so I'll try again. The seismic activity recorded from these events is simply energy propagated through the structure and transformed into ground motion. The stronger the object affected is coupled to the ground, and the less flex in that object, the more energy is transferred to the ground and hence into ground motion, i.e. seismic activity. When the planes struck the towers high up, much of the kinetic energy would be used to do work bending the structure and thus be absorbed by it, therefore less energy is transferred to the ground. (And the buildings did sway a lot when struck, as is documented). It's the same principle which makes air bags and crumple zones work for crash safety. If the planes had struck the buildings low down near to the ground where there is less flex and therefore less work done in bending the structure, then more energy would be transferred into peak seismic motion. The same applies for explosions on the base columns.
Here's another practical experiment akin to yours. Plant a small, 50cm high sapling in a pot of earth. Stand a toy soldier next to the base. Now strike the top of the sapling with a hammer and watch the toy soldier. He will barely move if at all, but the sapling will bend a lot. Now strike the sapling just above where it enters the earth. The sapling will not bend and the energy of the blow will instead be transferred efficiently into moving the earth in the pot. A miniature earthquake! The toy soldier will fall over. The high strike will produce longer duration "seismic activity" in the pot as the sapling sways, but lower peak seismic energy. This practical and common sense observation is why I asked if you have any scientific, observational, or experimental support for your contention.
So my point is that comparing the energy of the plane impacts to the energy of explosions on the base columns of WTC7 is moot, because only a certain portion of the energy of the plane impacts would be transferred into ground motion, hence the seismic signals are not representative of the energy of the impacts. What clinches it for me is that the WTC7 pre-collapse signal was larger in peak energy than the collapse of the entire building, so it simply cannot be explained away by a partial collapse inside the building as HowardRoark has attempted before, and this is true whether the event occurred before the penthouse or was concurrent with it. Regardless of the timing, that large peak is a smoking gun.
[edit on 2006-10-30 by wecomeinpeace]
ofcourse you are right, I was too hastely trying to depict to the reader how the effects of planes and explosives would work out on such huge
buildings. And speed of the hitting object must also be included, if over a certain speed, the object will go through the whole building like it was
butter, and then far less impact energy would have been transfered to the building. Imagine a black belt karateka slicing with his hand through a
plank.
That's why you see less seismic energy in the half miss plane impact. Also less core collumns were hit in that case.
And, wecomeinpeace, I gave the links to the Nist WTC 7 draft report where you can find those photo's on 2 different pages, and another one without the time printed in it, from the famous CBS video, which had atomic clock times attached to the tape when shot, already in above "Found it" post.
Surely that big characters time imprint was done by NIST, this is not the normal small and blueish automatical camera imprint.
I suppose NIST just did a somewhat finer timing analysis of the CBS video, and thus came to the 20:46 conclusion for the dent, instead of the 21:03 conclusion from the earlier FEMA report !
Now to even more important finds from the past FEMA report :
www.whatreallyhappened.com...
911research.wtc7.net...
This is a quote from Chapter 5 of the FEMA report :
If you would overwrite these outrageous figures into Wcip's graph, we would find a shift of his 2 red texts exactly another 17 seconds to the RIGHT, placing the arrival of the FEMA dent signals at the 40s LDEO position.
THAT'S the END of the GRAPH damnit !
It's getting more and more interesting, to see how a bunch of incompetent "scientists" have done their utterly best to fit the proof to the facts. Or was it the opposite?
In FEMA's view, the whole WTC 7 PAL EHE LDEO seismic chart shows a lot of huge seismic activity, before the dent signal arrives at Pallisades, and is recorded according to FEMA at the very right end (40s) of their chart. (5:21:03 + 17 seconds through bedrock = 5:21:20).
Can it get any crazier?
PS :
www.thetech.org...
www.thetech.org...
PS2 :
911digitalarchive.org...
""I passed by the base entrance of 7WTC on 9-11, which is a barricaded truck entrance, I noticed the dozen policemen that had recently started to guard this entrance. In the last two weeks, the guard entrance grew from three men to 12-15 armed men.
Serious looking men. The following Thursday, for the first time, I saw a K-9 unit with a German Shepherd walking through the inside of a moving truck. Over the last three years, I have walked past this spot over 1200 times and I have never seen this.""
[edit on 30/10/06 by LaBTop]
That's why you see less seismic energy in the half miss plane impact. Also less core collumns were hit in that case.
And, wecomeinpeace, I gave the links to the Nist WTC 7 draft report where you can find those photo's on 2 different pages, and another one without the time printed in it, from the famous CBS video, which had atomic clock times attached to the tape when shot, already in above "Found it" post.
Surely that big characters time imprint was done by NIST, this is not the normal small and blueish automatical camera imprint.
I suppose NIST just did a somewhat finer timing analysis of the CBS video, and thus came to the 20:46 conclusion for the dent, instead of the 21:03 conclusion from the earlier FEMA report !
Now to even more important finds from the past FEMA report :
www.whatreallyhappened.com...
911research.wtc7.net...
This is a quote from Chapter 5 of the FEMA report :
5.5.4 Sequence of WTC 7 Collapse
Approximately 7 hours after fires initiated in WTC 7, the building collapsed. The start of a timed collapse sequence was based on 17:20:33, the time registered by seismic recordings described in Table 1.1 (in Chapter 1). The time difference between each of the figures was approximated from time given on the videotape. Figures 5-20 to 5-25 illustrate the observed sequence of events related to the collapse.
~5:20:33 p.m. WTC 7 begins to collapse. Note the two mechanical penthouses at the roof on the east and west sides in Figure 5-20.
~5:21:03 p.m. Approximately 30 seconds later, Figure 5-21 shows the east mechanical penthouse disappearing into the building. It takes a few seconds for the east penthouse to "disappear" completely.
~5:21:08 p.m. Approximately 5 seconds later, the west mechanical penthouse disappears (Figure 5-22) or sinks into WTC 7.
~5:21:09 p.m. Approximately 1 or 2 seconds after the west penthouse sinks into WTC 7, the whole building starts to collapse. A north-south "kink" or fault line develops along the eastern side as the building begins to come down at what appears to be the location of the collapse initiation (see Figures 5-23 and 5-24).
~5:21:10 p.m. WTC 7 collapses completely after burning for approximately 7 hours (Figure 5-25). The collapse appeared to initiate at the lower floors, allowing the upper portion of the structure to fall.
If you would overwrite these outrageous figures into Wcip's graph, we would find a shift of his 2 red texts exactly another 17 seconds to the RIGHT, placing the arrival of the FEMA dent signals at the 40s LDEO position.
THAT'S the END of the GRAPH damnit !
It's getting more and more interesting, to see how a bunch of incompetent "scientists" have done their utterly best to fit the proof to the facts. Or was it the opposite?
In FEMA's view, the whole WTC 7 PAL EHE LDEO seismic chart shows a lot of huge seismic activity, before the dent signal arrives at Pallisades, and is recorded according to FEMA at the very right end (40s) of their chart. (5:21:03 + 17 seconds through bedrock = 5:21:20).
Can it get any crazier?
PS :
www.thetech.org...
The Richter magnitude is related to the maximum amplitude of the S wave measured from the seismogram. Because there is a great range in the sizes of different earthquakes, the Richter scale uses logarithms. Thus, a magnitude 7 (M 7) earthquake is 10 times as large as a magnitude 6 earthquake, and releases over 30 times more energy.
www.thetech.org...
Today's high-technology, digital seismographs record ground shaking over a large band of frequencies and seismic amplitudes. Today's seismometers are called broadband because they are able to sense ground motion over a wide range of frequencies, from thousands of seconds to less than a hundredth of a second.
The amplitude of the signals recorded by old seismometers was limited by the amount of movement possible between the mass, or pendulum, and the seismometer housing. Today's seismometers operate by measuring the amount of electrical energy needed to keep the mass centered in the housing in the presence of strong ground shaking. Modern seismometers can record a wide range of seismic signals, both very small and very large.
PS2 :
911digitalarchive.org...
""I passed by the base entrance of 7WTC on 9-11, which is a barricaded truck entrance, I noticed the dozen policemen that had recently started to guard this entrance. In the last two weeks, the guard entrance grew from three men to 12-15 armed men.
Serious looking men. The following Thursday, for the first time, I saw a K-9 unit with a German Shepherd walking through the inside of a moving truck. Over the last three years, I have walked past this spot over 1200 times and I have never seen this.""
[edit on 30/10/06 by LaBTop]
I've got both NIST reports and the CBS captures don't have time stamps on them in my copies. Only the Nicolas Cianca photo has time printed on it
(there are two identical copies in the report, p23 and p42). If your copy has time stamps on the CBS captures as well, then that will be very
interesting. Can you post those?
You still need to confirm how they got that time. If they got it from Cianca's camera, then it's not a solid piece of evidence. If they got it from CBS, then it is. You might want to email CBS and see what you can get from them. I'm just playing devil's advocate here, and this one last piece of the pie will make it 100% irrefutable.
You still need to confirm how they got that time. If they got it from Cianca's camera, then it's not a solid piece of evidence. If they got it from CBS, then it is. You might want to email CBS and see what you can get from them. I'm just playing devil's advocate here, and this one last piece of the pie will make it 100% irrefutable.
new topics
-
God's Righteousness is Greater than Our Wrath
Religion, Faith, And Theology: 51 minutes ago -
Electrical tricks for saving money
Education and Media: 3 hours ago -
VP's Secret Service agent brawls with other agents at Andrews
Mainstream News: 5 hours ago -
Sunak spinning the sickness figures
Other Current Events: 5 hours ago -
Nearly 70% Of Americans Want Talks To End War In Ukraine
Political Issues: 6 hours ago -
Late Night with the Devil - a really good unusual modern horror film.
Movies: 7 hours ago -
Cats Used as Live Bait to Train Ferocious Pitbulls in Illegal NYC Dogfighting
Social Issues and Civil Unrest: 9 hours ago -
The Good News According to Jesus - Episode 1
Religion, Faith, And Theology: 11 hours ago
top topics
-
Florida man's trip overseas ends in shock over $143,000 T-Mobile phone bill
Social Issues and Civil Unrest: 16 hours ago, 8 flags -
Cats Used as Live Bait to Train Ferocious Pitbulls in Illegal NYC Dogfighting
Social Issues and Civil Unrest: 9 hours ago, 8 flags -
VP's Secret Service agent brawls with other agents at Andrews
Mainstream News: 5 hours ago, 8 flags -
Bobiverse
Fantasy & Science Fiction: 16 hours ago, 3 flags -
HORRIBLE !! Russian Soldier Drinking Own Urine To Survive In Battle
World War Three: 13 hours ago, 3 flags -
Electrical tricks for saving money
Education and Media: 3 hours ago, 3 flags -
Nearly 70% Of Americans Want Talks To End War In Ukraine
Political Issues: 6 hours ago, 3 flags -
Sunak spinning the sickness figures
Other Current Events: 5 hours ago, 3 flags -
Late Night with the Devil - a really good unusual modern horror film.
Movies: 7 hours ago, 2 flags -
The Good News According to Jesus - Episode 1
Religion, Faith, And Theology: 11 hours ago, 1 flags
active topics
-
VP's Secret Service agent brawls with other agents at Andrews
Mainstream News • 34 • : WeMustCare -
New whistleblower Jason Sands speaks on Twitter Spaces last night.
Aliens and UFOs • 53 • : pianopraze -
Sunak spinning the sickness figures
Other Current Events • 5 • : glen200376 -
SETI chief says US has no evidence for alien technology. 'And we never have'
Aliens and UFOs • 44 • : MikeDeGrasseTyson -
HORRIBLE !! Russian Soldier Drinking Own Urine To Survive In Battle
World War Three • 31 • : budzprime69 -
How ageing is" immune deficiency"
Medical Issues & Conspiracies • 33 • : rickymouse -
The Reality of the Laser
Military Projects • 46 • : Zaphod58 -
God's Righteousness is Greater than Our Wrath
Religion, Faith, And Theology • 0 • : randomuser2034 -
President BIDEN Vows to Make Americans Pay More Federal Taxes in 2025 - Political Suicide.
2024 Elections • 136 • : ImagoDei -
Electrical tricks for saving money
Education and Media • 3 • : Mike72