It looks like you're using an Ad Blocker.
Please white-list or disable AboveTopSecret.com in your ad-blocking tool.
Thank you.
Some features of ATS will be disabled while you continue to use an ad-blocker.
8
share:
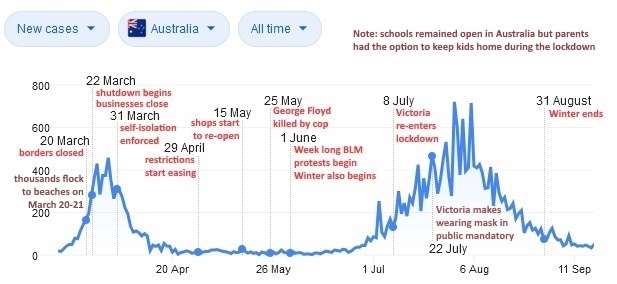
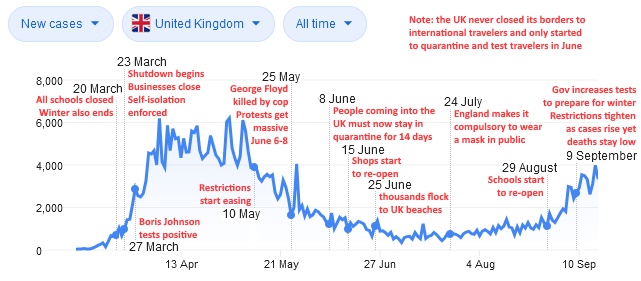
Thought it might be interesting to put together some charts where I mark major events in the Covid-19 timeline alongside case numbers so to see if
there are any correlations and because I thought some people in the U.S. might find it interesting to compare what actions other western nations took.
I was going to make one for the U.S. but after making these two I got tired of it, plus the US has a large number of states which all have their own
rules and restrictions, which makes it harder. However I would still be interested in seeing a timeline for some dense states like New York.


Personally I cannot see any obvious correlations, besides maybe winter in Australia helping the second wave get so big. The UK is rapidly ramping up testing and we can see the result of that in the increased cases without any rise in death numbers. The riots and packed beaches also occurred in the UK while the cases numbers were dropping. I'll be very interested to see how the UK fairs when winter hits considering they were already hit so hard. It will tell us if they have herd immunity and if the immunity is long lasting. My prediction is they'll have a minor wave but the death rate will remain very low.
Most of the dates I used were gathered from these sources:
en.wikipedia.org...
en.wikipedia.org...
en.wikipedia.org...
en.wikipedia.org...
www.abc.net.au...
www.abc.net.au...
edit on 19/9/2020 by
ChaoticOrder because: (no reason given)
a reply to: ChaoticOrder
that's a great idea really it's been on my mind since February 4th of having some kind of graph or chart to see in this part of the world anyway what is really taking place and the reason why I say that is because nobody was wearing mask on the train subways and shinkansen..
and then suddenly overnight which I mentioned in a post it started become trendy wear a mask wasn't mandatory it was just trendy like hey this is cool you know.
And then after the trend it became if you're not wearing a mask you better be wearing a mask but there's no law here in Japan in this country saying you have to wear a mask but you're definitely frowned upon if you go into a grocery store as a matter of fact the many grocery stores says no entry unless you're wearing a mask.
but unfortunately I don't have access to a computer to do what I want to do anymore I just have this phone so but I hope somebody chimes in and starts doing what you suggested it would be really fascinating.
a reply to: ChaoticOrder
I can tell you what the correlation is. Cases increase when you increase testing.
Way more people have already had COVID than any media source will acknowledge. The public health agencies aren't saying anything because, like all government agencies, this new power they have been enabled to use is intoxicating. It's the same thing I witnessed from the inside during H1N1, public health didn't want to admit that it was less severe than anticipated because the money poured in.
Though it contradicts the popular Chinese sabotage narrative I see evidence that this was circulating at least 4 or 5 months before the alleged origin date. This was going around, mostly without notice due to mostly killing the elderly and infirm, for many months before the cases exploded.
It's really easy to fool the public with numbers when they have no background in risk assessment. So it's being exploited in the months leading in to an election by disgusting people with no integrity.
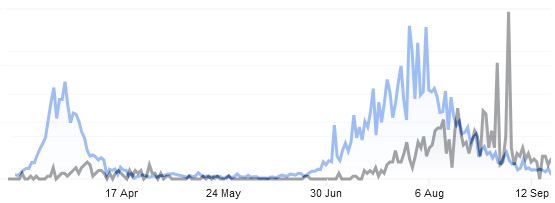
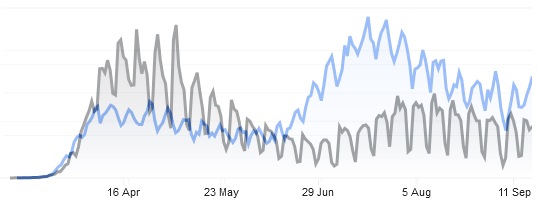
Here's the case numbers (blue) overlaid onto the death numbers:


edit on 20/9/2020 by ChaoticOrder because: (no reason given)
That last chart in my last post is the U.S. btw. Just search "covid cases" on Google and you should get the same charts.
edit on 20/9/2020 by
ChaoticOrder because: (no reason given)
originally posted by: ChaoticOrder
Personally I cannot see any obvious correlations, besides maybe winter in Australia helping the second wave get so big. The UK is rapidly ramping up testing and we can see the result of that in the increased cases without any rise in death numbers. The riots and packed beaches also occurred in the UK while the cases numbers were dropping. I'll be very interested to see how the UK fairs when winter hits considering they were already hit so hard. It will tell us if they have herd immunity and if the immunity is long lasting. My prediction is they'll have a minor wave but the death rate will remain very low.
UK here......
It is normal here for an increase in deaths in the winter due to flu (mostly the
elderly and with underlying problems) Even though they can and do get free
vacinations. I myself is in that catergory but I have never taken up my option to
have one.
ALL deaths I believe WILL BE PUT DOWN to the covid virus anyway and regardless
of truth.
edit on 20-9-2020 by eletheia because: (no reason given)
new topics
-
Weinstein's conviction overturned
Mainstream News: 1 hours ago -
Supreme Court Oral Arguments 4.25.2024 - Are PRESIDENTS IMMUNE From Later Being Prosecuted.
Above Politics: 2 hours ago -
Krystalnacht on today's most elite Universities?
Social Issues and Civil Unrest: 2 hours ago -
Chris Christie Wishes Death Upon Trump and Ramaswamy
Politicians & People: 3 hours ago -
University of Texas Instantly Shuts Down Anti Israel Protests
Education and Media: 5 hours ago -
Any one suspicious of fever promotions events, major investor Goldman Sachs card only.
The Gray Area: 7 hours ago
top topics
-
VP's Secret Service agent brawls with other agents at Andrews
Mainstream News: 16 hours ago, 11 flags -
Krystalnacht on today's most elite Universities?
Social Issues and Civil Unrest: 2 hours ago, 7 flags -
Nearly 70% Of Americans Want Talks To End War In Ukraine
Political Issues: 17 hours ago, 6 flags -
Supreme Court Oral Arguments 4.25.2024 - Are PRESIDENTS IMMUNE From Later Being Prosecuted.
Above Politics: 2 hours ago, 5 flags -
Weinstein's conviction overturned
Mainstream News: 1 hours ago, 5 flags -
Electrical tricks for saving money
Education and Media: 15 hours ago, 5 flags -
Sunak spinning the sickness figures
Other Current Events: 17 hours ago, 5 flags -
University of Texas Instantly Shuts Down Anti Israel Protests
Education and Media: 5 hours ago, 3 flags -
Any one suspicious of fever promotions events, major investor Goldman Sachs card only.
The Gray Area: 7 hours ago, 2 flags -
God's Righteousness is Greater than Our Wrath
Religion, Faith, And Theology: 12 hours ago, 1 flags
active topics
-
Weinstein's conviction overturned
Mainstream News • 12 • : CristianVictoria -
University of Texas Instantly Shuts Down Anti Israel Protests
Education and Media • 106 • : DBCowboy -
Nearly 70% Of Americans Want Talks To End War In Ukraine
Political Issues • 82 • : gortex -
Supreme Court Oral Arguments 4.25.2024 - Are PRESIDENTS IMMUNE From Later Being Prosecuted.
Above Politics • 39 • : xuenchen -
Chris Christie Wishes Death Upon Trump and Ramaswamy
Politicians & People • 13 • : mysterioustranger -
"We're All Hamas" Heard at Columbia University Protests
Social Issues and Civil Unrest • 283 • : FlyersFan -
Candidate TRUMP Now Has Crazy Judge JUAN MERCHAN After Him - The Stormy Daniels Hush-Money Case.
Political Conspiracies • 747 • : Justoneman -
Biden--My Uncle Was Eaten By Cannibals
US Political Madness • 73 • : CarlLaFong -
-@TH3WH17ERABB17- -Q- ---TIME TO SHOW THE WORLD--- -Part- --44--
Dissecting Disinformation • 671 • : daskakik -
VP's Secret Service agent brawls with other agents at Andrews
Mainstream News • 46 • : CarlLaFong
8
