It looks like you're using an Ad Blocker.
Please white-list or disable AboveTopSecret.com in your ad-blocking tool.
Thank you.
Some features of ATS will be disabled while you continue to use an ad-blocker.

What makes COVID-19 worse than Seasona Influenza in one pic
page: 4share:
originally posted by: Krakatoa
originally posted by: Krakatoa
Here's a great source of actual data, assessment,s and projections based upon the UK models that would also apply to the USA (only delayed by a few weeks).
16-MAR- 2020: Impact of non-pharmaceutical interventions (NPIs) to reduce COVID19 mortality and healthcare demand
Since some can't be bothered with actual reading or doing the research to answer their questions, Here are some highlights from the above source. If you want a more granular answer, I highly recommend to spend the time to actually read it for yourself.
Two fundamental strategies are possible: (a) mitigation, which focuses on slowing but not necessarily
stopping epidemic spread – reducing peak healthcare demand while protecting those most at risk of
severe disease from infection, and (b) suppression, which aims to reverse epidemic growth, reducing
case numbers to low levels and maintaining that situation indefinitely. Each policy has major
challenges. We find that that optimal mitigation policies (combining home isolation of suspect cases,
home quarantine of those living in the same household as suspect cases, and social distancing of the
elderly and others at most risk of severe disease) might reduce peak healthcare demand by 2/3 and
deaths by half. However, the resulting mitigated epidemic would still likely result in hundreds of
thousands of deaths and health systems (most notably intensive care units) being overwhelmed many
times over. For countries able to achieve it, this leaves suppression as the preferred policy option.
The major challenge of suppression is that this type of intensive intervention package –
or something equivalently effective at reducing transmission – will need to be maintained until a
vaccine becomes available (potentially 18 months or more) – given that we predict that transmission
will quickly rebound if interventions are relaxed.
Epidemic timings are approximate given the limitations of
surveillance data in both countries: The epidemic is predicted to be broader in the US than in GB and
to peak slightly later. This is due to the larger geographic scale of the US, resulting in more distinct
localised epidemics across states (Figure 1B) than seen across GB. The higher peak in mortality in GB is due to the smaller size of the country and its older population compared with the US. In total, in an
unmitigated epidemic, we would predict approximately 510,000 deaths in GB and 2.2 million in the
US, not accounting for the potential negative effects of health systems being overwhelmed on
mortality.
Our
projections show that to be able to reduce R to close to 1 or below, a combination of case isolation,
social distancing of the entire population and either household quarantine or school and university
closure are required (Figure 3, Table 4). Measures are assumed to be in place for a 5-month duration.
Not accounting for the potential adverse effect on ICU capacity due to absenteeism, school and
university closure is predicted to be more effective in achieving suppression household quarantine.
All four interventions combined are predicted to have the largest effect on transmission (Table 4).
Such an intensive policy is predicted to result in a reduction in critical care requirements from a peak
approximately 3 weeks after the interventions are introduced and a decline thereafter while the
intervention policies remain in place.
Real real bad
a reply to: Krakatoa
For the record, I actually started reading it. I suggested you do this because, as Phage said, most people won't. And if you think the information is that important and you want it to spread, this is exactly what you should do, so thank you for posting the snippets.
For the record, I actually started reading it. I suggested you do this because, as Phage said, most people won't. And if you think the information is that important and you want it to spread, this is exactly what you should do, so thank you for posting the snippets.
originally posted by: Krakatoa
Here's a great source of actual data, assessment,s and projections based upon the UK models that would also apply to the USA (only delayed by a few weeks).
16-MAR- 2020: Impact of non-pharmaceutical interventions (NPIs) to reduce COVID19 mortality and healthcare demand
Also found in this document:
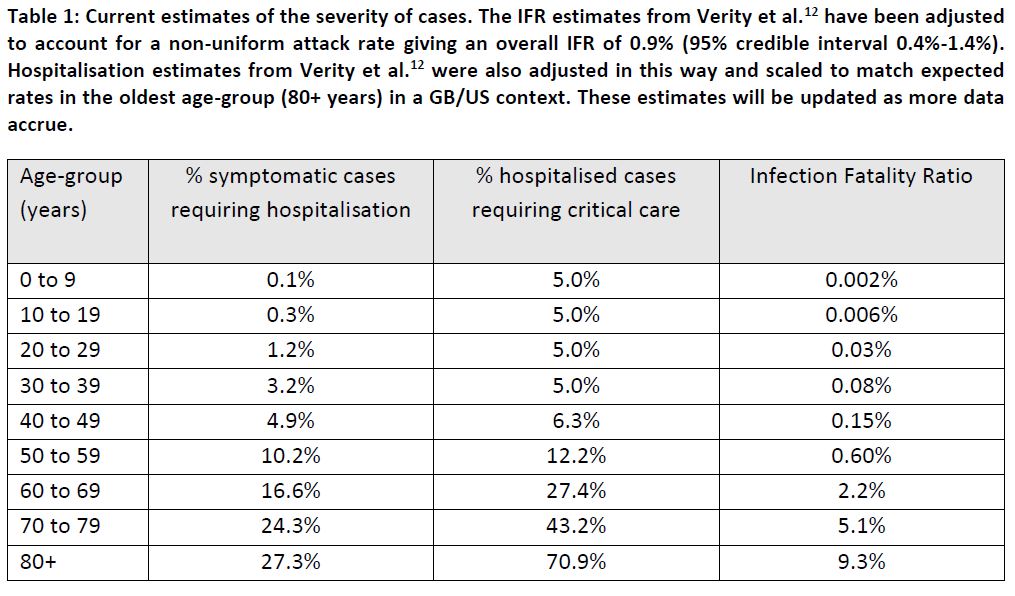
Overall Infection Fatality Rate of 0.9%?
Last estimate I saw was that it would come down to 1.4% eventually once unconfirmed cases were added. Keeps going down, which is definitely good news. Meanwhile, still haven't seen a good source on a worldwide death rate for flu?
edit on 18 3 20 by face23785 because: (no reason given)
I am starting to think the same people who wrote studies about the coming peak oil crisis also are authoring the studies about peak hospitalization
due Covid19
originally posted by: Edumakated
I am starting to think the same people who wrote studies about the coming peak oil crisis also are authoring the studies about peak hospitalization due Covid19
Don't forget about this gem:
Glacier National Park is replacing signs that predicted its glaciers would be gone by 2020 - CNN
a reply to: Edumakated
I think I might make a little picture later with random made up stats not backed up by any data and post it to portray the Coronavirus isn’t deadly at all since that seems to be the standard for the opposite side of the spectrum.
I think I might make a little picture later with random made up stats not backed up by any data and post it to portray the Coronavirus isn’t deadly at all since that seems to be the standard for the opposite side of the spectrum.
The other thing I've learned is that if you wrap good ole everyday bullsh*t up in fancy charts, graphs, big words, and hide by Ph. D's, almost anyone
will believe it.
This article does a great job of picking apart some of the "data" being bandied around right now.
Why Are People Who Should Know Better Buying the Hype?
Best Part of the Article:
Further
This article does a great job of picking apart some of the "data" being bandied around right now.
Why Are People Who Should Know Better Buying the Hype?
Best Part of the Article:
And scientists and science journals are not immune. There’s no shortage of people with PhDs willing to talk nonsense with a sciencey spin in order to convince the more inquiring proles that the governments are correct to invoke emergency powers and get that untested vaccine cranking out asap.
Look at this beauty. Written by a team of MDs and other ‘experts’ and appearing in The Lancet, it is about the most naked example I have seen to date of pseudoscience being used to inflate the perception of nCoV as something other than what it is.
The purpose of the article is apparently to find some sort of barely rational reason for estimating the nCoV case fatality rate to be higher than it actually is by a factor of ten.
Here’s the ‘reasoning’ it offers:
However, these mortality rate estimates are based on the number of deaths relative to the number of confirmed cases of infection, which is not representative of the actual death rate; patients who die on any given day were infected much earlier, and thus the denominator of the mortality rate should be the total number of patients infected at the same time as those who died.
They actually suggest with a straight face (though they don’t say why) that in order to get a ‘real’ figure for case fatality we need to count deaths as a percentage only of those who became infected at the same time as those who died.
So, if on Day One of a hypothetical new disease, two people get it and one dies, this would be a 50% case fatality ratio.
Sure, no problem. Common sense and statistics agree with that.
But what if from Day Two to Day Ten inclusive 198 more people get it and none of them die?
Well, according to the normal method of assessing CFR that would be 200 cases, one death, and a CFR of 0.5%
But with this brilliant new method, it would still be a CFR of 50% – because we are only allowed to count the cases who got sick on the same day as the fatality. And only two people got sick that day, of whom 50% died.
You see the corrupt genius of it? It’s a statistical nonsense that crucially gives permission to any would-be stats compilers in the WHO or elsewhere to overestimate the CFR of this bug, or indeed any other subsequent alleged ‘killer’ virus.
If you doubt this is the point, then read the article. This is just what the authors do, having the total gall to claim the ‘real’ CFR for nCoV is anywhere up to 20%, based solely on this crazy new way of figuring out the stats.
Further
And no, don’t tell me it’s “not a fair comparison” because the flu is ‘always’ here and nCoV is new. All you do by that is display your unthinking foolishness. Flu viruses are RNA viruses that mutate all the time – which is why you can catch ‘the flu’ over and over again; You’re catching a different strain, a ‘new’ variant. Just like nCoV it needs to travel by infection routes. And just like nCov it has to start small.
But unlike nCov it has already managed to kill around 100,000 people since Jan 1 this year. So let go of that particular piece of nonsense, ok?
originally posted by: Middleoftheroad
How did they determine the hospitalization rate? Seems they just pulled that number out of their a**.
Like I just posted in another thread. If we calculated the death rate of the flu the same way they calculate the death rate for the coronavirus, the flu would have a mortality rate of 7.7%.
Can we take a poll of how many of us know someone who has died from the flu?
a reply to: face23785
Here is CDC Flu View page. You will see Mortality, testing types, etc...
CDC Flu View
Here is CDC Flu View page. You will see Mortality, testing types, etc...
CDC Flu View
a reply to: FredT
I don't think the "just a flu, bro" folks understand this - hopefully the infographic helps.
By their logic, influenza is FAR less deadly than Ebola. They're having a hard time understanding percentages vs raw "numbers so far."
Hopefully, we'll keep the spread tamped down enough that they'll never come to realize that a 1-3% mortality rate is higher than a 0.1% mortality rate.
originally posted by: dogstar23
a reply to: FredT
I don't think the "just a flu, bro" folks understand this - hopefully the infographic helps.
By their logic, influenza is FAR less deadly than Ebola. They're having a hard time understanding percentages vs raw "numbers so far."
Hopefully, we'll keep the spread tamped down enough that they'll never come to realize that a 1-3% mortality rate is higher than a 0.1% mortality rate.
The issue is how you calculate the mortality rate. It seems you don't understand percentages and raw numbers....
Again, no one has demonstrated they have any solid data on how many people have contract covid. all they have is the number of tested, hospitalizations, and deaths.
Far more people could have contract covid and were never tested, never hospitalized, and certainly didn't die.
The mortality rate of the flu would be a lot higher if we only counted the people who actually go to the hospital for the flu, however, we know millions of people get the flu every year and just let it runs it's course.
Put another way, it is like saying the police caught 5000 drug dealers. 1000 went to jail. therefore, the police caught 20% of drug dealers!!!! Umm.... no, that is just the ones you caught. We all know there are far more dealing drugs, you just didn't catch them.
Interesting that Swine flu, according to the CDC, infected over a million US citizens in a month and a half time frame.
What's the current number for C19?
Seems like the best course of action for those unaffiliated is to do more of what you'd do during flu season.
What's the current number for C19?
Seems like the best course of action for those unaffiliated is to do more of what you'd do during flu season.
a reply to: Wardaddy454
It looks like President Trump does not want to be caught with his pants down like Obama Biden did.
They waited until 1000 Americans were dead before taking any action against the swine flu.
Because of their delay, 13,000 Americans ultimately died!
It looks like President Trump does not want to be caught with his pants down like Obama Biden did.
They waited until 1000 Americans were dead before taking any action against the swine flu.
Because of their delay, 13,000 Americans ultimately died!
a reply to: carewemust
So, is it a hoax or not?
www.abovetopsecret.com...
Cognitive dissonance much?
It looks like President Trump does not want to be caught with his pants down like Obama Biden did.
So, is it a hoax or not?
Keep putting out the below statistics far and wide until Americans start to wake up rebel against the mainstream media and elected officials who are clearly overreacting to what is reality.
www.abovetopsecret.com...
Cognitive dissonance much?
a reply to: carewemust
I don't blame him.
As it stands, he's damned if he does or damned if he doesn't.
Those thinking he's all about himself would do well to remember that should he be perceived as not doing enough, he loses 2020. Should he be perceived as doing too much (effectively shutting down the US way of life to prevent further outbreak, etc) he loses 2020.
originally posted by: Phage
a reply to: carewemust
It looks like President Trump does not want to be caught with his pants down like Obama Biden did.
So, is it a hoax or not?
He was referring to the media hysteria. I know your stance on it, that the media was not hysterically running the C19 story 24/7, nor were they trying to make C19 Trump's Katrina.
a reply to: Wardaddy454
Do you think elected officials are overreacting? They are following the Administration's guidelines and recommendations. Is the Administration overreacting?
and elected officials who are clearly overreacting to what is reality.
Do you think elected officials are overreacting? They are following the Administration's guidelines and recommendations. Is the Administration overreacting?
edit on 3/18/2020 by Phage because: (no reason given)
originally posted by: Identified
a reply to: face23785
Here is CDC Flu View page. You will see Mortality, testing types, etc...
CDC Flu View
That's national, I asked for worldwide.
Thanks anyway.
originally posted by: FredT
While at this point the total numbers make seasonal influenza more deadly that's not bearing per infection. This chart by the CDC and WHO really sums things up. The incubation period, the spread and need to hospitalize are simply way way greater and at some point the number of case will jump as we start ramping up testing. This is why we need to flatten the curve to allow the healthcare system to deal with it.
www.vox.com...
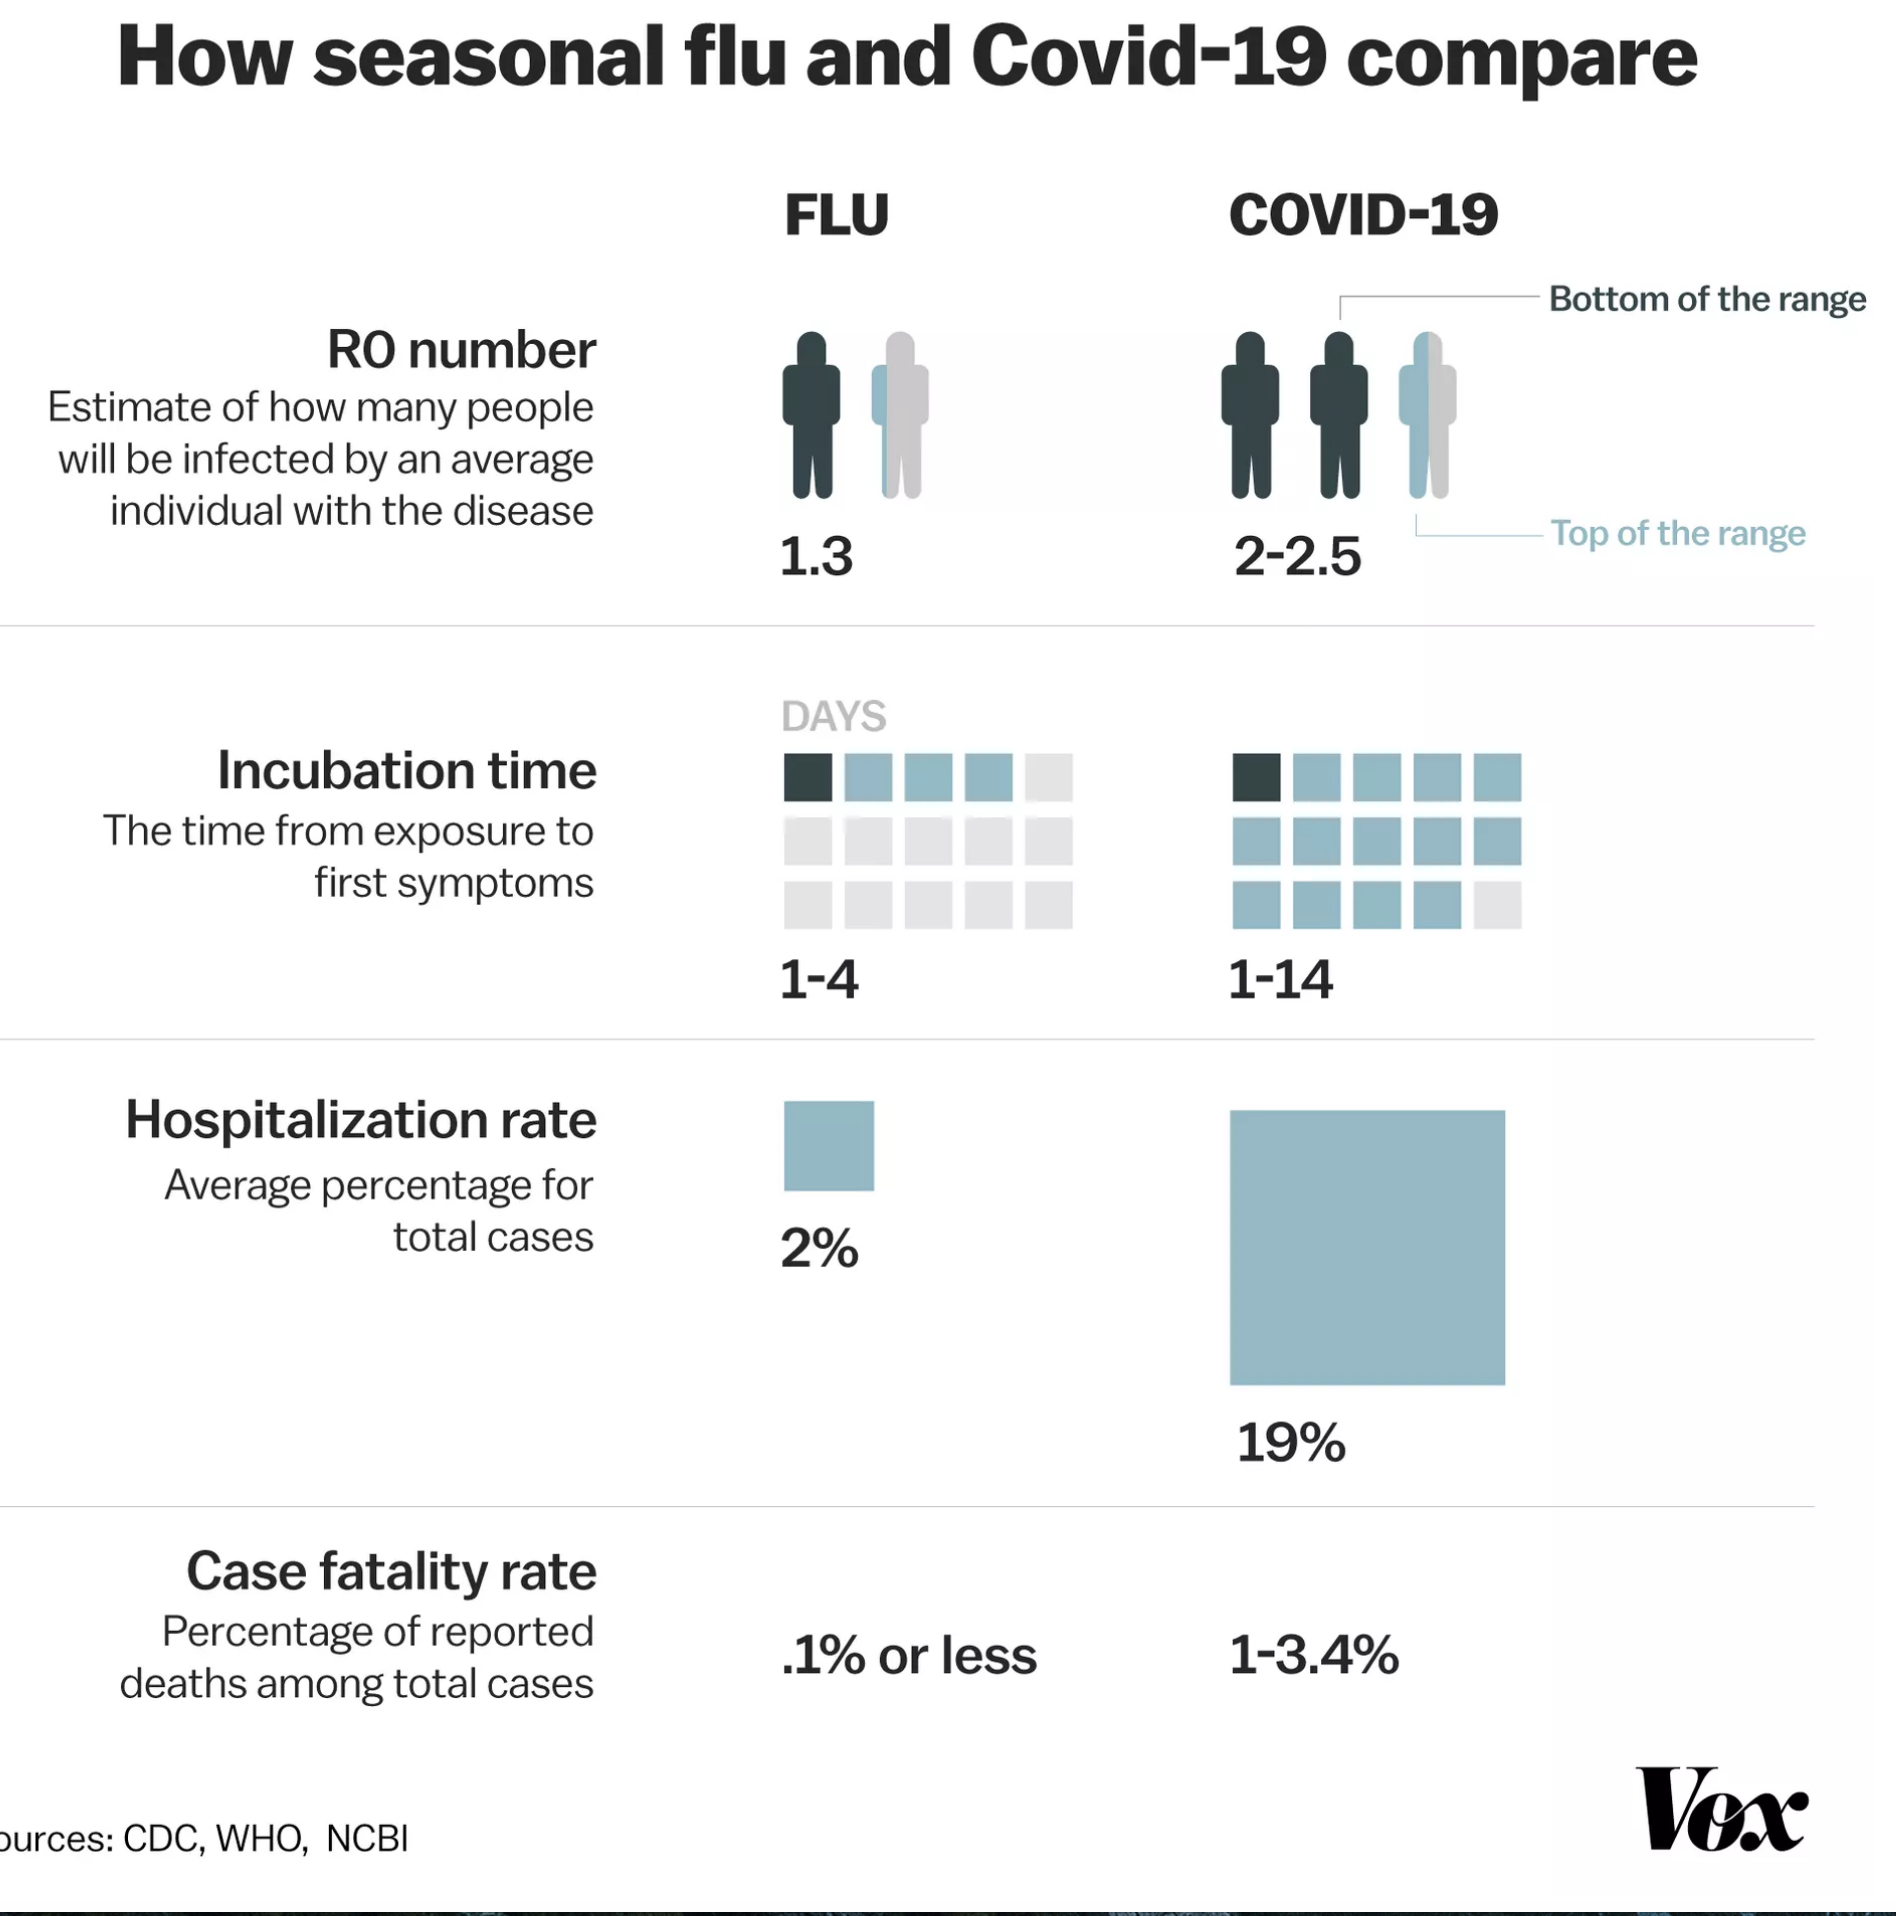
For the flu it is about 1 day before symptoms and up to 7 days after symptoms so COVID-19 has a longer period where people can pass it to another hence the larger RO number.
Hosp rate I disagree with since we do not have good numbers on total cases, and it is looking like 80% could have very light to none symptoms. Same with fatality since that is based on total cases.
Just another quick personal observation point. They are only testing one member per family so a whole family could have it but that would count as one if they even test one.
a reply to: face23785
You'll have to go the WHO for that and click around to find the data.
Pan-American
Europe
Western Pacific
You'll have to go the WHO for that and click around to find the data.
Pan-American
Europe
Western Pacific
new topics
-
USO 10 miles west of caladesi island, Clearwater beach Florida
Aliens and UFOs: 4 hours ago
top topics
-
Anti-Israel Protesters in CHICAGO Chant 'Death to Israel and 'Death to America'
Social Issues and Civil Unrest: 16 hours ago, 15 flags -
Denver to Defund the Police 8.4 Million To Pay for Illegal Aliens
Social Issues and Civil Unrest: 17 hours ago, 14 flags -
Running Through Idiot Protestors Who Block The Road
Rant: 14 hours ago, 12 flags -
Tesla cutting 14,000 jobs
Global Meltdown: 13 hours ago, 6 flags -
USO 10 miles west of caladesi island, Clearwater beach Florida
Aliens and UFOs: 4 hours ago, 6 flags -
Israel ufo shoot down drones?
Aliens and UFOs: 13 hours ago, 5 flags -
Abortions in first 12 weeks should be legalised in Germany, commission says
Medical Issues & Conspiracies: 12 hours ago, 5 flags -
On this Day in History, April 15, 1865, Abraham Lincoln Passed Away.
General Chit Chat: 13 hours ago, 4 flags -
Negotiations and Diplomacy.
History: 17 hours ago, 0 flags
active topics
-
Afterlife, unknown, so prepare, or just go into the unknown (bad)!!
ATS Skunk Works • 49 • : Kennyb75 -
Fossils in Greece Suggest Human Ancestors Evolved in Europe, Not Africa
Origins and Creationism • 46 • : matafuchs -
President BIDEN Warned IRAN Not to Attack ISRAEL - Iran Responded with a Military Attack on Israel.
World War Three • 37 • : nugget1 -
America's Infant Mortality Rate Increases for the First Time in 20 Years
Medical Issues & Conspiracies • 17 • : nugget1 -
Mandela Effect - It Happened to Me!
The Gray Area • 98 • : BeTheGoddess2 -
The Truth About Jesus
Conspiracies in Religions • 265 • : glend -
J Balvin Columbian Singer captured this Triangle UFO footage…….
Aliens and UFOs • 13 • : magicai -
Another whistleblower: Rear Admiral Tim Gallaudet
Aliens and UFOs • 27 • : Ophiuchus1 -
Terrifying Encounters With The Black Eyed Kids
Paranormal Studies • 36 • : Consvoli -
Abortions in first 12 weeks should be legalised in Germany, commission says
Medical Issues & Conspiracies • 9 • : Vermilion