It looks like you're using an Ad Blocker.
Please white-list or disable AboveTopSecret.com in your ad-blocking tool.
Thank you.
Some features of ATS will be disabled while you continue to use an ad-blocker.

22 Reasons to be Skeptical of Man-Made Global Warming
page: 118
share:
Here is an article listing 22 easy-to-follow
science-based reasons as to why we should be skeptical of man-made global warming. Below is 5 of those reasons.
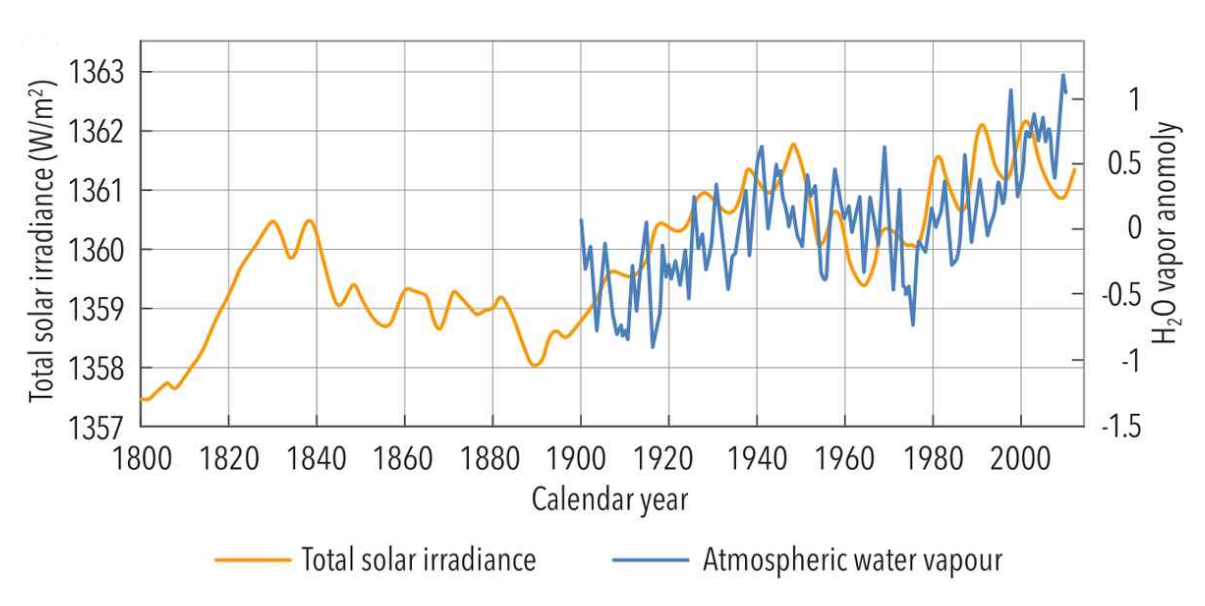
16) According to the IPCC, in AR5, the solar forcing since pre-industrial times has been small, amounting to only 0.05 W/m2. However, there are various reconstructions that show a large increase in TSI since pre-industrial times. Quote from Egorova et al 2018: “There is no consensus on the amplitude of the historical solar forcing. The estimated magnitude of the total solar irradiance difference between the Maunder Minimum and present time ranges from 0.1 W/m2 to 6 W/m2 making uncertain the simulation of the past and future climate”. Quote from Scafetta et al 2018: “The solar radiative forcing is quite uncertain because from 1700 to 2000 the proposed historical TSI reconstructions vary greatly from a minimum of 0.5 W/m2 to a maximum of about 6 W/m2”. One of the reconstructions below (from the book, Climate Change The Facts) shows an increase in TSI of about 4 W/m2 since 1800 which works out at a forcing of 0.7 W/m2 (since TSI is traditionally converted into solar forcing by dividing by 4 in order to take into account the spherical geometry of Earth and multiplying by an albedo of about 0.7). That is 14 times greater than what the IPCC attribute to solar forcing since pre-industrial times.
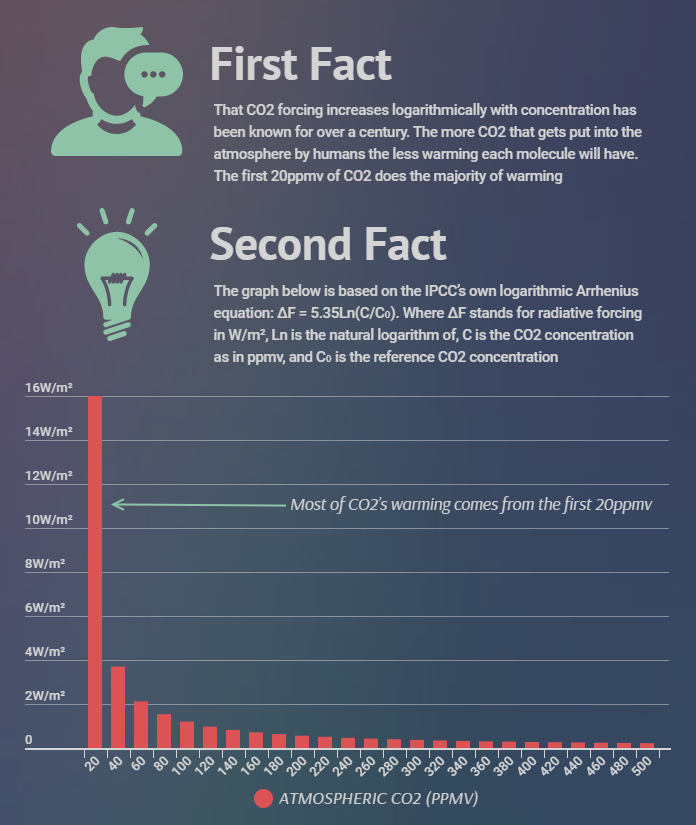
5) CO2 behaves somewhat logarithmically and the more of it there is in the atmosphere the less warming each molecule should have. The logarithmic effect of CO2 is apparently due to the availability of photons of the required frequency that are absorbed. The vast majority of the warming from CO2 comes from the first 20ppmv and after that CO2 has essentially no effect (here). The insignificance of CO2 as a climate driver is corroborated by the fact that Atmospheric Emitted Radiance Interferometer measurements imply the warming from CO2 is only 0.01 W/m2 per 1ppmv (see Feldman et al 2012). That gives a warming at the Earth’s surface of [2884+0.01/σ]0.25-288 = 0.0018°C.
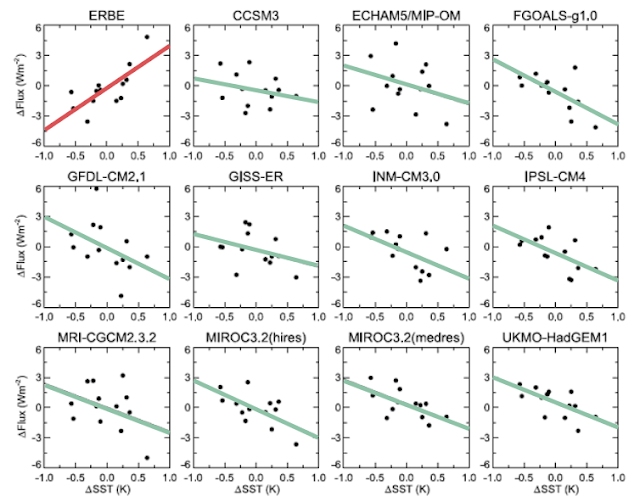
18) Compelling evidence the IPCC’s models misrepresent the Earth’s climate is shown in the graph below. The IPCC’s climate models predict that as atmospheric CO2 and other greenhouse gases increase then the outgoing long-wave radiation (OLR) will decrease as more radiation is trapped and re-radiated back towards the surface. The graph below (from Lindzen et al 2009) is a compelling refutation of the CAGW-hypothesis and shows that OLR has not increased as the models have predicted. This shows that the climate models trap heat too aggressively. The vertical axis in the graph below is OLR and the horizontal axis is sea-surface temperature. The red line is from the ERBE satellites and the green line are the IPCC’s model predictions. The ERBE satellite shows the opposite to what the models have predicted, that is, that more radiation is being re-radiated out to space as the temperature rises and is not being trapped as the models predict.
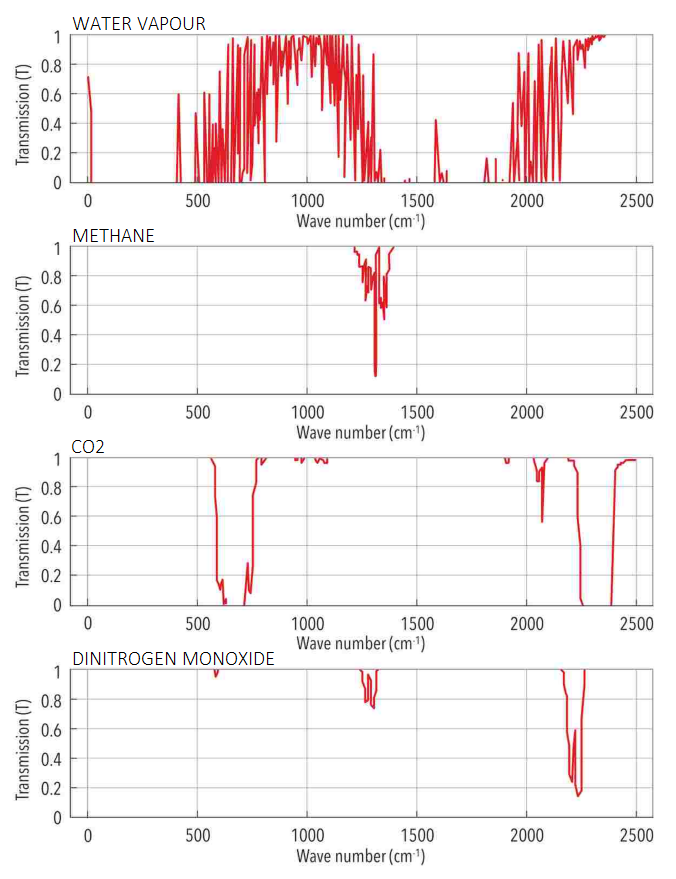
20) The threat from methane has been overblown. The graph here adapted from Barret (2005) show the absorption characteristics of the main atmospheric greenhouse gases. Water vapour is the top, methane is second, and CO2 is third. T0 means all radiation is absorbed and T1 means nothing is absorbed. Strong absorbance from methane occurs at wavenumbers around 1300 cm⁻¹. CO2 absorbs radiation strongly at around 670 cm⁻¹ and 2350 cm⁻¹, while water vapour absorbs strongly over much of the electromagnetic spectrum. We can see from the graph below that methane is rather weak at absorbing radiation when compared to water vapour. Methane exists as a tenuous trace gas, and comprises about 1.9ppmv of the atmosphere (as of 2018) whereas water vapour makes up about 10,000ppmv (NASA Earth Fact Sheet) making water vapour 5,000 times more abundant than methane while being more efficient at absorbing radiation. Methane is a trivial greenhouse gas and its effects are completely overwhelmed by water vapour. The current methane concentration of 1.9ppmv corresponds to around 5 gigatonnes (Gts); about 0.38ppmv per 1 Gt. Assuming the permafrost melted and it added an extra 5 Gts to the atmosphere by 2100 (IPCC AR5: Biogeochemical Cycles, page 530 to 531) then that would only increase the concentration of methane by 1.9ppmv, which is still 5,000 times less abundant than the concentration of water vapour. Methane only makes up 1 molecule in every 500,000 molecules spread evenly throughout the atmosphere.
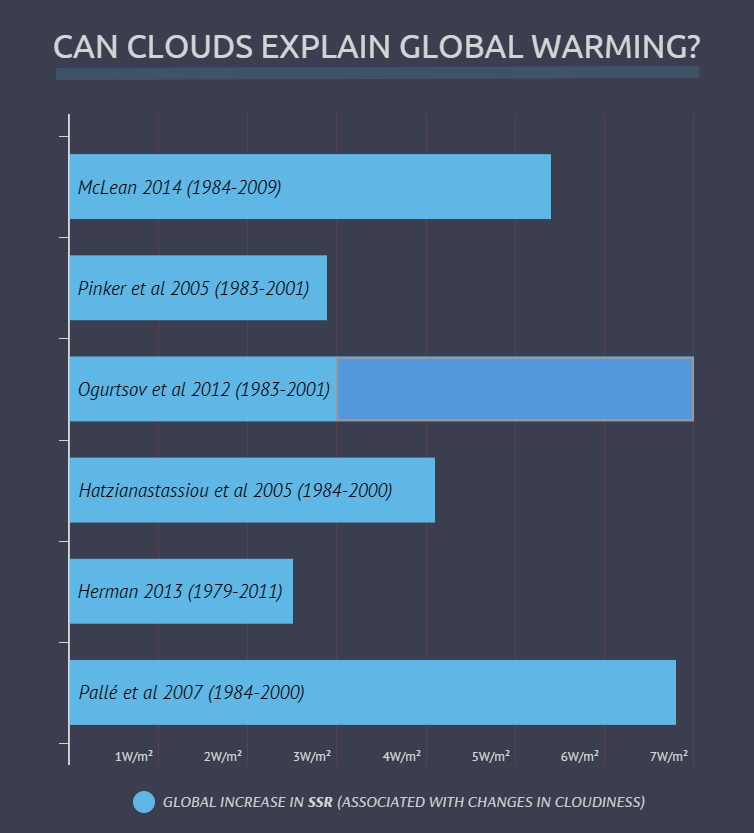
8) Global warming is explainable by clouds. According to Ogurtsov et al (2012) changes in global cloudiness have increased the shortwave solar radiation reaching the surface. The increase in this shortwave forcing amounts to 3 W/m2 to 7 W/m2 (here) between 1983 to 2001 or 0.17 W/m2 to 0.39 W/m2 per year. These figures need to be divided by 2.5 to take into account the cooling effect due to a general decrease in clouds because clouds simultaneously cool and warm the Earth. For every 5 W/m2 that clouds cool the Earth by they warm it by 3 W/m2 (IPCC AR5). Thus the net-warming from the increase in shortwave solar radiative forcing (from a general decrease in cloud-cover) becomes 0.07 W/m2 to 0.26 W/m2 per year which corresponds to a warming of about 0.013°C to 0.048°C per year which corresponds to 0.13°C to 0.48°C per decade. The global surface temperature is assumed to be increasing at the rate of 0.15°C to 0.20°C per decade. So, changes in clouds could explain the warming. There’s not much room left for CO2.
edit on 9-12-2019 by Nathan-D because: (no reason given)
I tried to post JUST THE LINK on facebook, but was told in a split second that it violated "community standards."
So...I posted it in bits - it took a while but I feel sooooo good about it.
So...I posted it in bits - it took a while but I feel sooooo good about it.
Well, I don't know if people are still able to think for themselves.
But if you believe reason 5 and stand by it, I'm sorry you've failed the IQ test
But if you believe reason 5 and stand by it, I'm sorry you've failed the IQ test
I tell people all the time. The earth flies through new space every day. Who knows what kind of anomalies are out there affecting our planet.
As a personal thought I had one day. While in rush hour. I see everyone is mostly one per vehicle. I can see us having some what of an effect but nothing world ending. Volcanoes do more than we can in 10 years. But I thought to myself. What if we were still riding horses? I can't even imagine what that would look like. Millions of millions of horses. We have three cars. Used cars but if they were horses.... omg. I can already hear the whining lol.
Nice collection of data you provided. I hope someone somewhere learns a little bit before echoing the media and payed off scientists.
edit on
10-12-2019 by TheGhoul because: because I can
a reply to: Nathan-D
I'm glad you asked, there is no such thing as stupid questions only stupid answers.
Let me paint you a similar scenario and you tell me if it rings true.
Imagine trying to collect water from the rain, like CO2 collects heat from the sun.
Would you believe me if I told you you shouldn't add more containers to collect rain because that will result in less water being collected in each of the containers?
I'm glad you asked, there is no such thing as stupid questions only stupid answers.
Let me paint you a similar scenario and you tell me if it rings true.
CO2 behaves somewhat logarithmically and the more of it there is in the atmosphere the less warming each molecule should have.
Imagine trying to collect water from the rain, like CO2 collects heat from the sun.
Would you believe me if I told you you shouldn't add more containers to collect rain because that will result in less water being collected in each of the containers?
I'm glad you asked, there is no such thing as stupid questions only stupid answers.
Let me paint you a similar scenario and you tell me if it rings true.
Imagine trying to collect water from the rain, like CO2 collects heat from the sun.
Would you believe me if I told you you shouldn't add more containers to collect rain because that will result in less water being collected in each of the containers?
The idea that CO2 behaves logarithmically is something that both sides of the AGW debate (adherents and skeptics) accept and the explanation below from Nick Lutsko sums up why it happens, accompanied by some hairy mathematics.
The conventional explanation for this comes from the details of absorption spectra. Greenhouse gases have absorption lines, particular wavelengths at which they absorb electromagnetic radiation. As the concentration of a gas increases the absorption eventually saturates and there's no more radiation at that wavelength to absorb. But absorption lines have a finite width, so although the absorption is maximum at one wavelength, it decays exponentially away to either side of that wavelength. Once the center wavelength is saturated the absorption is mostly in the wings and the forcing increases logarithmically as the concentration of the greenhouse gas is further increased. Present day levels of CO2 are high enough that the main absorption band -- the 15μm wavelength -- is saturated, so most of the additional absorption comes from the wings.
Also keep in mind that your water analogy assumes that we can add water to buckets endlessly, but there is only a finite amount of solar radiation the Earth absorbs. The 2nd law of thermodynamics ordains that the planet cannot warm to any temperature higher than that of the incoming solar irradiance, which I gather is about 1368 W/m² for the Earth. So, adding more CO2 to the atmosphere won’t drive the temperature up endlessly, as it would do in your analogy. Also another explanation as to why we get less warming from increased CO2 concentrations is due to the Stefan-Boltzmann law — which states that the heat-radiance of a body varies in proportion to the 4th-power of its absolute temperature, which means that every time a body (such as atmospheric CO2) doubles in temperature, it requires 16 times the radiation than it previously did.
edit on 10-12-2019 by Nathan-D because: (no
reason given)
a reply to: Nathan-D
Hey there! Nice post OP.
We are going into a mini ice age.... here ya go. There is the culprit.
www.abovetopsecret.com...
Hey there! Nice post OP.
We are going into a mini ice age.... here ya go. There is the culprit.
www.abovetopsecret.com...
new topics
-
WF Killer Patents & Secret Science Vol. 1 | Free Energy & Anti-Gravity Cover-Ups
General Conspiracies: 45 minutes ago -
Hurt my hip; should I go see a Doctor
General Chit Chat: 1 hours ago -
Israel attacking Iran again.
Middle East Issues: 2 hours ago -
Michigan school district cancels lesson on gender identity and pronouns after backlash
Education and Media: 2 hours ago -
When an Angel gets his or her wings
Religion, Faith, And Theology: 3 hours ago -
Comparing the theology of Paul and Hebrews
Religion, Faith, And Theology: 4 hours ago -
Pentagon acknowledges secret UFO project, the Kona Blue program | Vargas Reports
Aliens and UFOs: 5 hours ago -
Boston Dynamics say Farewell to Atlas
Science & Technology: 5 hours ago -
I hate dreaming
Rant: 6 hours ago -
Man sets himself on fire outside Donald Trump trial
Mainstream News: 8 hours ago
top topics
-
The Democrats Take Control the House - Look what happened while you were sleeping
US Political Madness: 8 hours ago, 18 flags -
In an Historic First, In N Out Burger Permanently Closes a Location
Mainstream News: 10 hours ago, 16 flags -
A man of the people
Medical Issues & Conspiracies: 16 hours ago, 11 flags -
Biden says little kids flip him the bird all the time.
Politicians & People: 8 hours ago, 9 flags -
Man sets himself on fire outside Donald Trump trial
Mainstream News: 8 hours ago, 8 flags -
Pentagon acknowledges secret UFO project, the Kona Blue program | Vargas Reports
Aliens and UFOs: 5 hours ago, 6 flags -
Israel attacking Iran again.
Middle East Issues: 2 hours ago, 5 flags -
Michigan school district cancels lesson on gender identity and pronouns after backlash
Education and Media: 2 hours ago, 5 flags -
Boston Dynamics say Farewell to Atlas
Science & Technology: 5 hours ago, 4 flags -
Are you ready for the return of Jesus Christ? Have you been cleansed by His blood?
Religion, Faith, And Theology: 13 hours ago, 3 flags
active topics
-
So I saw about 30 UFOs in formation last night.
Aliens and UFOs • 37 • : charlyv -
When an Angel gets his or her wings
Religion, Faith, And Theology • 3 • : BrotherKinsMan -
Hurt my hip; should I go see a Doctor
General Chit Chat • 11 • : TheLieWeLive -
Sheetz facing racial discrimination lawsuit for considering criminal history in hiring
Social Issues and Civil Unrest • 7 • : Caver78 -
Silent Moments --In Memory of Beloved Member TDDA
Short Stories • 48 • : Encia22 -
MULTIPLE SKYMASTER MESSAGES GOING OUT
World War Three • 52 • : cherokeetroy -
Israel attacking Iran again.
Middle East Issues • 22 • : Boomer1947 -
WF Killer Patents & Secret Science Vol. 1 | Free Energy & Anti-Gravity Cover-Ups
General Conspiracies • 1 • : WakeofPoseidon -
The Democrats Take Control the House - Look what happened while you were sleeping
US Political Madness • 67 • : WeMustCare -
Thousands Of Young Ukrainian Men Trying To Flee The Country To Avoid Conscription And The War
Other Current Events • 53 • : ghandalf
18