It looks like you're using an Ad Blocker.
Please white-list or disable AboveTopSecret.com in your ad-blocking tool.
Thank you.
Some features of ATS will be disabled while you continue to use an ad-blocker.

Climate literacy
page: 5share:
a reply to: WilliamR
It's also not what I said. I said that surface data is more reliable because it consists of direct temperature measurements, not microwave proxies. Radiosondes also provide direct temperature measurements and are more reliable than satellite measurements, btw.
The point was that surface temperatures are more reliable than satellites because of adjustments to the data. That's nonsense.
edit on 3/21/2019 by
Phage because: (no reason given)
a reply to: Phage
That means they do not expect any warming overall. Cool beans. Maybe we're closer to the peak than I expected.
But we'll all be dead, remember?
TheRedneck
You're pretty close to NOAA. Sort of. They're saying a 50% chance it will be above the average from 1981-2010.
That means they do not expect any warming overall. Cool beans. Maybe we're closer to the peak than I expected.
I'll be sure to check in with you on that.
But we'll all be dead, remember?
TheRedneck
a reply to: TheRedneck
I don't think that's what warmer than average means.
Have to issue a correction. For you, it's a 45% chance it will be above average.
That means they do not expect any warming overall.
I don't think that's what warmer than average means.
Speak for yourself, old man.
But we'll all be dead, remember?
Have to issue a correction. For you, it's a 45% chance it will be above average.
edit on 3/21/2019 by Phage because: (no reason given)
a reply to: Phage
They analysed 29 islands, not one. You can read the article yourself that's why i linked it.
Since this thread is supposed to be about surface temperatures, let's back on topic and discuss sea levels in a separate thread.
Re: your first link. Have you read the whole article? I wonder if it addresses the problems of sea water intrusion, an issue separate from coastal erosion. I did find an article by the same author, a bit earlier about another island.
They analysed 29 islands, not one. You can read the article yourself that's why i linked it.
Your second link seems to include large geoengineering projects.
"We expected that the coast would start to retreat due to sea level rise, but the most surprising thing is that the coasts are growing all over the world,"
Since this thread is supposed to be about surface temperatures, let's back on topic and discuss sea levels in a separate thread.
a reply to: WilliamR
Your link takes me to a sign up page. That's it.
You can read the article yourself that's why i linked it.
Okey dokey. Let's forget about satellite data. Good idea. Not reliable enough.
Since this thread is supposed to be about surface temperatures, let's back on topic and discuss sea levels in a separate thread.
edit on 3/21/2019 by Phage because: (no reason given)
a reply to: Phage
Where do you get this from? The confidence intervals are same when the data is used for analysis. No special conditions for satellites, they would not be used at all if the data wasn't considered accurate enough.
I guess you heard this somewhere, but never really checked if this is true.
It's also not what I said. I said that surface data is more reliable because it consists of direct temperature measurements, not microwave proxies. Radiosondes also provide direct temperature measurements and are more reliable than satellite measurements, btw.
Where do you get this from? The confidence intervals are same when the data is used for analysis. No special conditions for satellites, they would not be used at all if the data wasn't considered accurate enough.
I guess you heard this somewhere, but never really checked if this is true.
a reply to: Phage
Since the possibility of next fall being exactly the same temperature as last fall is negligible (->0%), the possibilities of next fall being warmer or colder would be 50% in the absence of any climactic shift. If NOAA is predicting a 50% chance of next fall being warmer than last fall, that is also a 50% chance of the inverse, and no warming trend is therefore expected.
Statistics 101.
Don't talk to me; talk to AOC. She's the one who says we're both gonna die. If she's wrong I plan on outliving you, young'un.
That sucks. I like Global Warming. Someone needs to sue Al Gore for breach of contract.
TheRedneck
I don't think that's what warmer than average means.
Since the possibility of next fall being exactly the same temperature as last fall is negligible (->0%), the possibilities of next fall being warmer or colder would be 50% in the absence of any climactic shift. If NOAA is predicting a 50% chance of next fall being warmer than last fall, that is also a 50% chance of the inverse, and no warming trend is therefore expected.
Statistics 101.
Speak for yourself, old man.
Don't talk to me; talk to AOC. She's the one who says we're both gonna die. If she's wrong I plan on outliving you, young'un.
Have to issue a correction. For you, it's a 45% chance it will be above average.
That sucks. I like Global Warming. Someone needs to sue Al Gore for breach of contract.
TheRedneck
a reply to: WilliamR
skepticalscience.com...
Not really. Pretty much the opposite.
The confidence intervals are same when the data is used for analysis.
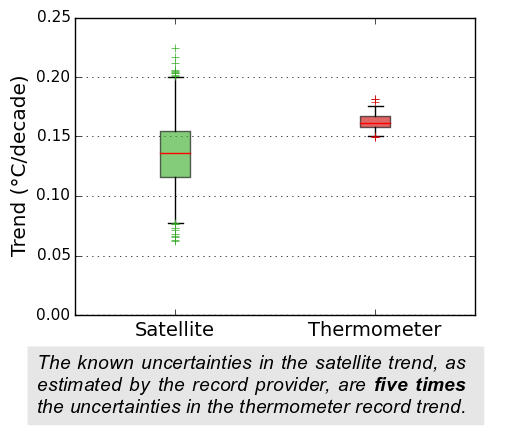
The surface temperature record is comparatively simple - land temperatures, sea surface temperatures and weather station homogenizations can all be produced with a few hundred lines of computer code. By analyzing the source data we can estimate some of the uncertainties for ourselves. I outline one such test in this lecture:
The satellite record is much more complex, requiring multiple corrections to the records from individual satellites, as well as cross calibration between the different satellites. The complexity of the calculation (Figure 2) makes it harder for us to assess it for ourselves. However RSS, one of the satellite record providers, also produce an ensemble of temperature records (Mears et al. 2011). By comparing the spread of the ensembles, we can compare the scale of the known uncertainties in the HadCRUT4 surface temperatures and the RSS satellite temperatures.
skepticalscience.com...
edit on 3/21/2019 by Phage because: (no reason given)
a reply to: TheRedneck
So we have a 45% probability of it being warmer than average, a 33.3% probability of it being average, and a 21.7% chance of it being cooler than average. The greater probability being warmer.
www.cpc.ncep.noaa.gov...
A little more to it. There are three possibilities; warmer, average, and cooler than average.
If NOAA is predicting a 50% chance of next fall being warmer than last fall, that is also a 50% chance of the inverse, and no warming trend is therefore expected.
Statistics 101.
To make it possible to display three categories on one map, we assume that, when either A, or B is the most likely category, the probability of the middle category remains at 33.33% for most situations. This means, for example, that when the probability of A (B) is 40%, the probability of N is 33.33%, and the probability of B (A) is 100% minus 40%+33.33%=26.67%.
So we have a 45% probability of it being warmer than average, a 33.3% probability of it being average, and a 21.7% chance of it being cooler than average. The greater probability being warmer.
www.cpc.ncep.noaa.gov...
edit on 3/21/2019 by Phage because: (no reason given)
a reply to: WilliamR
Thanks
But it does not seem to address the question of salt water intrusion. Just because a coastline may expand, it doesn't mean that the island has gotten higher.
www.semanticscholar.org...
My father was in Funafuti during WWII. He liked the spear fishing but didn't like all the sharks.
Thanks
Results suggest a more optimistic prognosis for the habitability of atoll nations and demonstrate the importance of resolving recent rates and styles of island change to inform adaptation strategies.
But it does not seem to address the question of salt water intrusion. Just because a coastline may expand, it doesn't mean that the island has gotten higher.
The thinness of the brackish and freshwater sheets suggests that the taro swamps and the fresh groundwater resources of the islet are highly vulnerable to salinization from anticipated sea-level rise. An understanding of the inherent geologic and topographic features of an atoll is necessary to evaluate the groundwater resources of the atoll and assess the vulnerability of its water resources to climate change.
www.semanticscholar.org...
My father was in Funafuti during WWII. He liked the spear fishing but didn't like all the sharks.
edit on 3/21/2019 by Phage because: (no reason given)
a reply to: Phage
That's the the skeptical science version. Not the structural uncertainty when the data is compared to model simulations or used for any other analysis. You can go to the source and read all about.
centaur.reading.ac.uk...
I brought up satellite data only in the context of comparisons to model simulations. The structural problems are not the reason the models show too much warming.
Not really. Pretty much the opposite.
That's the the skeptical science version. Not the structural uncertainty when the data is compared to model simulations or used for any other analysis. You can go to the source and read all about.
centaur.reading.ac.uk...
I brought up satellite data only in the context of comparisons to model simulations. The structural problems are not the reason the models show too much warming.
a reply to: Phage
I addressed all three. Keep up.
We have a 1 in 3 chance of it being exactly the same as previously? Really? They must be using a pretty wide definition of "the same."
If not, I now reject the information in that link. There is no way there is that high a chance of being exactly the same temperature as previous falls. If they are using a broad definition of "the same" I need to know what they consider "the same."
TheRedneck
A little more to it. There are three possibilities; warmer, average, and cooler than average.
I addressed all three. Keep up.
So we have a 45% probability of it being warmer than average, a 33.3% probability of it being average, and a 21.7% chance of it being cooler than average. The greater probability being warmer.
We have a 1 in 3 chance of it being exactly the same as previously? Really? They must be using a pretty wide definition of "the same."
If not, I now reject the information in that link. There is no way there is that high a chance of being exactly the same temperature as previous falls. If they are using a broad definition of "the same" I need to know what they consider "the same."
TheRedneck
a reply to: WilliamR
Sounds like Kevin C (in skeptical science) read that article too. That's exactly the point he made. By contrast, the surface based uncertainties are significantly less. They are more reliable.
Your source says this about the uncertainty of satellite temperature derivations:
Not the structural uncertainty when the data is compared to model simulations or used for any other analysis.
Figure 2 reveals large structural uncertainties in satellite TMT datasets. These uncertainties reflect different choices in dataset construction, primarily related to the treatment of orbital drift, the impact of orbital drift on sampling the diurnal cycle of atmospheric temperature, and the influence of instrument body temperature.
Sounds like Kevin C (in skeptical science) read that article too. That's exactly the point he made. By contrast, the surface based uncertainties are significantly less. They are more reliable.
And I said surface measurements are more reliable than satellite derived temperatures.
I brought up satellite data only in the context of comparisons to model simulations. The structural problems are not the reason the models show too much warming.
edit on 3/21/2019 by Phage because: (no reason given)
a reply to: TheRedneck
You could have read the link, you know.
Can you provide the source for the use of your term "the same?"
They must be using a pretty wide definition of "the same."
You could have read the link, you know.
edit on 3/21/2019 by Phage because: (no reason given)
a reply to: Phage
As soon as you provide a source for your definition of "source."
We can play this semantics game all day long'
I wasn't trying to disprove the link. I was just trying to explain the statistics in the information you gave from the link.
TheRedneck
Can you provide the source for the use of your term "the same?"
As soon as you provide a source for your definition of "source."
We can play this semantics game all day long'
You could have read the link, you know.
I wasn't trying to disprove the link. I was just trying to explain the statistics in the information you gave from the link.
TheRedneck
a reply to: TheRedneck
I gave you the link.
It's that blue words thing. Move the arrow thing to it and it will turn into a pointing finger. When it does that, press the left button on your mouse.
As soon as you provide a source for your definition of "source."
I gave you the link.
It's that blue words thing. Move the arrow thing to it and it will turn into a pointing finger. When it does that, press the left button on your mouse.
edit on 3/21/2019 by Phage because: (no reason given)
a reply to: Phage
I made the mistake to believe you would read anything else than the stuff that confirms your misconceptions. Again, it is not the standard error that defines the uncertainty range when the data is used for scientific analysis. Not for the surface data or the satellites. Kevin Cowtan knows this. He coauthored a paper.
But it's irrelevant in the context here. There is not much point in discussing all this, if you don't have a firm grasp on at least the basics. When you say things like that,
i know there is no real understanding of the science. I can only recommend you list all the things, you believe are true and start a real investigation if it matches with science and reality.
realclimate
www.physics.mcgill.ca...
Sounds like Kevin C (in skeptical science) read that article too. That's exactly the point he made. By contrast, the surface based uncertainties are significantly less. They are more reliable.
I made the mistake to believe you would read anything else than the stuff that confirms your misconceptions. Again, it is not the standard error that defines the uncertainty range when the data is used for scientific analysis. Not for the surface data or the satellites. Kevin Cowtan knows this. He coauthored a paper.
rmets.onlinelibrary.wiley.com...
Temperature trends are compared for the hybrid global temperature reconstruction and the raw HadCRUT4 data. The widely quoted trend since 1997 in the hybrid global reconstruction is two and a half times greater than the corresponding trend in the coverage‐biased HadCRUT4 data.
But it's irrelevant in the context here. There is not much point in discussing all this, if you don't have a firm grasp on at least the basics. When you say things like that,
Milankovitch says the planet should be cooling slowly, a bit. Instead it's warming. Rapidly. Sun does not seem to be getting warmer. The things that caused warming in the past don't seem to be happening.
i know there is no real understanding of the science. I can only recommend you list all the things, you believe are true and start a real investigation if it matches with science and reality.
realclimate
www.physics.mcgill.ca...
edit on 22-3-2019 by WilliamR because: tyop
a reply to: Phage
some reads to brush up on science and clear up some misconceptions.
news.wisc.edu...
www.sciencedirect.com...
some reads to brush up on science and clear up some misconceptions.
www.pnas.org...
The significant discrepancy between the Holocene global cooling inferred from proxy reconstructions and simulated warming in climate models reflects the Holocene temperature conundrum, which poses an important test for our understanding of climate changes and for the evaluation of climate models of their climate sensitivity to GHGs, ice sheets, orbital insolation, and volcanic forcings.
Given the current uncertainties in both the reconstruction and model sensitivity, however, this model-data discrepancy could be attributed to either the seasonal bias in the SST reconstructions or the model bias in regional and seasonal climate sensitivity. If the M13 reconstruction is correct, it will imply major biases across the current generation of climate models. To provide a credible benchmark for future climate models, however, the proxy reconstructions will also need to be reexamined critically.
news.wisc.edu...
researchgate
Although the main features of the “Milankovitch hypothesis” are validated many times, the Milankovitch hypothesis cannot account for all aspects of glacial cycles. Reconstructions of ice volume during the late Pleistocene show that the accumulation and ablation of ice sheets have a very strong 100 kyr cycle.
This periodicity is problematic for theories that stress orbital cycles because the amplitude of the insolation signal associated with eccentricity is only about 2 W/m2 . This change is much smaller than the changes that are associated with precession (≈100 W/m2 ) and obliquity (≈20 W/m2 ) and is at the heart of the 100 kyr problem—why does the climate system respond so strongly to small changes in solar insolation associated with eccentricity?
Similarly, the so-called “stage 11 problem” investigates significant changes in climate despite Earth’s nearly circular orbit about 400 kyr before present. Because of these and other seeming contradictions, the role of solar insolation in glacial cycles still is the subject of debate. As summarized by Tziperman et al. [2006], hypotheses about the role of solar insolation range from “there would be no cycles without orbital variations” (the strong form of the Milankovitch hypothesis) to “glacial cycles exist independently of changes in solar insolation.”
Between these extremes, weaker forms of the Milankovitch hypothesis postulate that solar insolation generates small climate perturbations that are superimposed on independent glacial cycles. Variations on the weak form of the Milankovitch hypothesis include arguments that climatic changes are caused by orbital variations that move solar insolation beyond thresholds or nonlinear phase locking.
Arguments for weaker forms of the Milankovitch hypothesis are bolstered by a finding that changes in solar insolation account for less than 20% of the variance in glacial temperature records.
www.sciencedirect.com...
a reply to: Phage
But not an explanation, and not the link I asked for.
You asked me for a source for what "the same" means. I responded sarcastically asking for a source for what "source" meant. The purpose of the sarcasm was to show just how ludicrous it is to try and argue over what "the same" means. We all know what it means, Phage. This is not politics where one gets to redefine common words to try and linguistically out-maneuver the other. We are discussing science.
Same means quantitatively equal. If someone wishes to define it as "approximately equal," one must include the interval over which they consider the temperatures approximately equal; anything else is just fudging a guess. You could have stated that the report expanded equal to include the interval of +/- 5 degrees (or whatever interval they chose), but you did not do so. You instead tried to use linguistic redefinition. That is not science.
You seem to take these occasions when the most basic concepts are beyond you, despite other times appearing to understand the principles involved. Perhaps you should try a little more comprehension and a little less linking. Anyone can type in the old "[url=some website I found] linky-poo [/url]," but it doesn't automatically mean that someone can comprehend what the link is saying.
As you just proved.
TheRedneck
I gave you the link.
But not an explanation, and not the link I asked for.
You asked me for a source for what "the same" means. I responded sarcastically asking for a source for what "source" meant. The purpose of the sarcasm was to show just how ludicrous it is to try and argue over what "the same" means. We all know what it means, Phage. This is not politics where one gets to redefine common words to try and linguistically out-maneuver the other. We are discussing science.
Same means quantitatively equal. If someone wishes to define it as "approximately equal," one must include the interval over which they consider the temperatures approximately equal; anything else is just fudging a guess. You could have stated that the report expanded equal to include the interval of +/- 5 degrees (or whatever interval they chose), but you did not do so. You instead tried to use linguistic redefinition. That is not science.
You seem to take these occasions when the most basic concepts are beyond you, despite other times appearing to understand the principles involved. Perhaps you should try a little more comprehension and a little less linking. Anyone can type in the old "[url=some website I found] linky-poo [/url]," but it doesn't automatically mean that someone can comprehend what the link is saying.
As you just proved.
TheRedneck
new topics
-
whistleblower Captain Bill Uhouse on the Kingman UFO recovery
Aliens and UFOs: 4 hours ago -
1980s Arcade
General Chit Chat: 7 hours ago -
Deadpool and Wolverine
Movies: 7 hours ago -
Teenager makes chess history becoming the youngest challenger for the world championship crown
Other Current Events: 8 hours ago -
CIA botched its handling of sexual assault allegations, House intel report says
Breaking Alternative News: 9 hours ago
top topics
-
Lawsuit Seeks to ‘Ban the Jab’ in Florida
Diseases and Pandemics: 12 hours ago, 20 flags -
Starburst galaxy M82 - Webb Vs Hubble
Space Exploration: 14 hours ago, 13 flags -
The Superstition of Full Moons Filling Hospitals Turns Out To Be True!
Medical Issues & Conspiracies: 16 hours ago, 8 flags -
CIA botched its handling of sexual assault allegations, House intel report says
Breaking Alternative News: 9 hours ago, 8 flags -
15 Unhealthiest Sodas On The Market
Health & Wellness: 14 hours ago, 6 flags -
whistleblower Captain Bill Uhouse on the Kingman UFO recovery
Aliens and UFOs: 4 hours ago, 6 flags -
1980s Arcade
General Chit Chat: 7 hours ago, 4 flags -
Teenager makes chess history becoming the youngest challenger for the world championship crown
Other Current Events: 8 hours ago, 3 flags -
Deadpool and Wolverine
Movies: 7 hours ago, 3 flags
active topics
-
Lawsuit Seeks to ‘Ban the Jab’ in Florida
Diseases and Pandemics • 22 • : Disgusted123 -
Definitive 9.11 Pentagon EVIDENCE.
9/11 Conspiracies • 421 • : Lazy88 -
1980s Arcade
General Chit Chat • 8 • : F2d5thCavv2 -
What is a dream
The Gray Area • 27 • : wrayth -
Europe declares war on Russia?
World War Three • 61 • : F2d5thCavv2 -
The Acronym Game .. Pt.3
General Chit Chat • 7741 • : F2d5thCavv2 -
Russia Ukraine Update Thread - part 3
World War Three • 5713 • : F2d5thCavv2 -
IDF Intel Chief Resigns Over Hamas attack
Middle East Issues • 32 • : Terpene -
15 Unhealthiest Sodas On The Market
Health & Wellness • 32 • : VariedcodeSole -
Fast Moving Disc Shaped UFO Captured on Camera During Flight from Florida to New York City
Aliens and UFOs • 18 • : inflaymes69