It looks like you're using an Ad Blocker.
Please white-list or disable AboveTopSecret.com in your ad-blocking tool.
Thank you.
Some features of ATS will be disabled while you continue to use an ad-blocker.

Climate literacy
page: 4share:
a reply to: TheRedneck
Models seem to have a pretty good handle on it. But maybe it will all change. Maybe plants will suddenly consume more CO2. They don't seem to be keeping up so far.
Let's just wait a few more decades and find out.
 www.realclimate.org...
Models seem to have a pretty good handle on it. But maybe it will all change. Maybe plants will suddenly consume more CO2. They don't seem to be keeping up so far.
Let's just wait a few more decades and find out.
edit on 3/21/2019 by Phage because: (no reason given)
a reply to: Phage
You're describing the exact same changes the surface and the humans on it have experienced for millennia. I asked again, Can a global average tell us where and how we are impacted by any current changes?
It means changing climates, changing agricultural patterns, a lot less rainfall in places, a lot more in others.
You're describing the exact same changes the surface and the humans on it have experienced for millennia. I asked again, Can a global average tell us where and how we are impacted by any current changes?
a reply to: WilliamR
Not really. But then there haven't been the large populations to be affected by such changes either.
You're describing the exact same changes the surface and the humans on it have experienced for millennia.
I'm not sure I understand your question. Are you looking for specific situations? Sea level rise is affecting various places. Attributing specific weather events to warming can be problematic at this stage but the Arctic air mass does seem to be intruding further south more frequently.
Can a global average tell us where and how we are impacted by any current changes?
edit on 3/21/2019 by Phage because: (no reason given)
a reply to: Phage
That's exactly how you would describe climate change on the surface in broad terms, as you did.
Before you could even start any attribution, you would need to analyse the changes in each part of the system. That's what climate science does. The data in the OP is used exactly for that purpose. I still think you know all this, but somehow you are insisting that global averages matter more then a look at the changes in detail.
Not really
That's exactly how you would describe climate change on the surface in broad terms, as you did.
Attributing specific weather events to warming can be problematic at this stage but the Arctic air mass does seem to be intruding further south more frequently.
Before you could even start any attribution, you would need to analyse the changes in each part of the system. That's what climate science does. The data in the OP is used exactly for that purpose. I still think you know all this, but somehow you are insisting that global averages matter more then a look at the changes in detail.
a reply to: WilliamR
Global averages show a trend in the amount of heat being retained by the system. Heat is what drives weather and climates. It also causes changes in oceanic circulation patterns which has varying effects. The global average is far more important than local changes in temperature.
There are places which will show little change, but there also are places which will show drastic change. Maybe, if you (or your kids) are lucky, it will turn out that you live in one of the latter.
I still think you know all this, but somehow you are insisting that global averages matter more then a look at the changes in detail.
Global averages show a trend in the amount of heat being retained by the system. Heat is what drives weather and climates. It also causes changes in oceanic circulation patterns which has varying effects. The global average is far more important than local changes in temperature.
There are places which will show little change, but there also are places which will show drastic change. Maybe, if you (or your kids) are lucky, it will turn out that you live in one of the latter.
edit on 3/21/2019 by Phage because: (no reason given)
a reply to: Phage
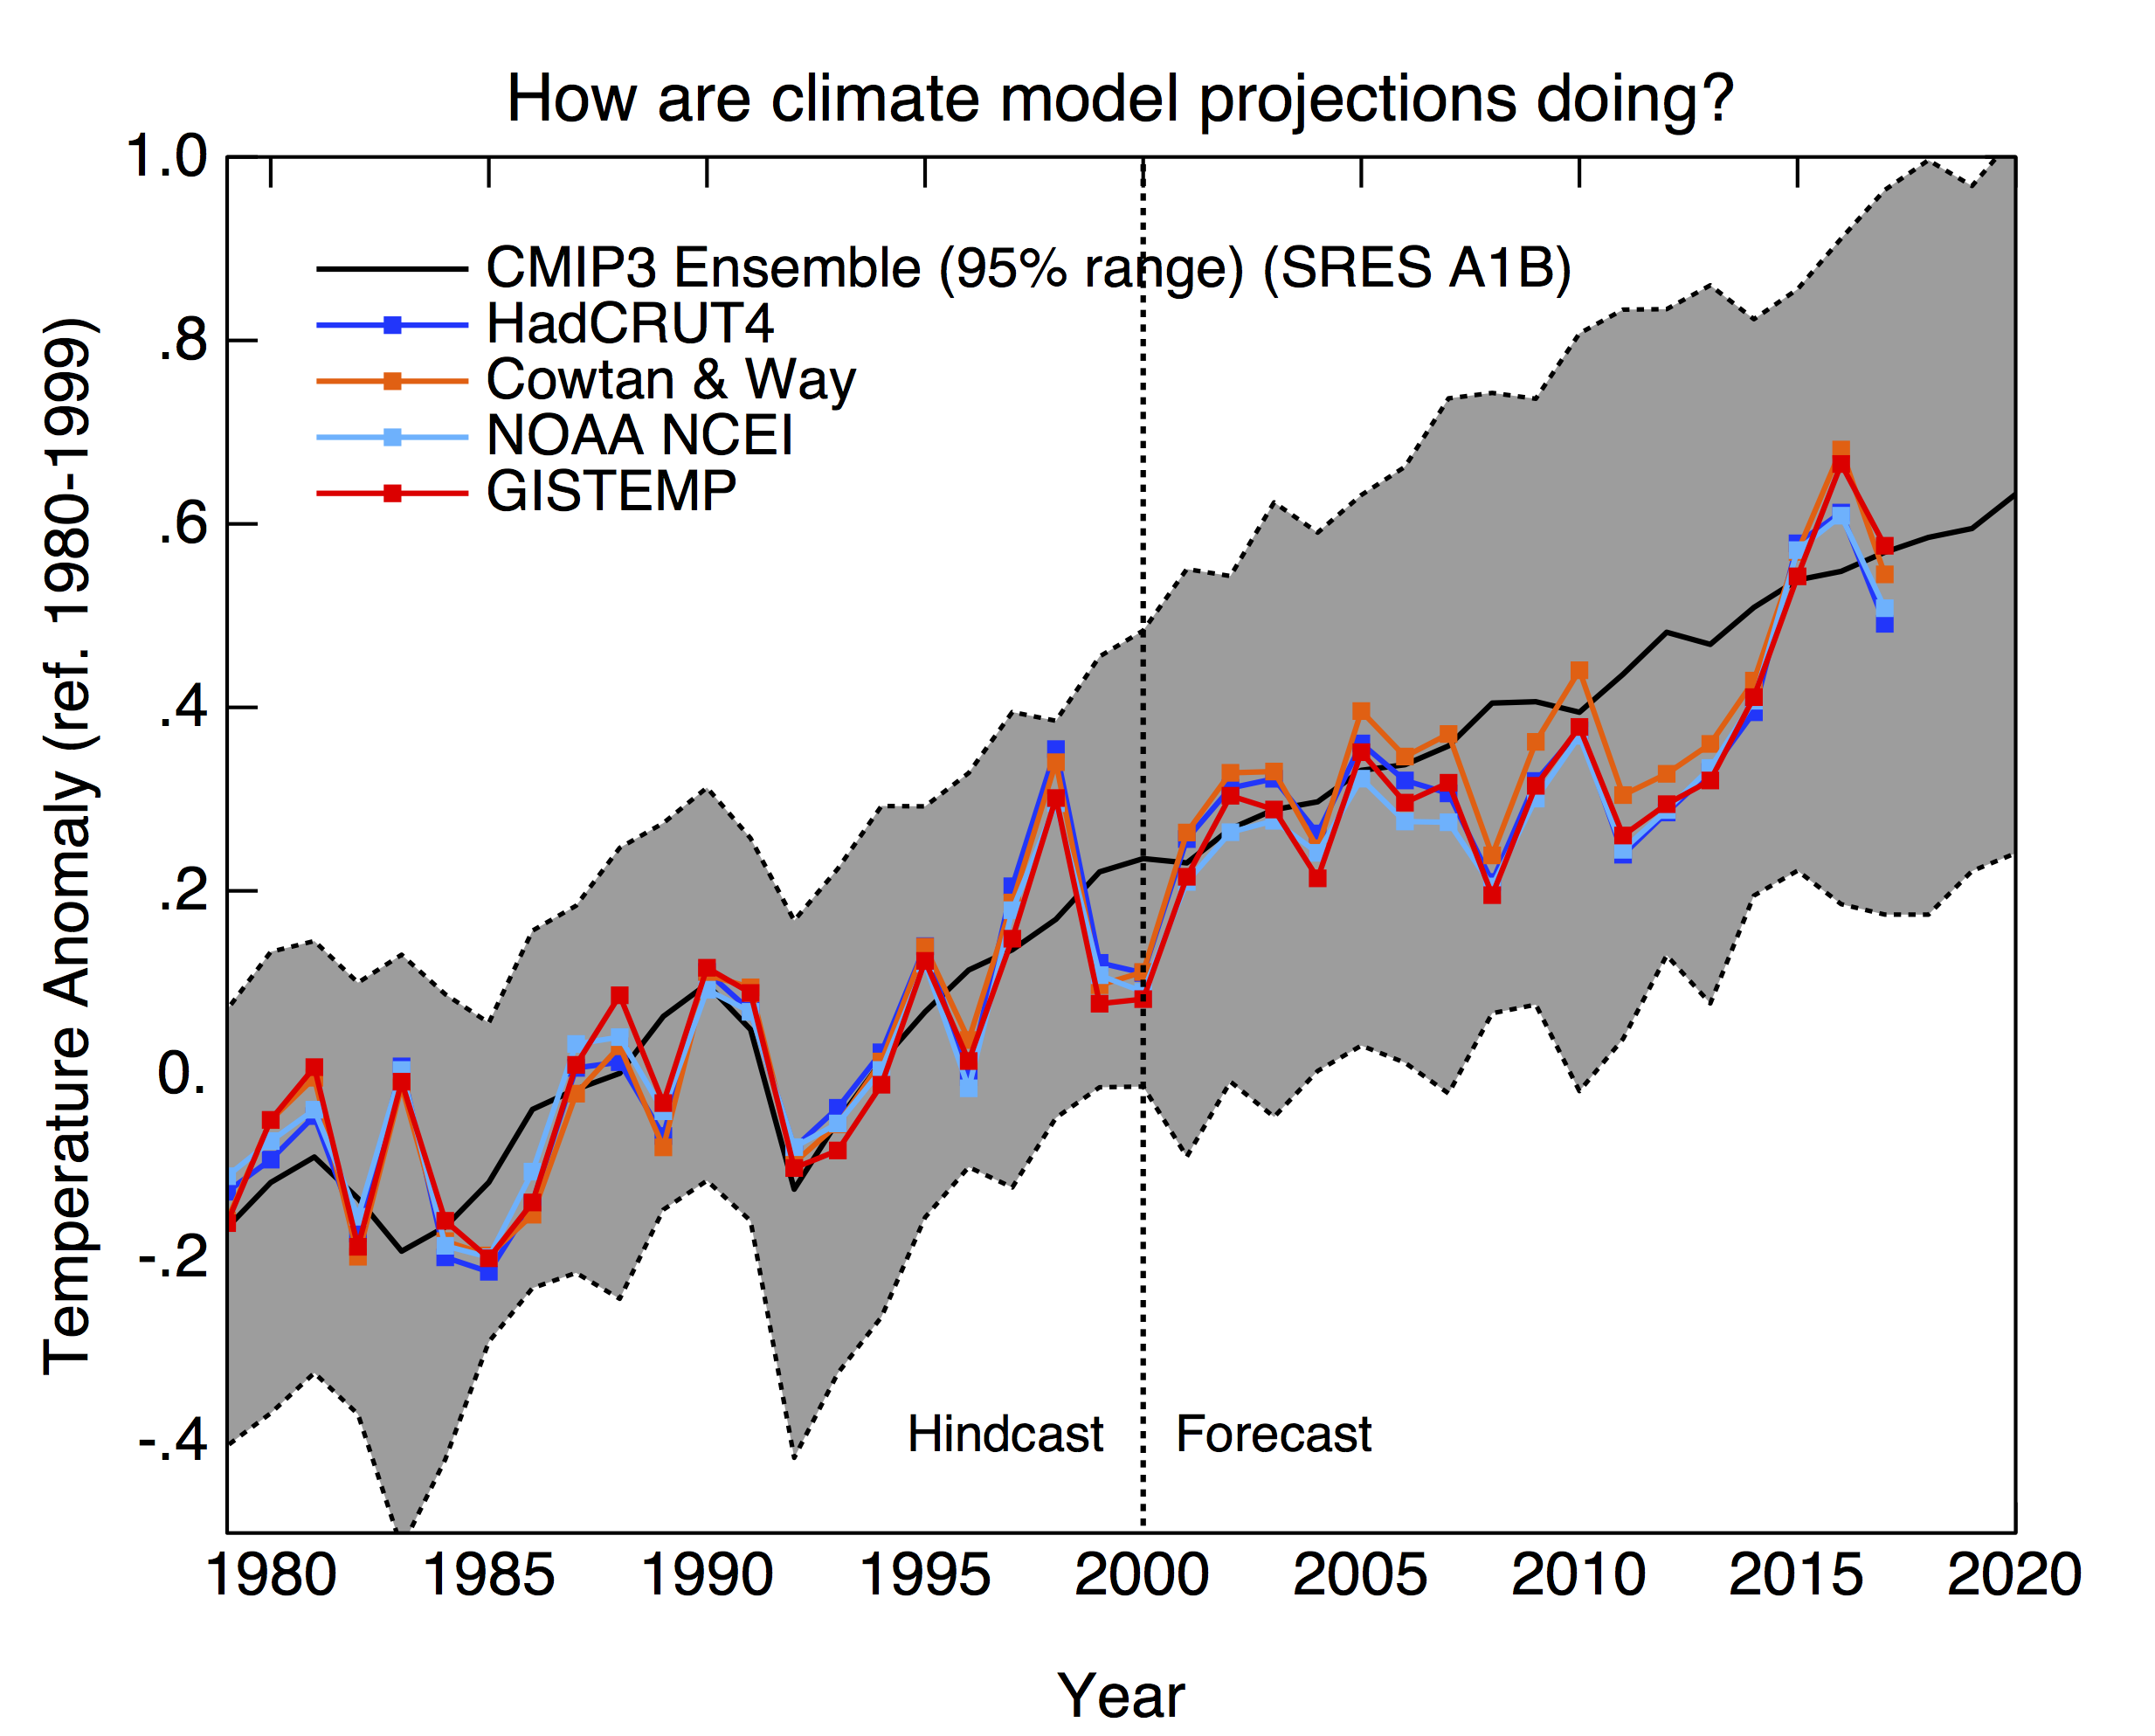
The exact same models are still struggling to simulate key parts of the system. The parts that are important to understand to make future projections.
There is no controversy here. It's an ongoing and constructive discussion in climate research.
Just two examples, you can find many more to see that it is a still symptomatic problem. No climate scientist is denying that really.
Models seem to have a pretty good handle on it. But maybe it will all change. Maybe plants will suddenly consume more CO2. They don't seem to be keeping up so far.
The exact same models are still struggling to simulate key parts of the system. The parts that are important to understand to make future projections.
There is no controversy here. It's an ongoing and constructive discussion in climate research.
www.researchgate.net...
Even though dry and wet conditions occurred over extensive areas under both warm and cold climate regimes, a statistically significant co-variability of hydroclimate and temperature is evident for particular regions. We compare the reconstructed hydroclimate anomalies with coupled atmosphere-ocean general circulation model simulations and find reasonable agreement during pre-industrial times.
However, the intensification of the twentieth-century-mean hydroclimate anomalies in the simulations, as compared to previous centuries, is not supported by our new multi-proxy reconstruction. This finding suggests that much work remains before we can model hydroclimate variability accurately, and highlights the importance of using palaeoclimate data to place recent and predicted hydroclimate changes in a millennium-long context.
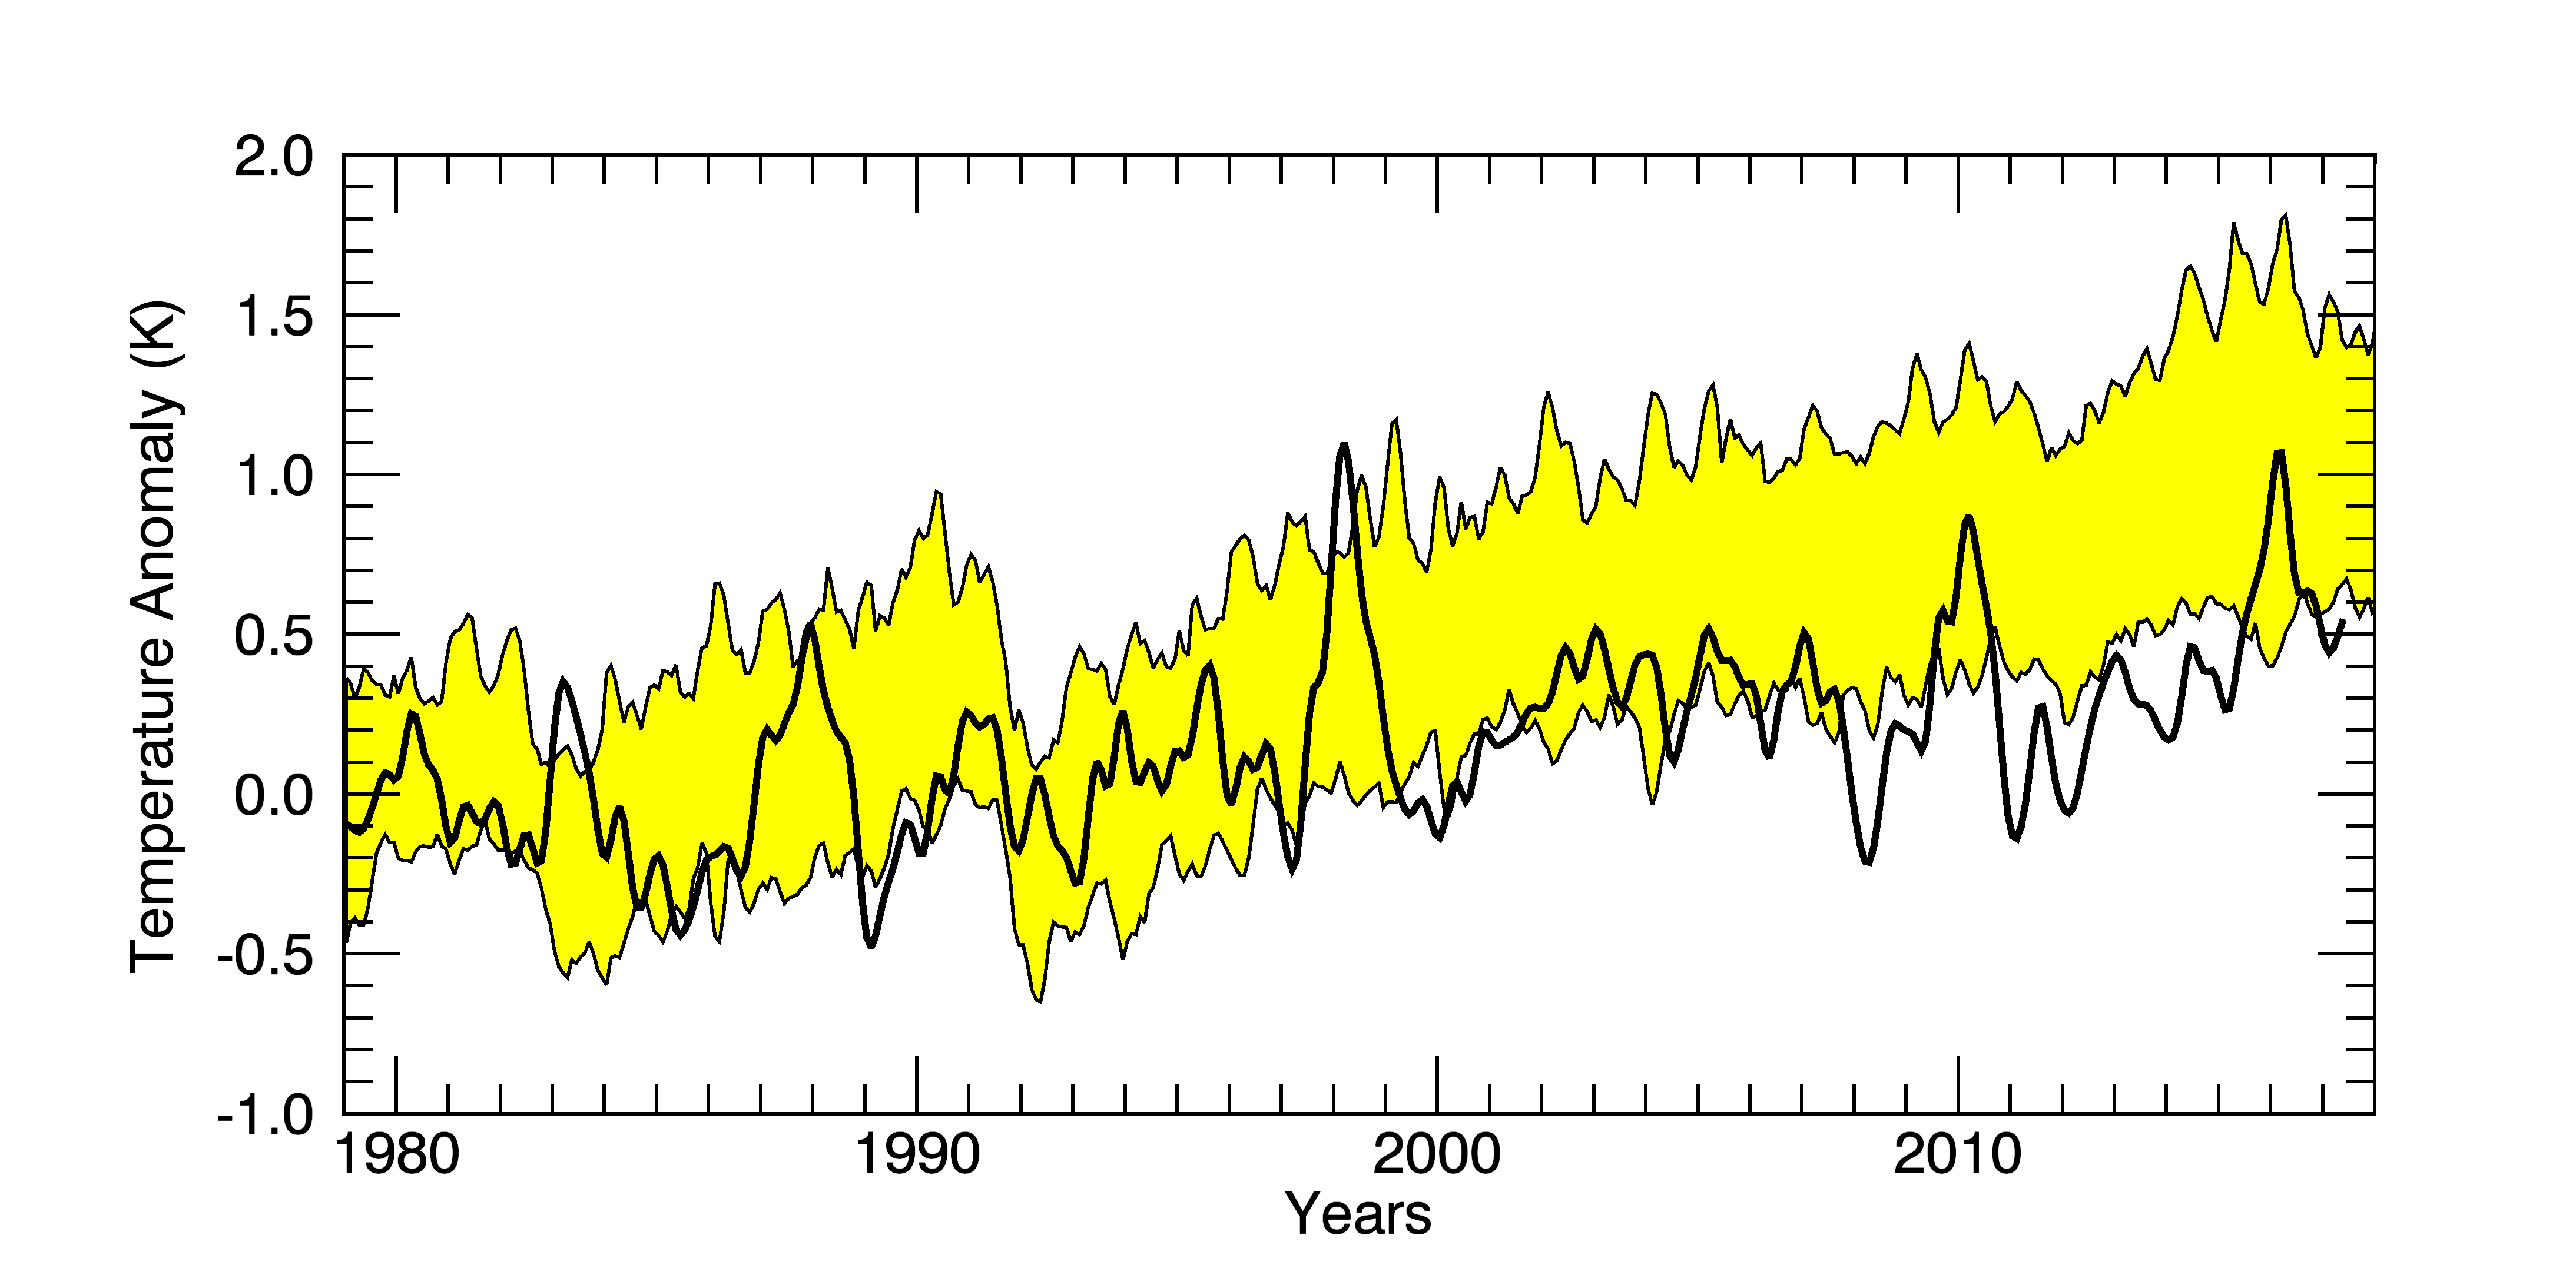
www.remss.com...
The troposphere has not warmed quite as fast as most climate models predict. Note that this problem has been reduced by the large 2015-2106 El Nino Event, and the updated version of the RSS tropospheric datasets. To illustrate this last problem, we show several plots below. Each of these plots has a time series of TLT temperature anomalies using a reference period of 1979-2008. In each plot, the thick black line are the results from the most recent version of the RSS satellite dataset.
The yellow band shows the 5% to 95% envelope for the results of 33 CMIP-5 model simulations (19 different models, many with multiple realizations) that are intended to simulate Earth's Climate over the 20th Century. For the time period before 2005, the models were forced with historical values of greenhouse gases, volcanic aerosols, and solar output. After 2005, estimated projections of these forcings were used. If the models, as a whole, were doing an acceptable job of simulating the past, then the observations would mostly lie within the yellow band.
The yellow band is the 5% to 95% range of output from CMIP-5 climate simulations. The mean value of each time series average from 1979-1984 is set to zero so the changes over time can be more easily seen. Again, after 1998, the observations are likely to be on the low side of the simulated values, indicating that the simulations as a whole are predicting more warming than has been observed by the satellites.
Just two examples, you can find many more to see that it is a still symptomatic problem. No climate scientist is denying that really.
a reply to: Phage
Where are the places that have changed so drastically that people there need to worry about their future. Do you live in one of those places?
There are places which will show little change, but there also are places which will show drastic change. Maybe, if you (or your kids) are lucky, it will turn out that you live in one of the latter.
Where are the places that have changed so drastically that people there need to worry about their future. Do you live in one of those places?
a reply to: WilliamR
Yes, modeling the specific response in specific areas is problematic. Melting ice will affect thermohaline circulation, the precise effects of that are beyond current capabilities to predict but we do know that historically such changes have profound effects.
The exact same models are still struggling to simulate key parts of the system.
I'm sure you are aware of the problematic nature of satellite temperature models. Satellites don't lower thermometers into the atmosphere, the models rely upon interpretation of oxygen microwave emissions. Surface measurements are more reliable at this time. But the satellite data does show a warming trend.
Just two examples, you can find many more to see that it is a still symptomatic problem.
edit on 3/21/2019 by Phage because: (no reason given)
a reply to: WilliamR
Where are the places that have changed so drastically that people there need to worry about their future.
www.citylab.com...
Temperatures in the Arctic continue to soar at double the rate of the rest of the world. At the same time, precipitation patterns are also changing all over the planet; in the Arctic, that means more erratic snowfall. These changes are affecting the very basis of the Arctic: the land.
It’s difficult to build new houses on thawing permafrost, and many existing houses have huge cracks in the foundations. It is also extremely expensive to ship materials in the Arctic, so the houses that are repaired and built must be planned very carefully.
www.newscientist.com...
But the mood has changed here recently. The new government, under president Abdulla Yameen, no longer seeks land to buy, but is instead determined for the nation to stay put and resist the rising seas with geoengineering projects.
a reply to: Phage
Seeing as every prediction of doom and gloom that has come out of the IPCC and Al Gore's vortex... er, I mean mouth... have failed to materialize, I wouldn't say they "have a pretty good handle on it." Also, you seem to be ignoring the transition times required in any large-scale heat transfer and/or biochemical reaction. I don't remember ever saying that plants will suddenly overgrow the planet overnight because CO2 levels rise by 0.01% over a span of a few decades.
Now you're talking sense!
Oh, wait, did I detect sarcasm?
TheRedneck
Models seem to have a pretty good handle on it. But maybe it will all change. Maybe plants will suddenly consume more CO2. They don't seem to be keeping up so far.
Seeing as every prediction of doom and gloom that has come out of the IPCC and Al Gore's vortex... er, I mean mouth... have failed to materialize, I wouldn't say they "have a pretty good handle on it." Also, you seem to be ignoring the transition times required in any large-scale heat transfer and/or biochemical reaction. I don't remember ever saying that plants will suddenly overgrow the planet overnight because CO2 levels rise by 0.01% over a span of a few decades.
Let's just wait a few more decades and find out.
Now you're talking sense!
Oh, wait, did I detect sarcasm?
TheRedneck
a reply to: TheRedneck
No. More a sense of futility.
It seems to be human nature to not do anything about anything until absolutely necessary. Unfortunately, the growing CO2 content of the atmosphere has a lot of inertia. It's a big 'ol snowball and delaying action only makes it more difficult (and expensive) to deal with.
Oh, wait, did I detect sarcasm?
No. More a sense of futility.
It seems to be human nature to not do anything about anything until absolutely necessary. Unfortunately, the growing CO2 content of the atmosphere has a lot of inertia. It's a big 'ol snowball and delaying action only makes it more difficult (and expensive) to deal with.
edit on 3/21/2019 by Phage because: (no reason given)
a reply to: Phage
No, the problem are broad scale patterns of change that are relevant to humans.
That's nonsense. Both measure temperatures to a 100th of a degree and satellites are the least affected by adjustments to the data. Station data is generally less mature but it wouldn't make sense declare is one more reliable than the other. Both are used for analysis.
Yes, modeling the specific response in specific areas is problematic.
No, the problem are broad scale patterns of change that are relevant to humans.
Surface measurements are more reliable at this time.
That's nonsense. Both measure temperatures to a 100th of a degree and satellites are the least affected by adjustments to the data. Station data is generally less mature but it wouldn't make sense declare is one more reliable than the other. Both are used for analysis.
a reply to: WilliamR
Surface temperatures are reported to the nearest degree. I used to be a certified weather observer. I never reported 100ths, or tenths.
www1.ncdc.noaa.gov...
I would like some evidence that satellites measure temperatures to the 100th of a degree. But are you kidding about adjustments?
Incorrect.
Both measure temperatures to a 100th of a degree and satellites are the least affected by adjustments to the data.
Surface temperatures are reported to the nearest degree. I used to be a certified weather observer. I never reported 100ths, or tenths.
www1.ncdc.noaa.gov...
I would like some evidence that satellites measure temperatures to the 100th of a degree. But are you kidding about adjustments?
www.carbonbrief.org...
After correcting for problems caused by the decaying orbit of satellites, as well as other factors, they have produced a new record showing 36% faster warming since 1979 and nearly 140% faster (i.e. 2.4 times larger) warming since 1998. This is in comparison to the previous version 3 of the lower tropospheric temperature (TLT) data published in 2009.
edit on 3/21/2019 by Phage because: (no reason given)
a reply to: Phage
Ah, acceptance of futility... that can be a good thing.
Fear not Phage. Should there ever be an actual need for action, it will get taken. Today is simply not that day.
I predict warming temperatures for the Northern Hemisphere to last for the next 4 months, but then things will cool off again.
TheRedneck
a reply to: TheRedneck
That's seasonal variation. The real question is, will next fall be warmer than last fall and the fall before that and the fall before that.
www.cpc.ncep.noaa.gov...
That's seasonal variation. The real question is, will next fall be warmer than last fall and the fall before that and the fall before that.
www.cpc.ncep.noaa.gov...
a reply to: Phage
There is very little real analysis in both articles, but how do you get form impacts on communities in some arctic locations to drastic changes anywhere else? Is the regional perspective important or not?
The thread was meant to discuss surface temperatures and you keep bringing up sea levels.
The topic is as complex as temperature changes, the article you linked shows that.
I leave this here because it needs a response. But lets keep the focus on surface temperatures.
The global average
aqua-monitor.appspot.com...
There is very little real analysis in both articles, but how do you get form impacts on communities in some arctic locations to drastic changes anywhere else? Is the regional perspective important or not?
The thread was meant to discuss surface temperatures and you keep bringing up sea levels.
The topic is as complex as temperature changes, the article you linked shows that.
I leave this here because it needs a response. But lets keep the focus on surface temperatures.
researchgate.net
The geological stability and existence of low-lying atoll nations is threatened by sea-level rise and climate change. Funafuti Atoll, in the tropical Pacific Ocean, has experienced some of the highest rates of sea-level rise (~5.1 ± 0.7 mm/yr), totaling ~0.30 ± 0.04 m over the past 60 yr.
We analyzed six time slices of shoreline position over the past 118 yr at 29 islands of Funafuti Atoll to determine their physical response to recent sea-level rise. Despite the magnitude of this rise, no islands have been lost, the majority have enlarged, and there has been a 7.3% increase in net island area over the past century (A.D. 1897–2013).
There is no evidence of heightened erosion over the past half-century as sea-level rise accelerated. Reef islands in Funafuti continually adjust their size, shape, and position in response to variations in boundary conditions, including storms, sediment supply, as well as sea level. Results suggest a more optimistic prognosis for the habitability of atoll nations and demonstrate the importance of resolving recent rates and styles of island change to inform adaptation strategies.
The global average
Surface water shifting around the Earth
Coastal areas were also analysed, and to the scientists surprise, coastlines had gained more land - 33,700 sq km (13,000 sq miles) - than they had been lost to water (20,100 sq km or 7,800 sq miles).
"We expected that the coast would start to retreat due to sea level rise, but the most surprising thing is that the coasts are growing all over the world," said Dr Baart. "We're were able to create more land than sea level rise was taking."
aqua-monitor.appspot.com...
edit on 21-3-2019 by WilliamR because: fixed link
a reply to: WilliamR
[url= www.researchgate.net...]source[/ url]
Your second link seems to include large geoengineering projects.
Do I have to repeat the question of yours which I answered or would you prefer to keep the goalpost casually relocated.
There is very little real analysis in both articles, but how do you get form impacts on communities in some arctic locations to drastic changes anywhere else? Is the regional perspective important or not?
Re: your first link. Have you read the whole article? I wonder if it addresses the problems of sea water intrusion, an issue separate from coastal erosion. I did find an article by the same author, a bit earlier about another island:
I leave this here because it needs a response.
Over the past century the island has reduced in net area by approximately 23%.
[url= www.researchgate.net...]source[/ url]
Your second link seems to include large geoengineering projects.
While China and Dubai aren't doing it because they have to, we probably will before too long.
The researchers said Dubai's coast had been significantly extended, with the creation of new islands to house luxury resorts.
"China has also reconstructed their whole coast from the Yellow Sea all the way down to Hong Kong," sid Dr Baart.
edit on 3/21/2019 by Phage because: (no reason given)
a reply to: Phage
We have a winner!
Based on the trends for this area since 1950, I would estimate a 55% chance next fall will be warmer than this past one, and a 45% chance it will be cooler. I also expect that percentage difference to reverse within the next 20 years.
Oh, wait, that can't be right... AOC and the fake Latino say we'll all be dead in 12 years. Crap, and I wanted to see my prediction come true so I could rub everyone's face in it...
TheRedneck
That's seasonal variation.
We have a winner!
The real question is, will next fall be warmer than last fall and the fall before that and the fall before that.
Based on the trends for this area since 1950, I would estimate a 55% chance next fall will be warmer than this past one, and a 45% chance it will be cooler. I also expect that percentage difference to reverse within the next 20 years.
Oh, wait, that can't be right... AOC and the fake Latino say we'll all be dead in 12 years. Crap, and I wanted to see my prediction come true so I could rub everyone's face in it...
TheRedneck
a reply to: TheRedneck
You're pretty close to NOAA. Sort of. They're saying a 50% chance it will be above the average from 1981-2010.
I would estimate a 55% chance next fall will be warmer than this past one,
I'll be sure to check in with you on that.
I also expect that percentage difference to reverse within the next 20 years.
edit on 3/21/2019 by Phage because: (no reason given)
a reply to: Phage
Automated data-loggers do, most of them installed in 80's and 90's, but it doesn't matter it's redundant precision.
The point was that surface temperatures are more reliable than satellites because of adjustments to the data. That's nonsense. Do you know that here is data where you can check up on all this?
www.climate4you.com...
Again, both are used for analysis.
Surface temperatures are reported to the nearest degree. I used to be a certified weather observer. I never reported 100ths, or tenths.
Automated data-loggers do, most of them installed in 80's and 90's, but it doesn't matter it's redundant precision.
The point was that surface temperatures are more reliable than satellites because of adjustments to the data. That's nonsense. Do you know that here is data where you can check up on all this?
www.climate4you.com...
Again, both are used for analysis.
new topics
-
Las Vegas UFO Spotting Teen Traumatized by Demon Creature in Backyard
Aliens and UFOs: 1 hours ago -
2024 Pigeon Forge Rod Run - On the Strip (Video made for you)
Automotive Discussion: 2 hours ago -
Gaza Terrorists Attack US Humanitarian Pier During Construction
Middle East Issues: 2 hours ago -
The functionality of boldening and italics is clunky and no post char limit warning?
ATS Freshman's Forum: 4 hours ago -
Meadows, Giuliani Among 11 Indicted in Arizona in Latest 2020 Election Subversion Case
Mainstream News: 4 hours ago -
Massachusetts Drag Queen Leads Young Kids in Free Palestine Chant
Social Issues and Civil Unrest: 4 hours ago -
Weinstein's conviction overturned
Mainstream News: 6 hours ago -
Supreme Court Oral Arguments 4.25.2024 - Are PRESIDENTS IMMUNE From Later Being Prosecuted.
Above Politics: 7 hours ago -
Krystalnacht on today's most elite Universities?
Social Issues and Civil Unrest: 7 hours ago -
Chris Christie Wishes Death Upon Trump and Ramaswamy
Politicians & People: 8 hours ago
top topics
-
Krystalnacht on today's most elite Universities?
Social Issues and Civil Unrest: 7 hours ago, 9 flags -
Weinstein's conviction overturned
Mainstream News: 6 hours ago, 6 flags -
Supreme Court Oral Arguments 4.25.2024 - Are PRESIDENTS IMMUNE From Later Being Prosecuted.
Above Politics: 7 hours ago, 6 flags -
University of Texas Instantly Shuts Down Anti Israel Protests
Education and Media: 10 hours ago, 6 flags -
Massachusetts Drag Queen Leads Young Kids in Free Palestine Chant
Social Issues and Civil Unrest: 4 hours ago, 4 flags -
Meadows, Giuliani Among 11 Indicted in Arizona in Latest 2020 Election Subversion Case
Mainstream News: 4 hours ago, 4 flags -
Chris Christie Wishes Death Upon Trump and Ramaswamy
Politicians & People: 8 hours ago, 2 flags -
Any one suspicious of fever promotions events, major investor Goldman Sachs card only.
The Gray Area: 12 hours ago, 2 flags -
Gaza Terrorists Attack US Humanitarian Pier During Construction
Middle East Issues: 2 hours ago, 2 flags -
2024 Pigeon Forge Rod Run - On the Strip (Video made for you)
Automotive Discussion: 2 hours ago, 1 flags
active topics
-
Is there a hole at the North Pole?
ATS Skunk Works • 40 • : Oldcarpy2 -
Fossils in Greece Suggest Human Ancestors Evolved in Europe, Not Africa
Origins and Creationism • 89 • : whereislogic -
Meadows, Giuliani Among 11 Indicted in Arizona in Latest 2020 Election Subversion Case
Mainstream News • 7 • : chr0naut -
Supreme Court Oral Arguments 4.25.2024 - Are PRESIDENTS IMMUNE From Later Being Prosecuted.
Above Politics • 71 • : Vermilion -
University of Texas Instantly Shuts Down Anti Israel Protests
Education and Media • 197 • : NorthOS -
Candidate TRUMP Now Has Crazy Judge JUAN MERCHAN After Him - The Stormy Daniels Hush-Money Case.
Political Conspiracies • 790 • : Oldcarpy2 -
Weinstein's conviction overturned
Mainstream News • 20 • : Xtrozero -
Cats Used as Live Bait to Train Ferocious Pitbulls in Illegal NYC Dogfighting
Social Issues and Civil Unrest • 22 • : NoviceStoic4 -
Sunak spinning the sickness figures
Other Current Events • 22 • : angelchemuel -
Massachusetts Drag Queen Leads Young Kids in Free Palestine Chant
Social Issues and Civil Unrest • 10 • : Cre8chaos79