It looks like you're using an Ad Blocker.
Please white-list or disable AboveTopSecret.com in your ad-blocking tool.
Thank you.
Some features of ATS will be disabled while you continue to use an ad-blocker.

Real Numbers for Gobal Warming - Some Surprises!
page: 4share:
a reply to: stormcell
The problem with ocean temperatures is that they don't exist to the same degree that land temperatures do. As it is, I cannot accurately pin down the cyclic behavior that seems to be responsible for the temperature rise, simply because even almost 70 years is too little. Longer period cycles require longer periods of data in order to accurately measure them. I can see that it exists, but accurate readings on period and intensity are quite difficult. A few more months of data could shift the period of the trend line by several years.
Incidentally, I just added November 2018 to the long-term graph and it was a cold November... it dropped the annualized average by a degree and made a minor shift in the trend line of maybe a year at best. The graphs shown were taken before November was complete, so they only go through October 2018.
I will admit I made the choice of stations with a bit of self-interest in mind. I was primarily interested in my local temperatures. I am glad to see that my results mirrored the results of others using their same time frame. That gives me confidence that my findings are representative of the global temperatures.
TheRedneck
a reply to: ketsuko
The heat island effect...
An advantage to using local readings is that I am somewhat familiar with the area and how it has grown over the years. The first and last stations (KHUA and KHSV) are within a couple of miles from each other, both in areas that experienced a major boon starting around the 1980s (they are actually located at the edge of Madison, AL). The last one, KHSV, I know has changed environments pretty drastically. In the 1970s, just to illustrate, Madison, AL was a very small community with a cardboard plant I sometimes used for project supplies in the middle of nowhere. During the 1980s, they had a major growth spurt that placed them at one time in the top 3 fastest-growing cities in the country. They had to stop issuing building permits at several points in time because the utility companies could not keep up with the demand. So yes, I can see some heat island effect skewing the results higher than if they were located in areas that were undisturbed.
KDCA is located in Decatur close to the Tennessee River. That area has been built up for some time, and the proximity to the river tells me to expect the water to mitigate any heat island effect in any case. I would not expect to see appreciable heat island effect on it.
Of course, that brings up the question of why are all three showing similar readings. Every switch between stations I examined the data that overlapped and assured myself that the temperatures were close enough that no adjustments were needed. The first change of stations was in 1983, so there may have been enough heat island effect at that time to equate with the Decatur station as well.
In other words, the heat island effect may have a bearing, but it was a similar bearing across all three stations so I really can't say one way or another.
TheRedneck
a reply to: network dude
Thank you for that vote of confidence. So far I have not been disappointed overall with the questions that have been asked. I am actually impressed with most of them.
Just not the one about politics, as you point out.
TheRedneck
Thank you for that vote of confidence. So far I have not been disappointed overall with the questions that have been asked. I am actually impressed with most of them.
Just not the one about politics, as you point out.
TheRedneck
a reply to: TheRedneck
Thank you
This is the exact sort of thing I like to see and you presented it in an easy to understand way.
I think you also demonstrate one of the big issues with studies to date quite well. The lack of available accurate historic data and the possibility of flawed data. The results are only as accurate as the available data allows.
I agree. I have zero issue with money being used to improve things in our environment, but this idea of just pumping money into the giant money pits we call governments means wasted money and wasted time IMO.
a reply to: Blaine91555
One thing I absolutely detest about science articles is they tend to use more big words than are needed. It's true that some terms outside most people's vocabulary are sometimes needed for clarity, but many times it is just to make the author 'look smart.' I see no reason to make myself 'look smart,' since my results are supposed to do that without me adding to it by confusing others. I can use the big words too, but to what end? To make my writing harder to understand?
The methodology part was written similar to what I would place in a journal. The rest was written as an explanation for the average person. I think we'd have a lot of smarter folks around if others in the scientific community would simply write as much as practical without straining their vocabulary.
Maybe if they did that, the MSM could grasp it as well... at least I can hope, I guess...
TheRedneck
a reply to: ManFromEurope
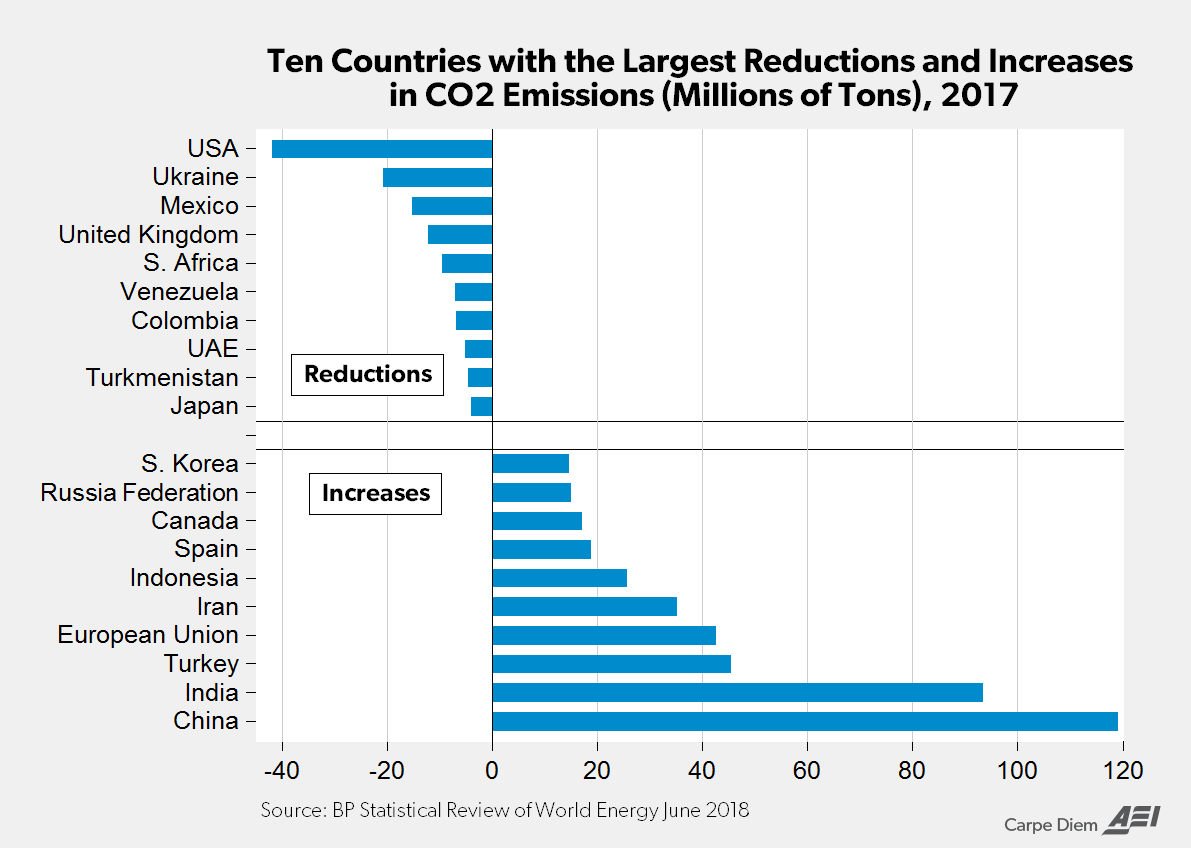
It would seem that the US is leading in CO2 reductions and the UK is doing well, while the EU not so much.
This is more meaningful than who signed what I believe. You know actions being better than words and all.
You should give the OP a read and then you would realize you are off topic and did not understand what it's about?
My apologies to others for going a bit off topic here myself.
a reply to: TheRedneck
I was actually going to post about this and was thinking about it. The more urban areas that pop up the more heat islands we will have. Even if we do everything right, population growth necessitates temperature change in this way.
I was actually going to post about this and was thinking about it. The more urban areas that pop up the more heat islands we will have. Even if we do everything right, population growth necessitates temperature change in this way.
a reply to: TheRedneck
One of my biggest issues with the studies is how short the period of time is as far as data is concerned. I have a hard time seeing data covering anything less than at least a hundred thousand years, if not much more, as being significant or definitive and anything more than a guess. I'm not sure the fluctuation over a century or two is even meaningful at all.
One of my biggest issues with the studies is how short the period of time is as far as data is concerned. I have a hard time seeing data covering anything less than at least a hundred thousand years, if not much more, as being significant or definitive and anything more than a guess. I'm not sure the fluctuation over a century or two is even meaningful at all.
TheRedneck, thank you for your analysis but it is methodologically flawed
1) A polynomial fit of degree higher or equal than 3 is very dangerous and should very rarely be used. With it you run the chance of overfitting due to the turbulent nature of the higher degree polynomial curves. Furthermore, extrapolating to later dates and saying there is a decrease after a certain time, is completely unfounded and should never be done, unless there is a theoretical model supporting the curve fit. There is no statistical reason to claim a 90-year oscillation.
2) There is significant correlation in your data. This already invalidates any curve fit you do, even the linear one. The data you presented is a time series and should be treated as a time series, which means specialized methods. A correlogram should at the very least be presented to see how far the correlations go in time.
3) You have dealt with the missing data problem by a simple imputation. While I do not think it skews your result, you should simply not do this. There are better methods to deal with missing values. A curve fit like you did, for example, can usuallly deal with missing values most of the time without imputing them. If you do see the need to have a "complete" data set, then try multiple imputation next time.
edit on 2-12-2018 by
micromass because: (no reason given)
a reply to: OccamsRazor04
That is something that needs to be looked into more IMO. Cities are typically several degrees warmer than the surrounding countryside, simply because of all the asphalt and concrete. In addition, these things operate as heat sinks, absorbing heat during the day and releasing it at night. One issue is that it's almost impossible to know how much temperature difference is being generated by the heat island, because we really have nothing to compare the readings to.
TheRedneck
originally posted by: TheRedneck
I am glad to see that my results mirrored the results of others using their same time frame. That gives me confidence that my findings are representative of the global temperatures.
What kind of "others"?
If those "others" are people in a similar situation then they are not representative of the whole Earth, as most of the planet is not close to cities.
From what I have read, there are places with data going back something like 150 years, wouldn't they have noticed any 90 years cycle in those?
a reply to: Blaine91555
It depends on the nature of the cycles involved in the data. The shorter the cycles, the shorter the time span needed in order to adequately describe them. Weather is a very chaotic system, composed of numerous cycles, some of which change over time. Many of these cycles are quite long periods which mean longer time spans are required.
A good rule of thumb is to have at least three complete cycles. Anything less than one complete cycle is a complete guess (as my 90-year period is). In such cases one may be able to see indications of sinusoidal activity, but establishing the particulars is quite difficult. A hundred thousand years of data in this case is simply not feasible, but having shorter spans of data, as long as they are substantial, can still determine shorter period cycles.
An FFT analysis will also assist in determining those cycles which can be partially seen but not quantified by other methods.
TheRedneck
a reply to: TheRedneck
Thanks. I had to look up FFT to understand it but it makes sense to me that would be helpful.
Thanks. I had to look up FFT to understand it but it makes sense to me that would be helpful.
a reply to: TheRedneck
I figured you had somehow taken it into account since you'd been thorough about so much else, but I had to ask.
Our local weather guy does his weather blog, and he posted the months of the past year (minus December of course) and where they rated. November was the coldest November we've ever had, but we had a couple months that were in the top five for average warmth, but then again, we also had a couple other months that were also in the top four or five for average cold not counting November. His final conclusion is that we're trending to be in the top 30 warmest years on average.
But out of 130 years on record, how impressive is that? Warm, but not devastatingly so. He was more interested in all the wild swings from record cold to record warm.
a reply to: micromass
1) A polynomial curve of degree 3 or lower cannot describe cyclical behavior, which we know from experience exists in weather systems. The best and most familiar example of such cyclical behavior is the seasons. A 4th degree polynomial can describe the continuous sinusoidal curve of the seasons fairly well, but anything lower cannot. A third degree curve will always provide an extension that indicates a runaway system; a second degree more so.
I think you misinterpret my mention of the 90-year cycle. That is a complete guess and I have stated so many times in this thread. The actual period cannot be ascertained by the data as presented without further analysis. I can state that the curve appears to be a portion of a sinusoidal curve. Even that is not 100%, but I believe it to be a reasonable interpretation of the results.
In any analysis, the goal is always predictive. Knowing what the temperature was yesterday is easy; knowing what it will likely be tomorrow is much more difficult. All of the climate models exist for the sole purpose of predicting future behavior from past behavior, and their veracity is not assured until such time as they have successfully done so. In this case, some predictive indicators need to be stated so the analysis can be either validated or invalidated depending on future events. If we continue to see rising temperatures for the next ten years, that will invalidate my interpretation of the results; if we see a slowing of temperature rises and then a slow dropping of temperatures, that will validate my analysis and lend credence to future predictions. I do not predict a 90-year cycle; I predict a cycle peaking within the next decade or so.
2) An autocorrelation would be helpful, but at the moment I do not have good access to the computer that handles all of the higher mathematical functions (MatLab). In the interest of getting the data out, I went ahead and published the analysis minus the higher math functions. As I stated, my intention is to soon continue the analysis using FFT methodology, which will give the same data. Any randomness will manifest itself as white noise in the system, while cycles will show as a higher peak.
There is also a dynamic FFT analysis that will provide insight into deviations in frequency that are happening through time. That will be more useful than an autocorrelation, as it can be analyzed with smaller portions of the dataset. The smaller sections will cause more uncertainty than a longer section, but even with that uncertainty any deviation in cyclic frequency or amplitude will be evident.
3) I used mean inputation. Multiple inputation is indicated when the dataset is discontinuous. Temperature readings are continuous by their very nature, and thus the difference between multiple inputation and mean inputation is negligible. As an example for other readers, mean inputation means I make the assumption that the missing data will be close to the average of all data surrounding the missing data. For example, the data from July 1985 was missing; in it's place, I used the average (mean) of the months of July for 1980, 1981, 1982, 1983, 1984, 1986, 1987, 1988, 1989, and 1990. While it is possible that July 1985 was exceptionally hot or cold, the likelihood is that July1985 was close to that average.
Luckily, there were no missing sections of data where the months averaged were missing as well. That would have required numerical methods in order to achieve a reasonable approximation of the missing data. To use the above example, numerical methods would have been needed had July 1981 been missing as well.
A similar result was used for missing single days. By adjusting the number of days in the month to reflect that the sums used were not inclusive of the total number of days, the averages were maintained. The calculation inside Excel includes a separate column for the number of days in each month instead of hardcoding it into the equations. This allows me to adjust for missing days. As above, it might e possible that a missing day was exceptionally hot or cold, but the likelihood is that it was at least close to the average for that month.
TheRedneck
a reply to: ArMaP
Using the same time periods, my results mirrored those of organizations like the IPCC, NASA, and NOAA using 1960 as a beginning point. The extension into 1950 instead of 1960 is where we diverge based on the extra decade of data.
I will point out that even had I been referencing similar single-city studies, enough of those would equate to a global study.
TheRedneck
What kind of "others"?
Using the same time periods, my results mirrored those of organizations like the IPCC, NASA, and NOAA using 1960 as a beginning point. The extension into 1950 instead of 1960 is where we diverge based on the extra decade of data.
I will point out that even had I been referencing similar single-city studies, enough of those would equate to a global study.
TheRedneck
a reply to: Blaine91555
I guess I should have mentioned exactly what FFT is for those who are not versed in it.
A Fourier Transform is a mathematical method of inputting time-based data and retrieving frequency-based information. For example, if one took the equation for a 60-Hz sine wave, x=A sin(120*pi*t), with x being amplitude and t being time, and input it into a Fourier Transform, the resulting answer would be 60... the frequency. The FFT is simply a numerical method for computers to use that gives the same result as a Fourier Transform, since computers have difficulty handling complex numbers and especially complex exponents.
A single value like above is rare. A typical FFT will give a graph that shows a wide range of frequencies contained in the data set, with each frequency line having an amplitude that indicates how prevalent the corresponding frequency is.
A dynamic FFT is similar, but instead of looking at the entire dataset, it breaks it down into smaller overlapping segments. The result shows the FFT as it changes over time. Voice recognition technology uses something similar to a dynamic FFT to recognize words.
TheRedneck
a reply to: TheRedneck
Yeah, there's no Global Warming, and as far as climate change...the climate changes all the time and always has. Those fires in California are being started on purpose to relocate for agenda 21 and Global Warming is nothing but another scare tactic to eventually charge us all carbon taxes. The elites destroyed the world with their world wars, opium and drug wars, and spraying the skies with all that poisonous garbage, possibly to screen the sky so that the sun's heat would actually get trapped underneath those clouds of metallic particles, thus creating a greenhouse effect....which would definitely fool any clueless Liberal...but it doesn't fool me. The elites destroyed the earth and made the mess, withheld gravitic and Tesla technologies from us to keep pushing and charging us for oil and gas, and now they know they have to clean it up. What better way to do that than to charge us yet another tax to clean it all up. Liberals will fall for this crap, not only because they are idiots that believe everything CNN and the Government tells them, but also because it will give them another feeling of moral superiority over those who know what's really going on. Liberals are really to blame because it's their faith in the Mainstream Media and the Government, that has allowed them to get away with it all. The Liberals have even funded and helped them to do it, every step of the way.
Yeah, there's no Global Warming, and as far as climate change...the climate changes all the time and always has. Those fires in California are being started on purpose to relocate for agenda 21 and Global Warming is nothing but another scare tactic to eventually charge us all carbon taxes. The elites destroyed the world with their world wars, opium and drug wars, and spraying the skies with all that poisonous garbage, possibly to screen the sky so that the sun's heat would actually get trapped underneath those clouds of metallic particles, thus creating a greenhouse effect....which would definitely fool any clueless Liberal...but it doesn't fool me. The elites destroyed the earth and made the mess, withheld gravitic and Tesla technologies from us to keep pushing and charging us for oil and gas, and now they know they have to clean it up. What better way to do that than to charge us yet another tax to clean it all up. Liberals will fall for this crap, not only because they are idiots that believe everything CNN and the Government tells them, but also because it will give them another feeling of moral superiority over those who know what's really going on. Liberals are really to blame because it's their faith in the Mainstream Media and the Government, that has allowed them to get away with it all. The Liberals have even funded and helped them to do it, every step of the way.
a reply to: ketsuko
If my analysis is correct, it's not very surprising. I would expect temperatures to remain high and perhaps rise a little more as we near the crest. Once we pass the crest, I expect the opposite: either steady or slowly falling average temperatures.
That's not to say there won't be cold months; there will. I am talking about average annual temperatures.
TheRedneck
new topics
-
This is our Story
General Entertainment: 1 hours ago -
President BIDEN Vows to Make Americans Pay More Federal Taxes in 2025 - Political Suicide.
2024 Elections: 4 hours ago -
Ode to Artemis
General Chit Chat: 4 hours ago -
Ditching physical money
History: 8 hours ago -
One Flame Throwing Robot Dog for Christmas Please!
Weaponry: 8 hours ago -
Don't take advantage of people just because it seems easy it will backfire
Rant: 8 hours ago -
VirginOfGrand says hello
Introductions: 9 hours ago -
Should Biden Replace Harris With AOC On the 2024 Democrat Ticket?
2024 Elections: 10 hours ago
top topics
-
University student disciplined after saying veganism is wrong and gender fluidity is stupid
Education and Media: 12 hours ago, 12 flags -
Police clash with St George’s Day protesters at central London rally
Social Issues and Civil Unrest: 15 hours ago, 9 flags -
President BIDEN Vows to Make Americans Pay More Federal Taxes in 2025 - Political Suicide.
2024 Elections: 4 hours ago, 8 flags -
TLDR post about ATS and why I love it and hope we all stay together somewhere
General Chit Chat: 16 hours ago, 7 flags -
Should Biden Replace Harris With AOC On the 2024 Democrat Ticket?
2024 Elections: 10 hours ago, 6 flags -
Don't take advantage of people just because it seems easy it will backfire
Rant: 8 hours ago, 4 flags -
One Flame Throwing Robot Dog for Christmas Please!
Weaponry: 8 hours ago, 4 flags -
God lived as a Devil Dog.
Short Stories: 14 hours ago, 3 flags -
Ditching physical money
History: 8 hours ago, 3 flags -
VirginOfGrand says hello
Introductions: 9 hours ago, 2 flags
active topics
-
Terrifying Encounters With The Black Eyed Kids
Paranormal Studies • 70 • : burritocat -
Tucker Carlson UFOs are piloted by spiritual entities with bases under the ocean and the ground
Aliens and UFOs • 42 • : Jukiodone -
The Fight for Election Integrity Continues -- Audits, Criminal Investigations, Legislative Reform
2024 Elections • 4143 • : Station27 -
-@TH3WH17ERABB17- -Q- ---TIME TO SHOW THE WORLD--- -Part- --44--
Dissecting Disinformation • 636 • : F2d5thCavv2 -
Russia Ukraine Update Thread - part 3
World War Three • 5719 • : F2d5thCavv2 -
Who guards the guards
US Political Madness • 5 • : 19Bones79 -
One Flame Throwing Robot Dog for Christmas Please!
Weaponry • 6 • : BeTheGoddess2 -
Police clash with St George’s Day protesters at central London rally
Social Issues and Civil Unrest • 37 • : SprocketUK -
New whistleblower Jason Sands speaks on Twitter Spaces last night.
Aliens and UFOs • 48 • : baablacksheep1 -
Hate makes for strange bedfellows
US Political Madness • 40 • : 19Bones79