It looks like you're using an Ad Blocker.
Please white-list or disable AboveTopSecret.com in your ad-blocking tool.
Thank you.
Some features of ATS will be disabled while you continue to use an ad-blocker.

Ocean Warming Fearmongering Based on "Math Error." AGW Again Reeks of Hoax
page: 3share:
a reply to: Phage
Indeed, so much so the Sun is probably the single greatest driver of temperatures on the surface of Earth.
I don't really know how increasing CO2 levels changes that number and I don't really think scientists do either. I posted a doco a few months ago where scientists were discussing the flaws in the theory behind CO2 driven temperatures and how the predictions of that theory have constantly failed to match observations.
The article you link to is quite interesting, they say that it's "not just greenhouse gases added to the air, but also the impact of deforestation, which changes the reflectivity of the surface". Yet recent reports have shown that increased carbon dioxide levels have actually caused a global greening effect, since CO2 is a food for trees and plants they also act as a natural CO2 recycling mechanism.
The article you linked to also stated that "bright aerosols (like sulfates from coal-burning) are a cooling mechanism, whereas dark aerosols (like black carbon from diesel exhausts) lead to warming", which creates very complex processes which involve a high degree of uncertainty, which leads to the final answer they provide having a rather large range of uncertainty. Also this seems like quite a contradictory argument considering that we know increased levels of pollution causes more light to be reflected into space and creates a dimming effect.
This is then used as an argument for why we haven't seen as much heating as predicted by the greenhouse effect, and they say that once we cleanse the atmosphere of reflective aerosols we will see the global warming which was predicted, which is also quite a paradox if we want to avoid global warming. However according to our models and measurements the CO2 level has been 10x higher than now millions of years ago, it was around 50x higher 400 to 500 million years ago. Yet our models and measurements suggest the global temperature has not changed by any substantial fraction over the last 500 million years, we have seen a fluctuation between ice ages and warmer periods.
How much power does the Sun provide in comparison to the power produced by humans? Lots more, right?
Indeed, so much so the Sun is probably the single greatest driver of temperatures on the surface of Earth.
Now, how much of that power escapes back into space and how much is retained? How much does the increasing amount of CO2 (and associated feedback) change that number?
I don't really know how increasing CO2 levels changes that number and I don't really think scientists do either. I posted a doco a few months ago where scientists were discussing the flaws in the theory behind CO2 driven temperatures and how the predictions of that theory have constantly failed to match observations.
The article you link to is quite interesting, they say that it's "not just greenhouse gases added to the air, but also the impact of deforestation, which changes the reflectivity of the surface". Yet recent reports have shown that increased carbon dioxide levels have actually caused a global greening effect, since CO2 is a food for trees and plants they also act as a natural CO2 recycling mechanism.
Carbon Dioxide Fertilization Greening Earth, Study Finds
From a quarter to half of Earth’s vegetated lands has shown significant greening over the last 35 years largely due to rising levels of atmospheric carbon dioxide, according to a new study published in the journal Nature Climate Change on April 25.
An international team of 32 authors from 24 institutions in eight countries led the effort, which involved using satellite data from NASA’s Moderate Resolution Imaging Spectrometer and the National Oceanic and Atmospheric Administration’s Advanced Very High Resolution Radiometer instruments to help determine the leaf area index, or amount of leaf cover, over the planet’s vegetated regions. The greening represents an increase in leaves on plants and trees equivalent in area to two times the continental United States.
www.nasa.gov...
The article you linked to also stated that "bright aerosols (like sulfates from coal-burning) are a cooling mechanism, whereas dark aerosols (like black carbon from diesel exhausts) lead to warming", which creates very complex processes which involve a high degree of uncertainty, which leads to the final answer they provide having a rather large range of uncertainty. Also this seems like quite a contradictory argument considering that we know increased levels of pollution causes more light to be reflected into space and creates a dimming effect.
Measurements from the 1960s to the early 1990s, backed up by a wide range of data and a number of independent studies, showed there were substantial declines in the amount of the sun's energy reaching the Earth's surface. This reduction is known as "global dimming".
The observed "dimming" has strong regional differences across the globe. While the southern hemisphere saw modest dimming in the period 1961–90 (which has continued to date), the northern hemisphere saw much more significant declines (reductions of 4–8%). Since then some parts of the world, such as Europe and North America, have seen partial recovery (known as "brightening"), while other regions (most notably China and India) have seen further although regionally mixed declines.
Global dimming is not thought to be due to changes in the sun's luminosity, as these have been too small to explain the magnitude of dimming observed. Instead, air pollution from human activity is thought to be the major contributor. Aerosols which form from pollution can directly reflect and absorb radiation before it reaches the planet's surface and make clouds brighter and longer lasting, meaning they reflect more sunlight.
www.theguardian.com...
This is then used as an argument for why we haven't seen as much heating as predicted by the greenhouse effect, and they say that once we cleanse the atmosphere of reflective aerosols we will see the global warming which was predicted, which is also quite a paradox if we want to avoid global warming. However according to our models and measurements the CO2 level has been 10x higher than now millions of years ago, it was around 50x higher 400 to 500 million years ago. Yet our models and measurements suggest the global temperature has not changed by any substantial fraction over the last 500 million years, we have seen a fluctuation between ice ages and warmer periods.
Global dimming has been artificially suppressing global warming. The same thing that has been causing global warming — burning fossil fuels as if they are inexhaustible fairy farts that produce nothing but rainbows — has been causing global dimming for the most part. Once the generation and transportation industries stop pumping pollution and CO2 into the air, the dimming problem will go away pretty quickly, but the CO2 will linger for a couple of hundred years. That means that sunlight which currently isn’t getting to the ground, being reflected as infrared and being absorbed by excess CO2 today, will be tomorrow. That means that the temperature inhibitor of dimming will be removed and it will get potentially a degree or two warmer.
www.forbes.com...
edit on 17/11/2018 by ChaoticOrder because: (no reason
given)
a reply to: ChaoticOrder
www.carbonbrief.org...
Obviously.
Indeed, so much so the Sun is probably the single greatest driver of temperatures on the surface of Earth.
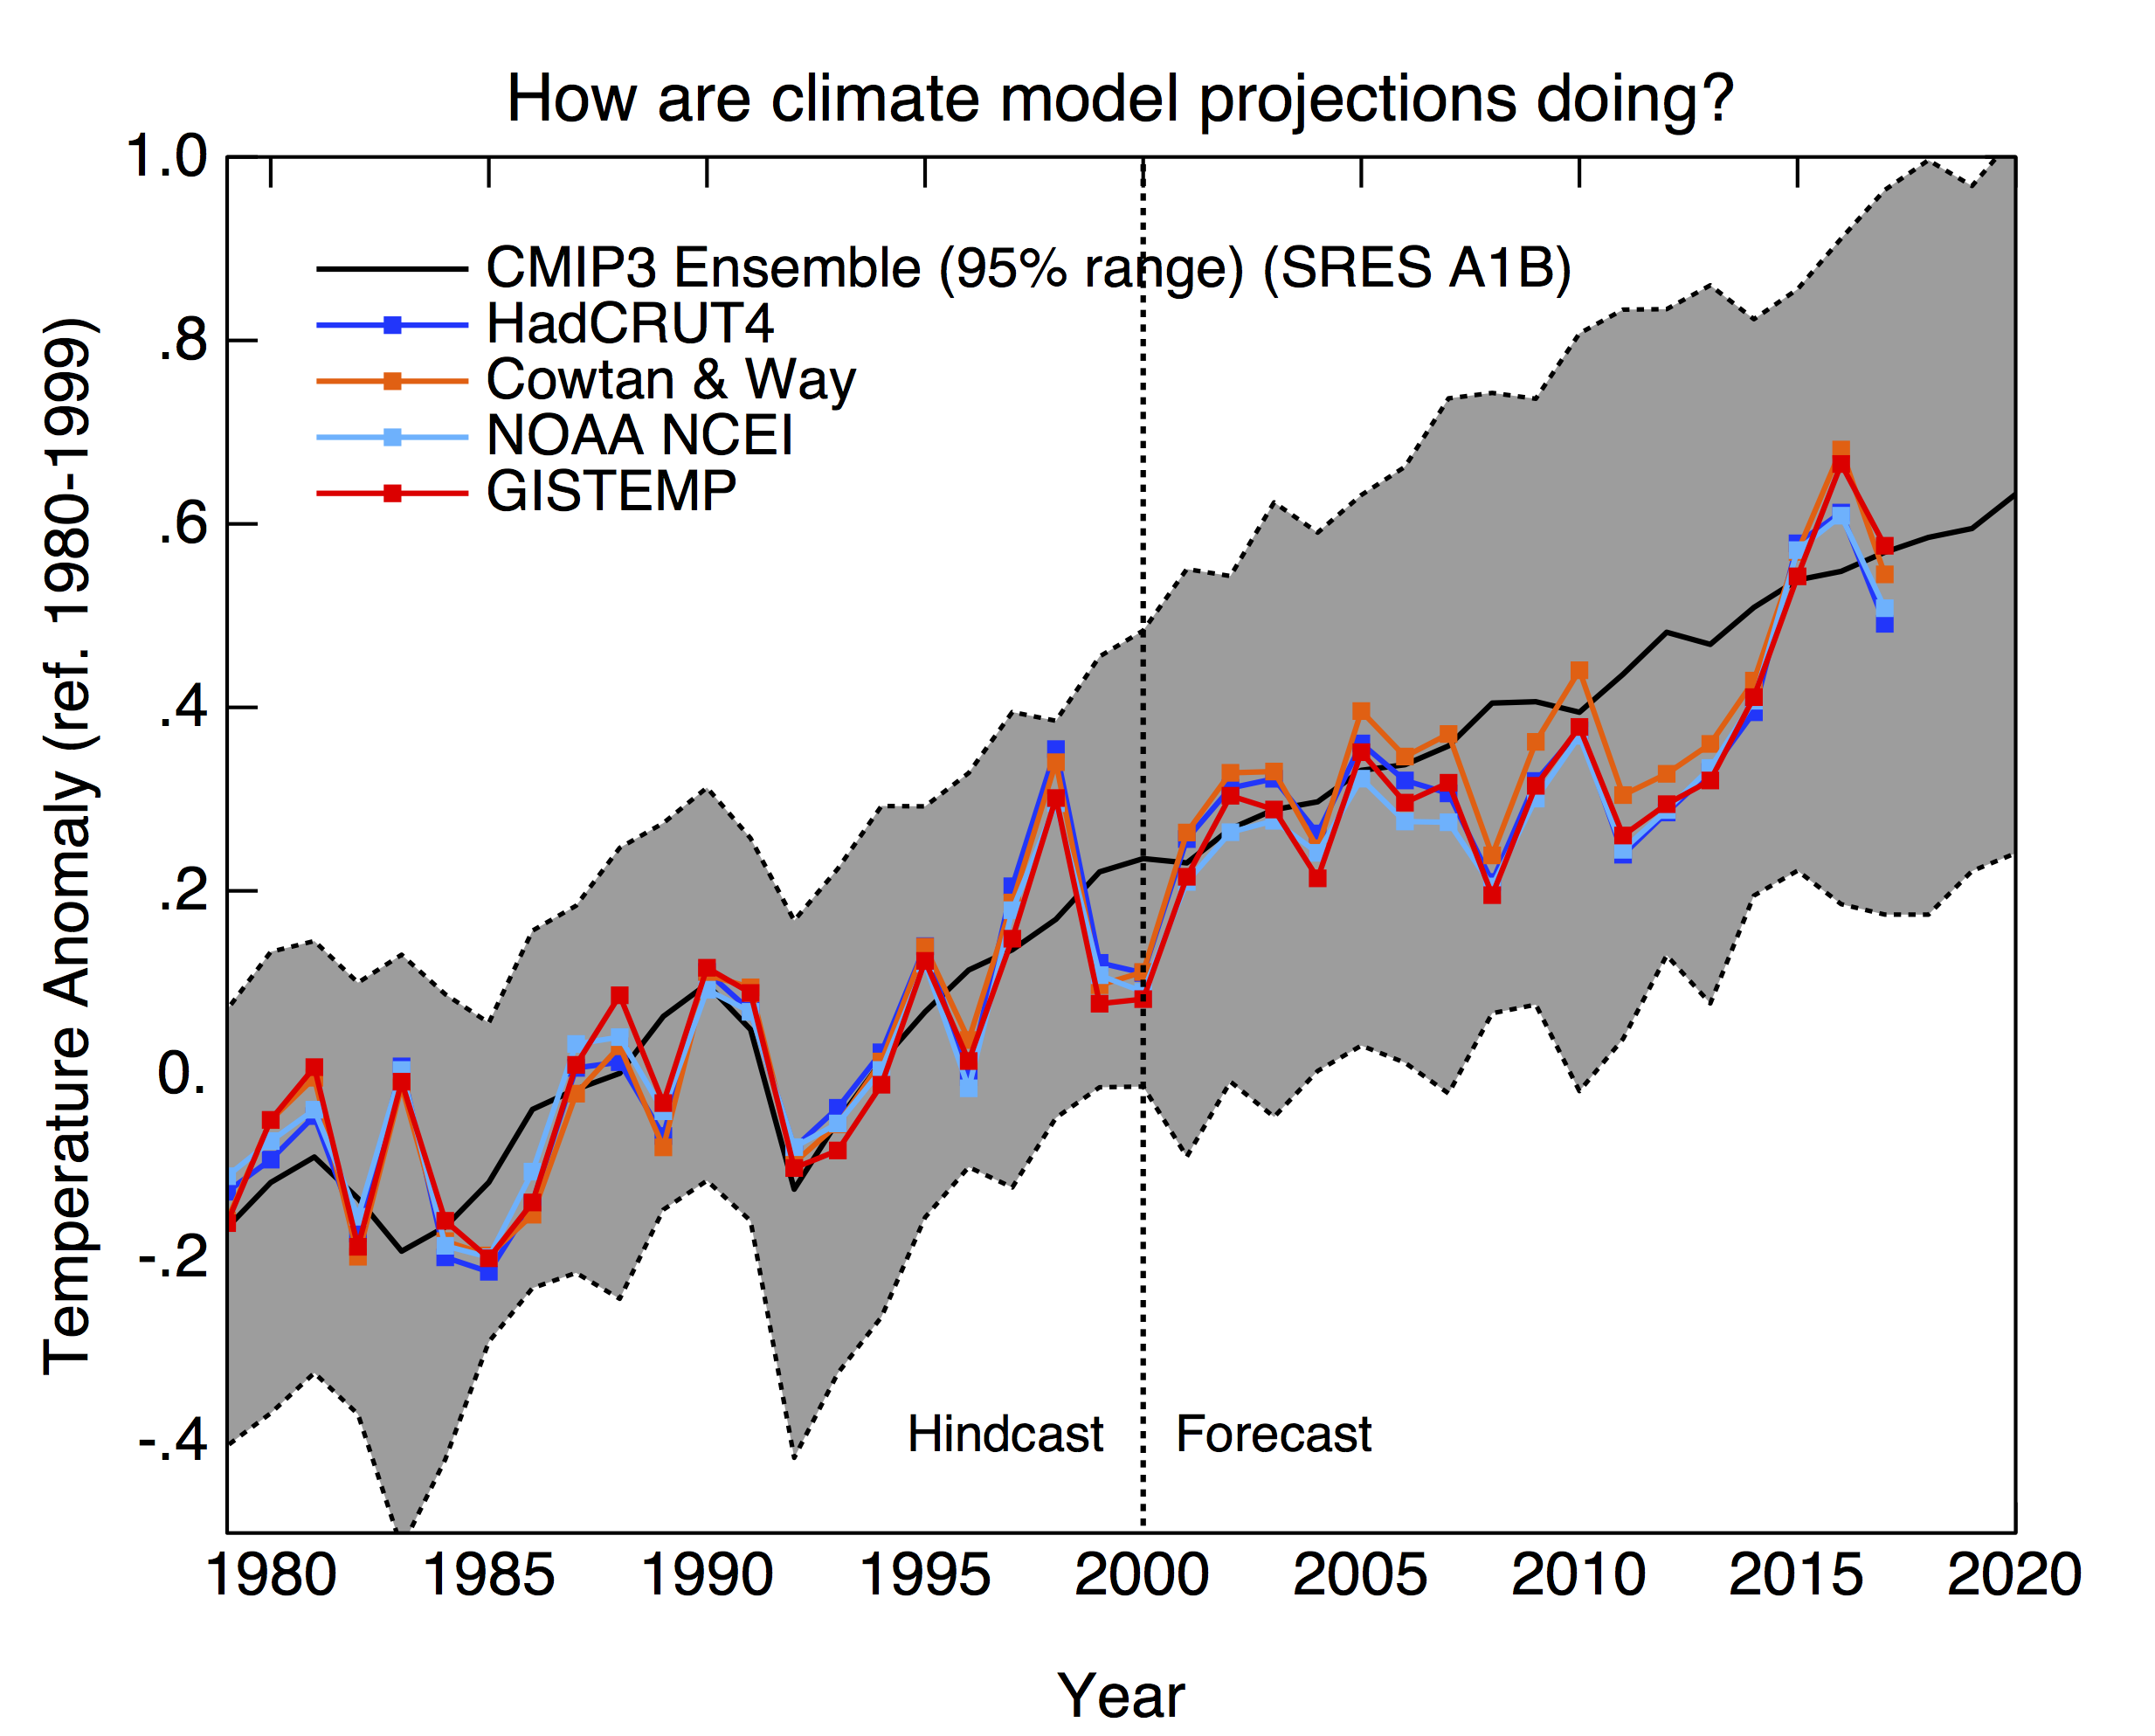
Except, they don't fail to do so. (That documentary is from 2007, maybe you should find something more up to date. And maybe something that doesn't cherry pick the models but looks at all of them.) The planet is warming at a rate consistent with most models.
I posted a doco a few months ago where scientists were discussing the flaws in the theory behind CO2 driven temperatures and how the predictions of that theory have constantly failed to match observations.
www.carbonbrief.org...
And yet, temperatures continue to rise.
The greening represents an increase in leaves on plants and trees equivalent in area to two times the continental United States.
Not contradictory at all. But the trouble is, particulate pollution is quite unhealthy and is therefore quite undesirable..
Also this seems like quite a contradictory argument considering that we know increased levels of pollution causes more light to be reflected into space and creates a dimming effect.
We are seeing that warming (see above).
This is then used as an argument for why we haven't seen as much heating as predicted by the greenhouse effect, and they say that once we cleanse the atmosphere of reflective aerosols we will see the global warming which was predicted,
edit on 11/17/2018 by Phage because: (no reason given)
originally posted by: Phage
a reply to: ChaoticOrder
The planet is warming at a rate consistent with most models.
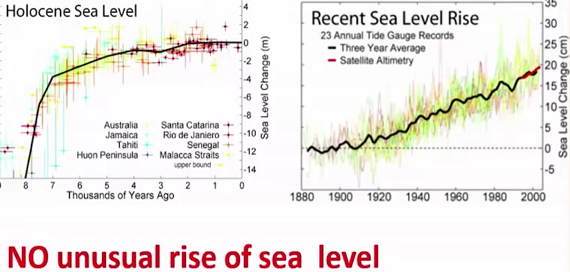
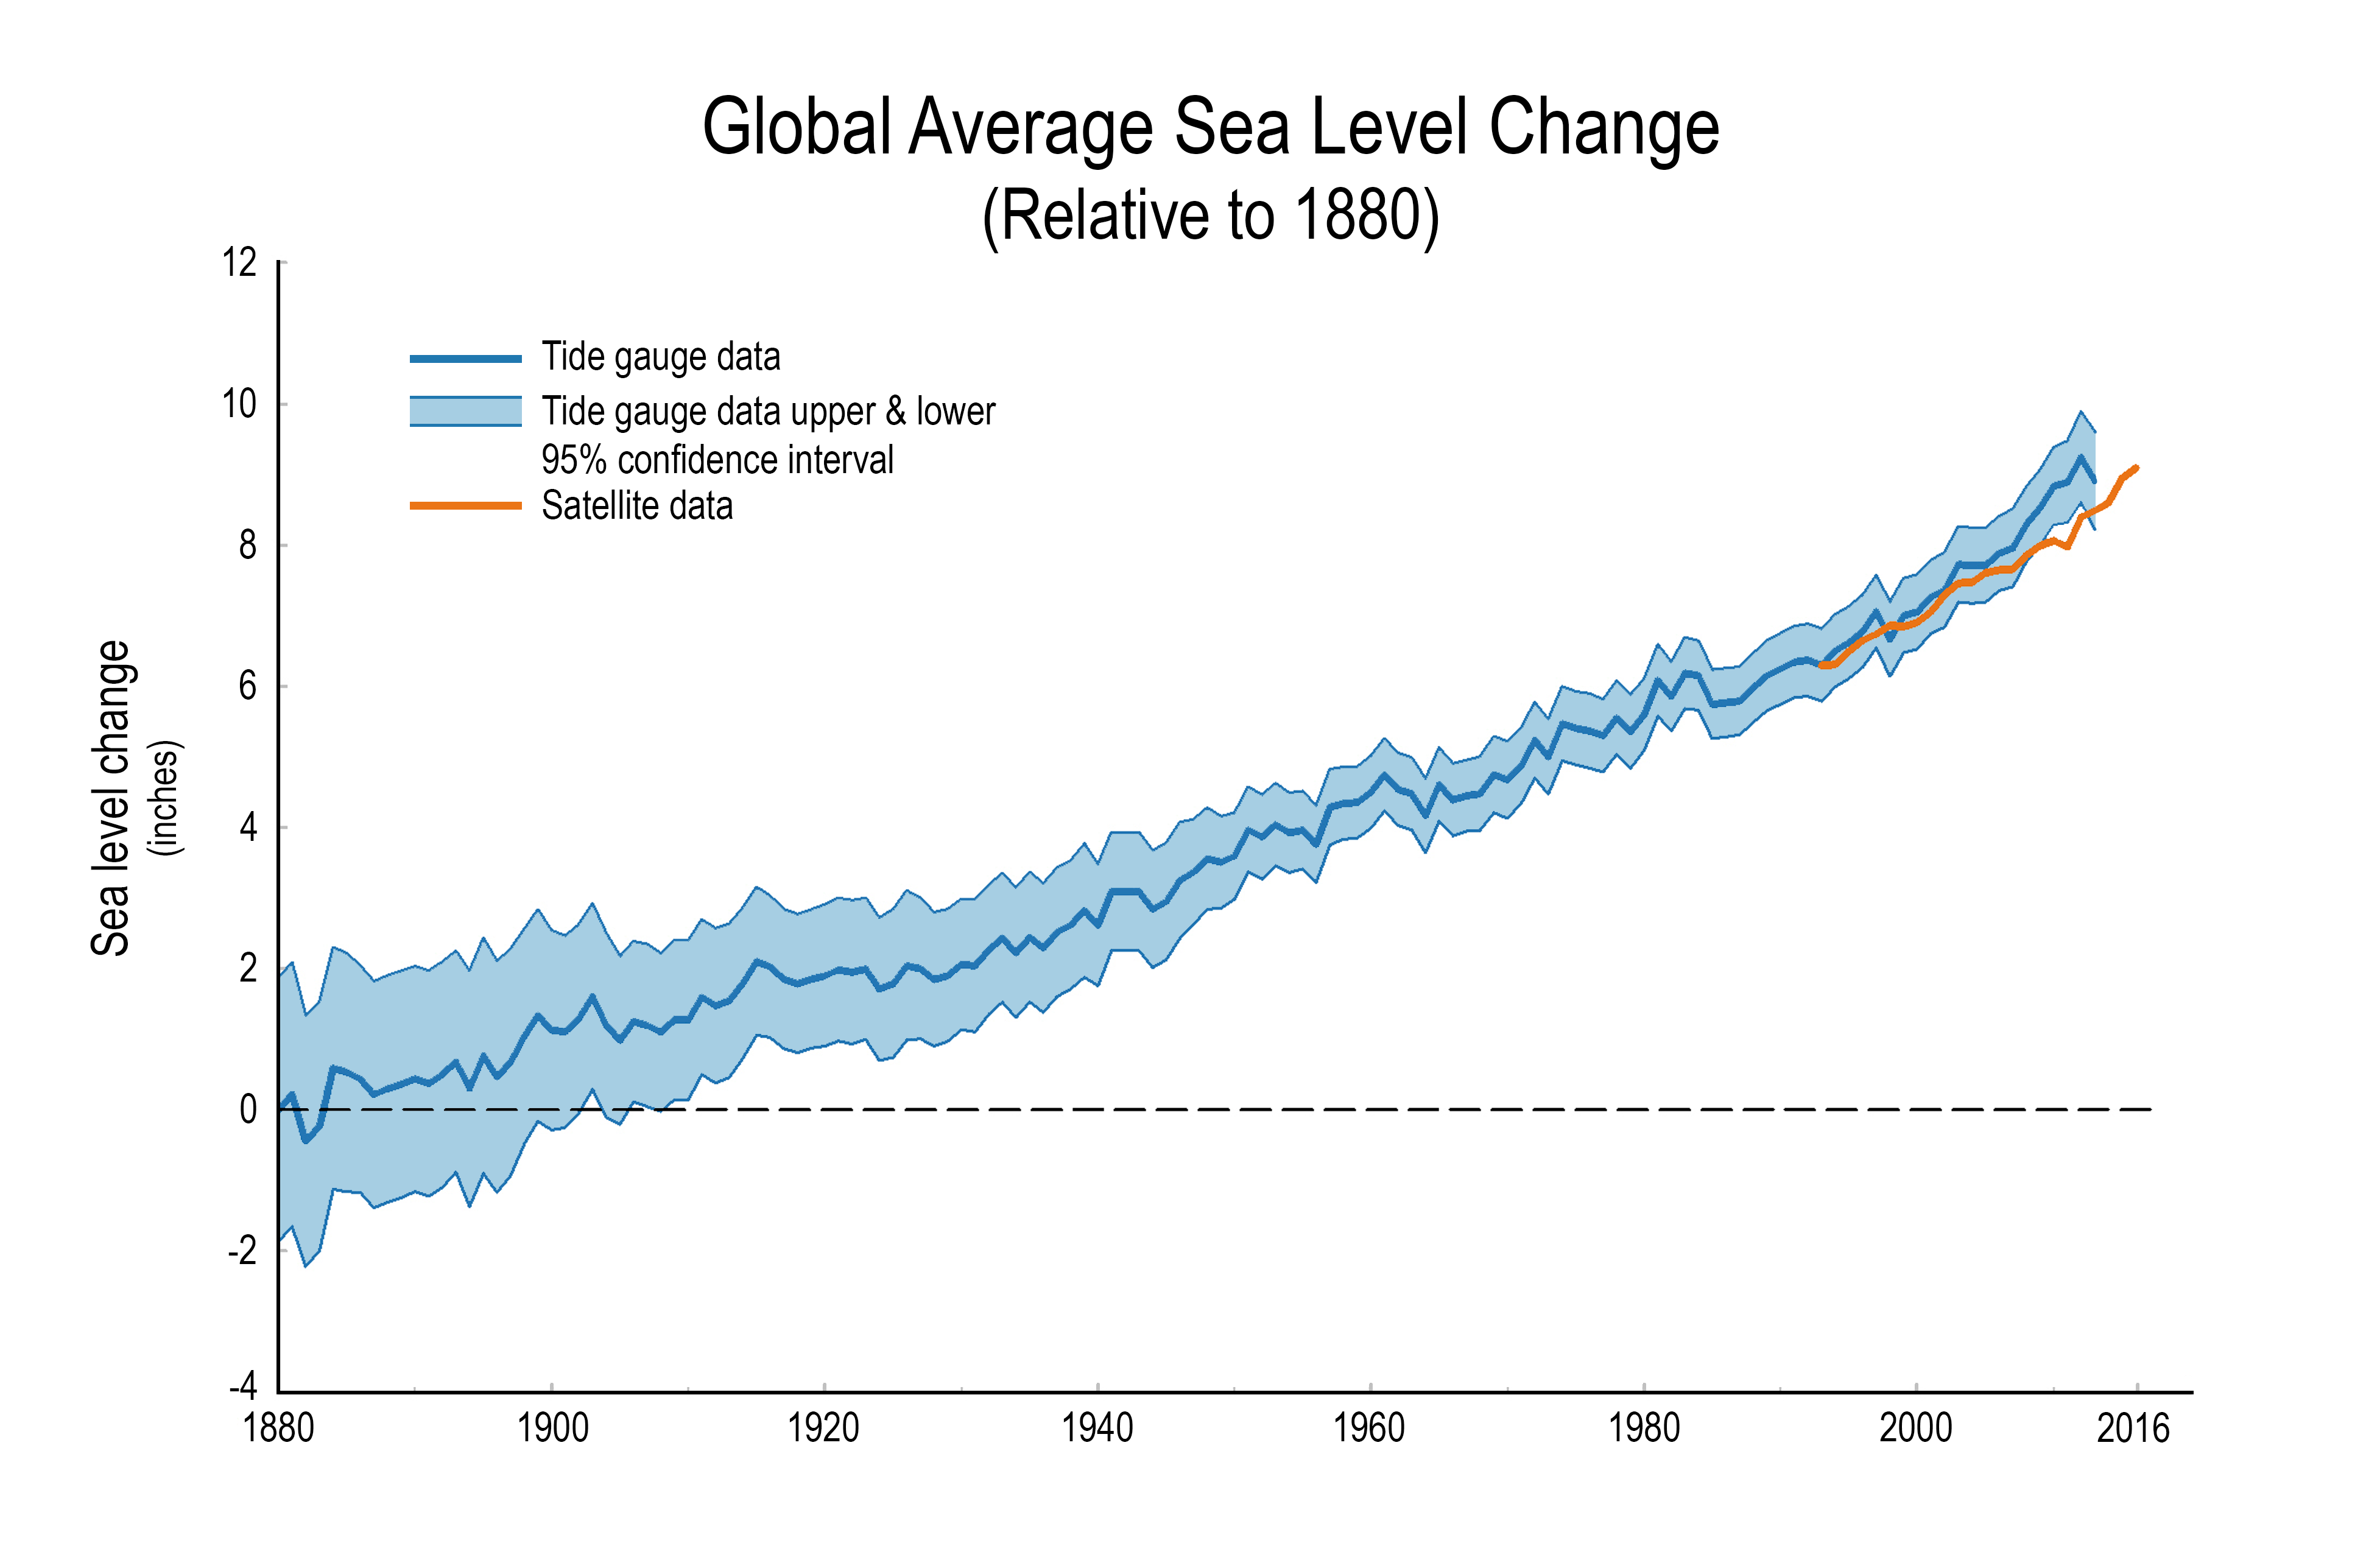
Yes but only if we include the ocean temps, land temps alone are usually rather stable over long periods of time. My main concern with that approach is we know that the sea level has been rising for thousands of years and we also know that we have been coming out of a mini-ice-age for the last few hundred years, so it would seem quite the leap to conclude all the warming of the ocean must be due to increased CO2 levels, yet we cannot show a clear correlation between temperature and high CO2 levels in the past.
This chart is from the lecture I posted on the last page:
This chart shows Texas temps going back to 1900:

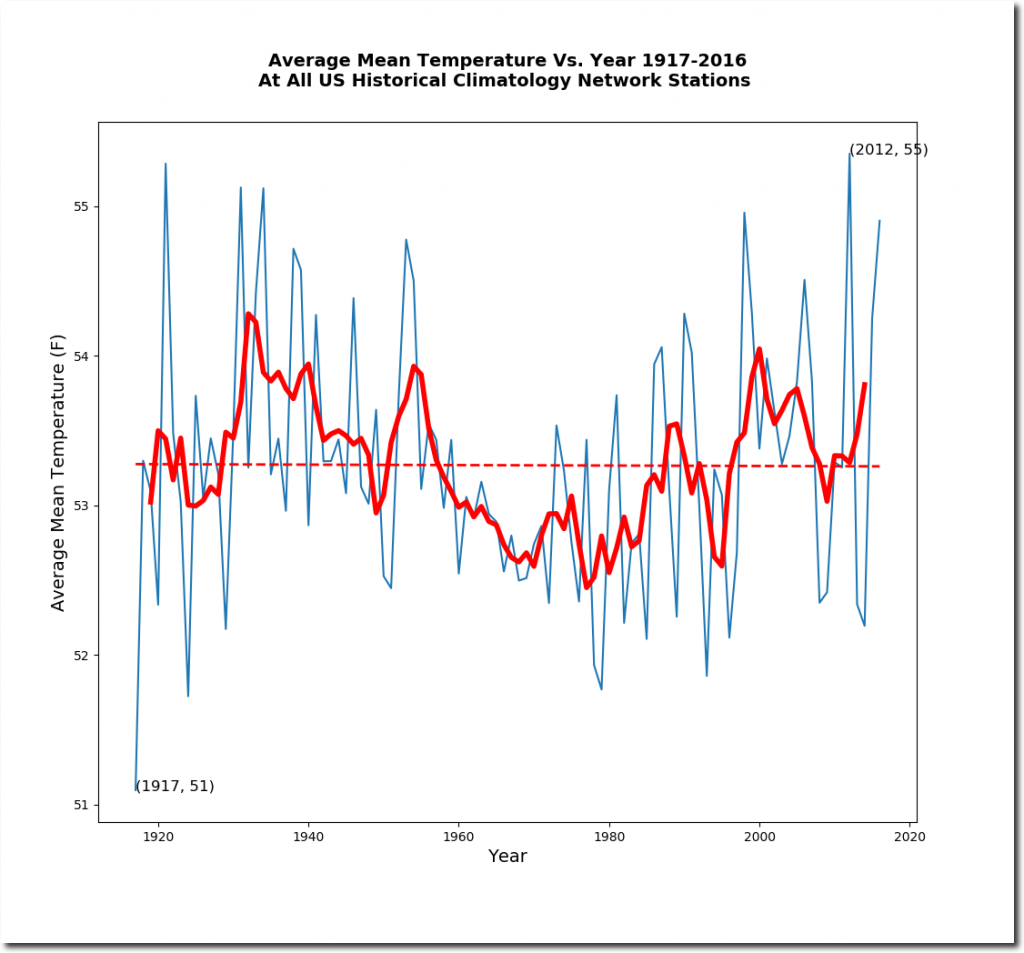
This shows the avg mean temp measured by all USHCN stations:
This chart from the EPA shows U.S. Annual Heat Wave Index for 1895–2015:

Another EPA chart showing U.S. Average Drought Conditions for 1895–2015:

And a chart showing past interglacial temps based on ice core samples:
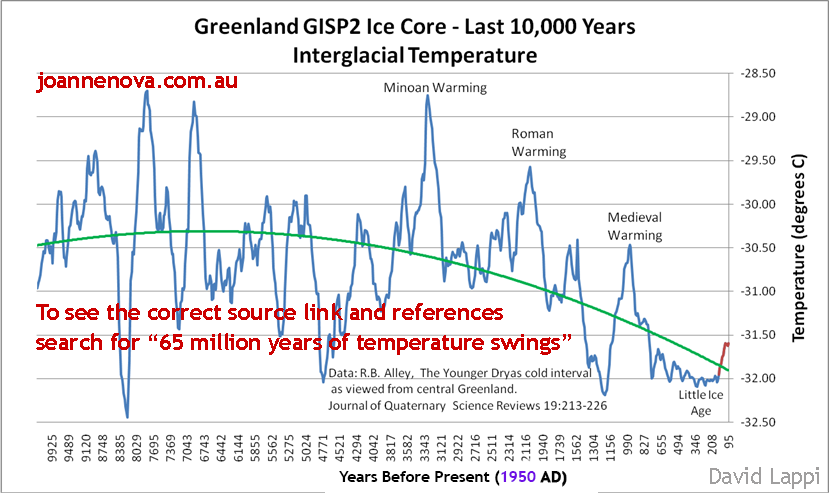
Our current warming is well within natural variation, and in view of the general decline in temperatures during the last half of this interglacial, is probably beneficial for mankind and most plants and animals. The graph clearly shows the Minoan Warming (about 3200 years ago), the Roman Warming (about 2000 years ago), and the Medieval Warm Period (about 900 years ago). Great advances in government, art, architecture, and science were made during these warmer times.
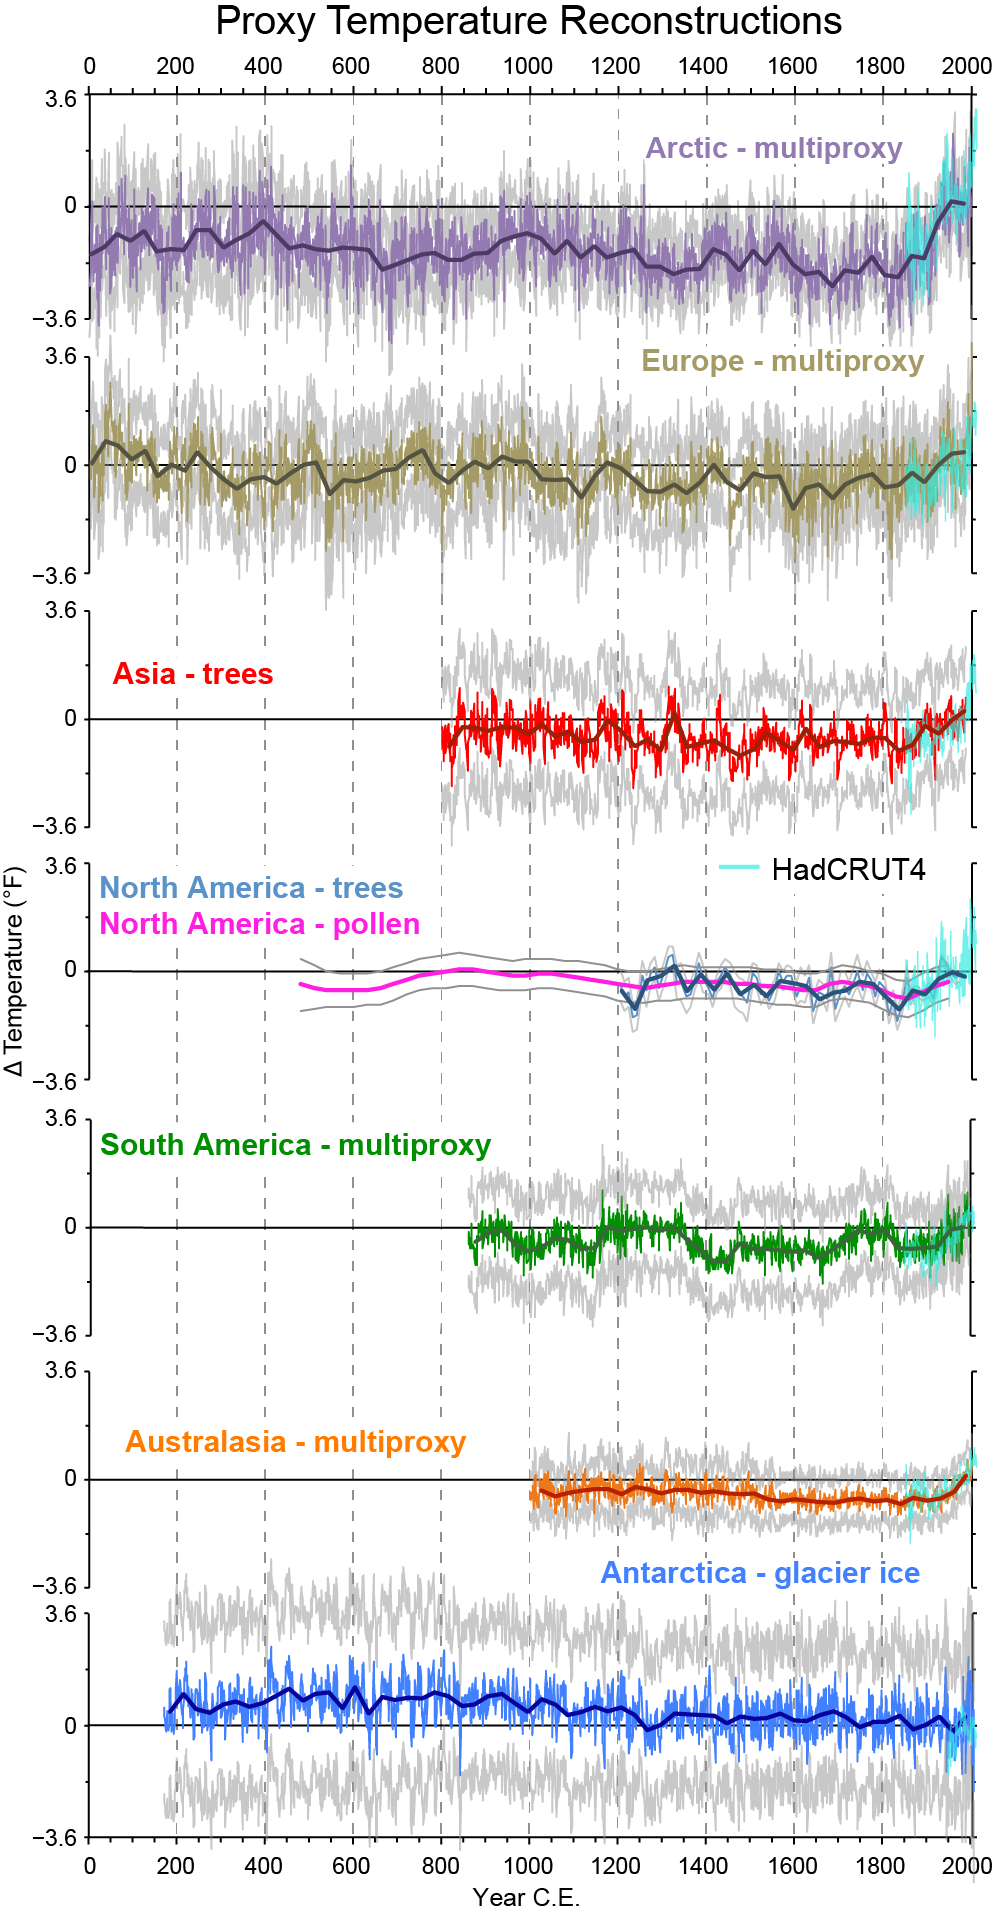
More concretely, this chart was created using 30 different datasets to estimate temps going back 2000 years, clearly showing temps have been just as high or even higher in Medieval and Roman times, before we started pumping out large amounts of CO2 into the atmosphere.

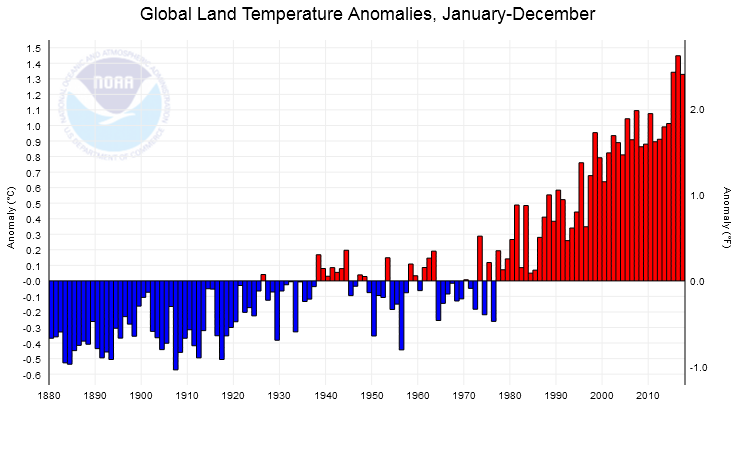
We've seen something like a 0.8°C rise in average global temps since 1900, that doesn't seem abnormal to me based on the trends shown in these charts, in fact it seems rather stable to me, and I'm not even convinced we are capable of measuring the global average temperature with a high enough degree of accuracy to bring the uncertainty down to a fraction of a degree, especially when we start combining the ocean temps with the land data because the oceans are so large and the number of land based devices is vastly higher.
Sources:
www.epa.gov...
www.epa.gov...
realclimatescience.com...
wattsupwiththat.com...
joannenova.com.au...
thetruthpeddler.wordpress.com...
edit on 18/11/2018 by ChaoticOrder
because: (no reason given)
a reply to: ChaoticOrder
And everything in that video makes perfect scientific sense and totally destroys their narrative.
I'd go so far to say that it redefines the issue to be "our cities are warmer because we build with concrete and asphalt thus affecting the local weather patterns".
And everything in that video makes perfect scientific sense and totally destroys their narrative.
I'd go so far to say that it redefines the issue to be "our cities are warmer because we build with concrete and asphalt thus affecting the local weather patterns".
Get the headline out and scare people. Later retractions don't matter much, people still believe. That's the sad point about how propaganda operates
even if later we find out different (something far too common)
a reply to: ChaoticOrder
Your gish galloping is a bit much. Don't you think?
www.sciencedaily.com...
www.glaciologia.cl...
Your gish galloping is a bit much. Don't you think?
Incorrect.
Yes but only if we include the ocean temps, land temps alone are usually rather stable over long periods of time.
Looks like it's been steepening lately. But sea level is a tricky thing to measure.
This chart is from the lecture I posted on the last page:
www.sciencedaily.com...
Datasets that go back 2000 years. No. But there are reconstructions using proxies. Here are the results of a more current and comprehensive effort.
More concretely, this chart was created using 30 different datasets to estimate temps going back 2000 years, clearly showing temps have been just as high or even higher in Medieval and Roman times, before we started pumping out large amounts of CO2 into the atmosphere.
There were no globally synchronous multi-decadal warm or cold intervals that define a worldwide Medieval Warm Period or Little Ice Age, but all reconstructions show generally cold conditions between ad 1580 and 1880, punctuated in some regions by warm decades during the eighteenth century. The transition to these colder conditions occurred earlier in the Arctic, Europe and Asia than in North America or the Southern Hemisphere regions. Recent warming reversed the long-term cooling; during the period ad 1971–2000, the area-weighted average reconstructed temperature was higher than any other time in nearly 1,400 years.
www.glaciologia.cl...
More than that.
We've seen something like a 0.8°C rise in average global temps since 1900
Sure. You can always say the data is bad.
and I'm not even convinced we are capable of measuring the global average temperature with a high enough degree of accuracy to bring the uncertainty down to a fraction of a degree
edit on 11/18/2018 by Phage because: (no reason given)
originally posted by: MisterMcKill
a reply to: Phage
Right. So there are lies, there are damned lies, and there are statistics. I know you have heard that one before. It applies here.
I'm not sure you're aware of how it applies.
originally posted by: Phage
a reply to: ChaoticOrder
Incorrect.
This looks almost exactly the same as the land-ocean anomaly charts, that seems odd considering that average land temperatures over time don't show that scary upward trend. Also, why do we not see the same trend when looking at the heat wave index or drought severity index, if it's really getting so much hotter on land why is it not obviously apparent in this data? It seems like almost every chart I come across plots the temp anomalies rather than the raw temp or average values over time. I will say we do seem to have more temperature anomalies, like a random hot day which comes out of no where, but overall I cannot say I believe that our summers in Australia are now warmer than a decade or two ago. The summer we are experiencing now seems to be one of the coolest we've had in years.
Another thing which concerns me is our rapid increase in the number of measuring stations around the world over the last few decades, meaning anomalies are easier to detect and they get reported more often, creating what looks like a sudden trend in the data, and I've seen this argument applied to actual data so it is statistically relevant. Also I would question how much of an effect particulates in the atmosphere have on these results, the article about global dimming from the Guardian states "areas that have undergone brightening have seen rapid warming", so a lot of these anomaly increases we're seeing since the 90's could be related to the U.S., Europe, and other developed nations reducing their levels of atmospheric pollution. It seems the developed world has actually kept CO2 emissions under control and the largest polluters are now China and the rest of the developing world:

Since 1980 CO2 emissions from the developed world have shown virtually no increase, whereas the developing world has had a fourfold increase since 1980.
The record of recent Man-made CO2 emissions: 1965 -2014
I'm not saying I think CO2 emissions or pollution in the atmosphere is a good thing, that is why I promote the use of nuclear, hydro, solar, and geo-thermal solutions. I absolutely believe China should heavily cut down on their emissions and they should get more criticism from the rest of the world. Instead we criticize Trump when he pulls out of a climate deal which is biased towards the U.S. and lenient towards the largest polluters such as China. However I also think it's unfair to tell the developing world they can't go through an industrial phase, those 160 developing nations are still only generating twice the emissions of the 27 developed nations.
Datasets that go back 2000 years. No. But there are reconstructions using proxies. Here are the results of a more current and comprehensive effort.
I clearly didn't say the dataset goes back 2000 years, I said they used 30 different datasets to make estimations going back 2000 years, similar to what they did in this more "comprehensive" effort. From what I can see the chart you presented still displays very similar warming and cooling trends, I can see the "down up down up" pattern. The temperature axis has been extended and so the resulting curve is more squished and the trends are less apparent, but you can still clearly see in the Europe multiproxy chart there are clear warm periods reaching temps just as high as today, the little ice age is also still quite apparent in those charts.
edit on 19/11/2018 by ChaoticOrder because: (no reason given)
a reply to: ChaoticOrder
In Europe. Not as hot as today. See the colored lines? In all regions? That's "today." In all regions.
The temperature axis has been extended and so the resulting curve is more squished and the trends are less apparent, but you can still clearly see in the Europe multiproxy chart there are clear warm periods reaching temps just as high as today, the little ice age is also still quite apparent in those charts.
edit on 11/19/2018 by Phage
because: (no reason given)
originally posted by: Phage
...
But do you ever wonder why "sources" like yours have to take statements grossly out of context? Do they think you won't notice?
Do you mean like you take statements from actual scientists completely out of context, and you proclaim the statements made by those scientists are wrong, and you even dare to change their statements when they disagree with your religious belief in AGW?...
edit on 19-11-2018 by ElectricUniverse because: add comment.
a reply to: burdman30ott6
Why don't you simply go get a job that has to do with some form of water, either ocean, lake, river or snow. Work there for sometime and share your results.
Why don't you simply go get a job that has to do with some form of water, either ocean, lake, river or snow. Work there for sometime and share your results.
a reply to: burdman30ott6
Ironically enough, our oceans have been warming a lot at depths that would take hundreds, if not thousands of years for the heat absorbed by the surface waters to reach the bottom layers of our oceans.
Return of 'ocean chimney' the size of Tasmania puzzles Antarctic scientists
Influence of a West Antarctic mantle plume on ice sheet basal conditions
Underwater volcanoes, not climate change, reason behind melting of West Antarctic Ice Sheet
Researchers find major West Antarctic glacier melting from geothermal sources
Influence of a West Antarctic mantle plume on ice sheet basal conditions
I remember another story about "oceans warming" and it was being blamed "yet again" on AGW, yet they were talking about the ocean down to ~2,000 feet or meters.(have to look for the thread) It's impossible for surface warming caused by atmospheric warming to reach to that depth in the oceans "recently." It takes hundreds to thousands of years for temperature in the surface of our oceans to reach down to those depths. In other words, that warming is not being caused by "AGW/mankind."
But then again, "the religious lunatics of a recent certain religion which is not based on science," would deny anything and everything that does not agree with their made up unscientific religion.
edit on 20-11-2018 by ElectricUniverse because: correct comment.
originally posted by: game over man
a reply to: burdman30ott6
Why don't you simply go get a job that has to do with some form of water, either ocean, lake, river or snow. Work there for sometime and share your results.
What in the world?... I guess the above is a logical argument according to "one of the bright minds in the AGW crowd..."
a reply to: Phage
Wait a second... That website " www.carbonbrief.org... " is authored by an "energy systems analyst and environmental economist" who has worked for energy companies... I thought we could not believe the word of these sort of people... Of course, unless "Phage" claims you can believe such people...right Phage?...
Wait a second... That website " www.carbonbrief.org... " is authored by an "energy systems analyst and environmental economist" who has worked for energy companies... I thought we could not believe the word of these sort of people... Of course, unless "Phage" claims you can believe such people...right Phage?...
More forecast that were made by the Alarmist : More fake news articles even today.. No wonder a certain percentage of people who are slightly informed
call B.S. on the IPCC and the scientist that need to keep their funding coming by producing fiddled numbers and blatant lies.
youtu.be...
new topics
-
Bobiverse
Fantasy & Science Fiction: 38 minutes ago -
Florida man's trip overseas ends in shock over $143,000 T-Mobile phone bill
Social Issues and Civil Unrest: 43 minutes ago -
Former Labour minister Frank Field dies aged 81
People: 2 hours ago -
SETI chief says US has no evidence for alien technology. 'And we never have'
Aliens and UFOs: 4 hours ago -
This is our Story
General Entertainment: 7 hours ago -
President BIDEN Vows to Make Americans Pay More Federal Taxes in 2025 - Political Suicide.
2024 Elections: 9 hours ago -
Ode to Artemis
General Chit Chat: 10 hours ago
top topics
-
President BIDEN Vows to Make Americans Pay More Federal Taxes in 2025 - Political Suicide.
2024 Elections: 9 hours ago, 13 flags -
Should Biden Replace Harris With AOC On the 2024 Democrat Ticket?
2024 Elections: 15 hours ago, 6 flags -
One Flame Throwing Robot Dog for Christmas Please!
Weaponry: 14 hours ago, 6 flags -
Don't take advantage of people just because it seems easy it will backfire
Rant: 14 hours ago, 4 flags -
Ditching physical money
History: 13 hours ago, 4 flags -
SETI chief says US has no evidence for alien technology. 'And we never have'
Aliens and UFOs: 4 hours ago, 4 flags -
Ode to Artemis
General Chit Chat: 10 hours ago, 3 flags -
Former Labour minister Frank Field dies aged 81
People: 2 hours ago, 3 flags -
VirginOfGrand says hello
Introductions: 15 hours ago, 2 flags -
This is our Story
General Entertainment: 7 hours ago, 2 flags
active topics
-
Florida man's trip overseas ends in shock over $143,000 T-Mobile phone bill
Social Issues and Civil Unrest • 1 • : budzprime69 -
President BIDEN Vows to Make Americans Pay More Federal Taxes in 2025 - Political Suicide.
2024 Elections • 33 • : CriticalStinker -
Mood Music Part VI
Music • 3094 • : TheWoker -
Don't take advantage of people just because it seems easy it will backfire
Rant • 7 • : confuzedcitizen -
"We're All Hamas" Heard at Columbia University Protests
Social Issues and Civil Unrest • 270 • : TheWoker -
Post A Funny (T&C Friendly) Pic Part IV: The LOL awakens!
General Chit Chat • 7131 • : baddmove -
So this is what Hamas considers 'freedom fighting' ...
War On Terrorism • 250 • : FlyersFan -
Russia Ukraine Update Thread - part 3
World War Three • 5725 • : BernnieJGato -
NASA Researchers Discover a Parallel Universe That Runs Backwards through Time - Alongside Us
Space Exploration • 70 • : seekshelter -
SETI chief says US has no evidence for alien technology. 'And we never have'
Aliens and UFOs • 21 • : network dude