It looks like you're using an Ad Blocker.
Please white-list or disable AboveTopSecret.com in your ad-blocking tool.
Thank you.
Some features of ATS will be disabled while you continue to use an ad-blocker.

California Forest Fires, are They Caused by Climate Change or is Something Else Occurring.
page: 7share:
You also forget the fact that the molten iron river speeding under Russia and Canada was found to have trebled in speed.
Molten iron river discovered speeding beneath Russia and Canada
This would increase the pressure in the Earth's crust, which would increase the activity of underwater and land based volcanoes.
Molten iron river discovered speeding beneath Russia and Canada
This would increase the pressure in the Earth's crust, which would increase the activity of underwater and land based volcanoes.
a reply to: ElectricUniverse
You're repeating yourself so I will do so too.
You're repeating yourself so I will do so too.
Says who?
This would increase the pressure in the Earth's crust, which would increase the activity of underwater and land based volcanoes.
edit on 11/15/2018 by Phage because: (no reason given)
originally posted by: Phage
a reply to: ElectricUniverse
You're repeating yourself so I will do so too.
Says who?
This would increase the pressure in the Earth's crust, which would increase the activity of underwater and land based volcanoes.
Let me quote you AGWers... PHYSICS SAY SO... The increased pressure has to go somewhere, it doesn't disappear like you seem to think.
Not to mention the fact that USGS seismologists who used the "Advanced National Seismic System (ANSS) catalog of M≥ 5.0 global earthquakes for the period between 1979 and 2014," and their research states global earthquakes have been increasing in activity. These are seismologists who know what they are doing. But like always "phage" knows better...
edit on 16-11-2018 by ElectricUniverse because: correct comment.
a reply to: ElectricUniverse
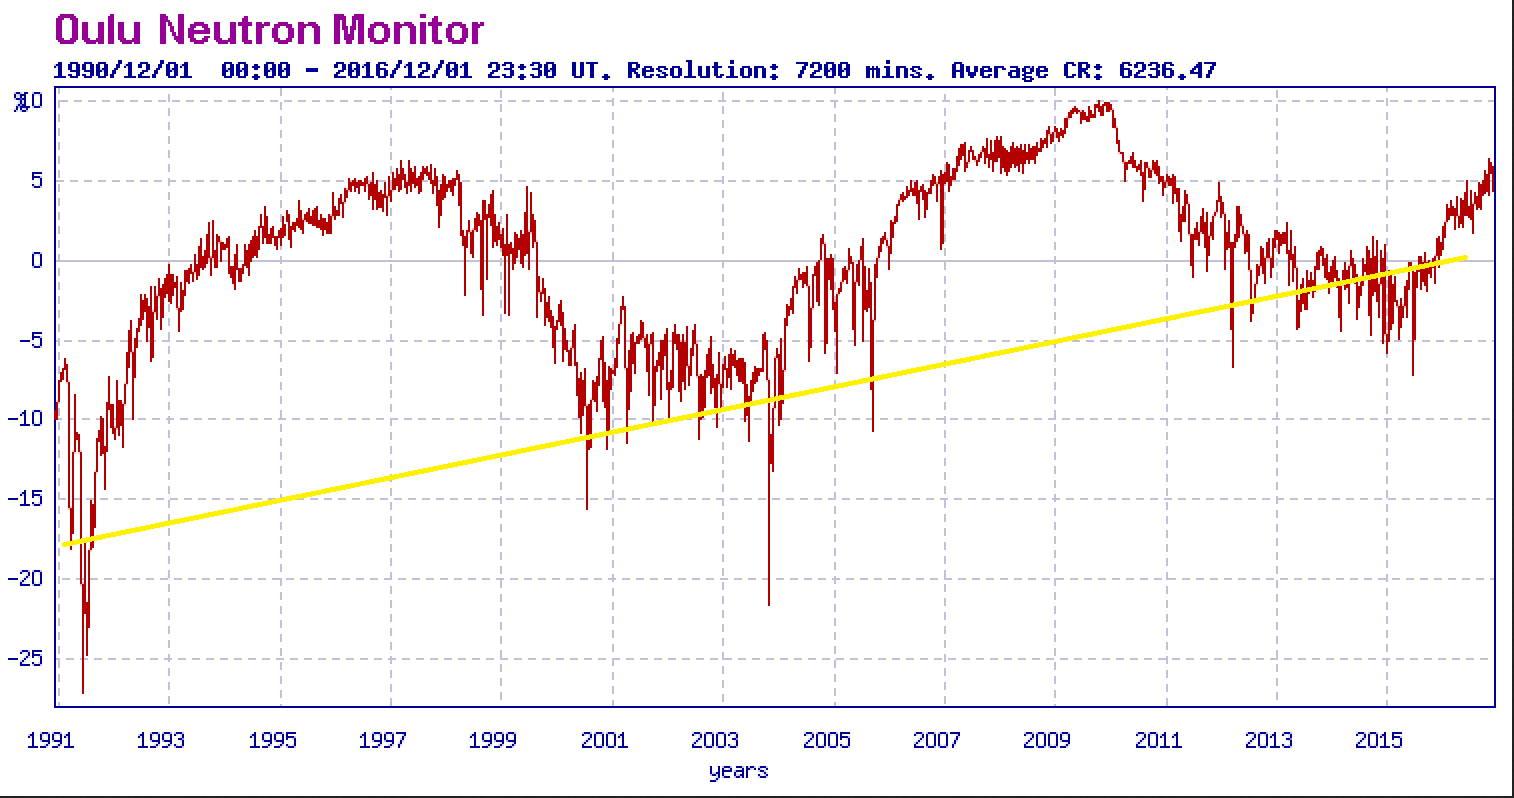
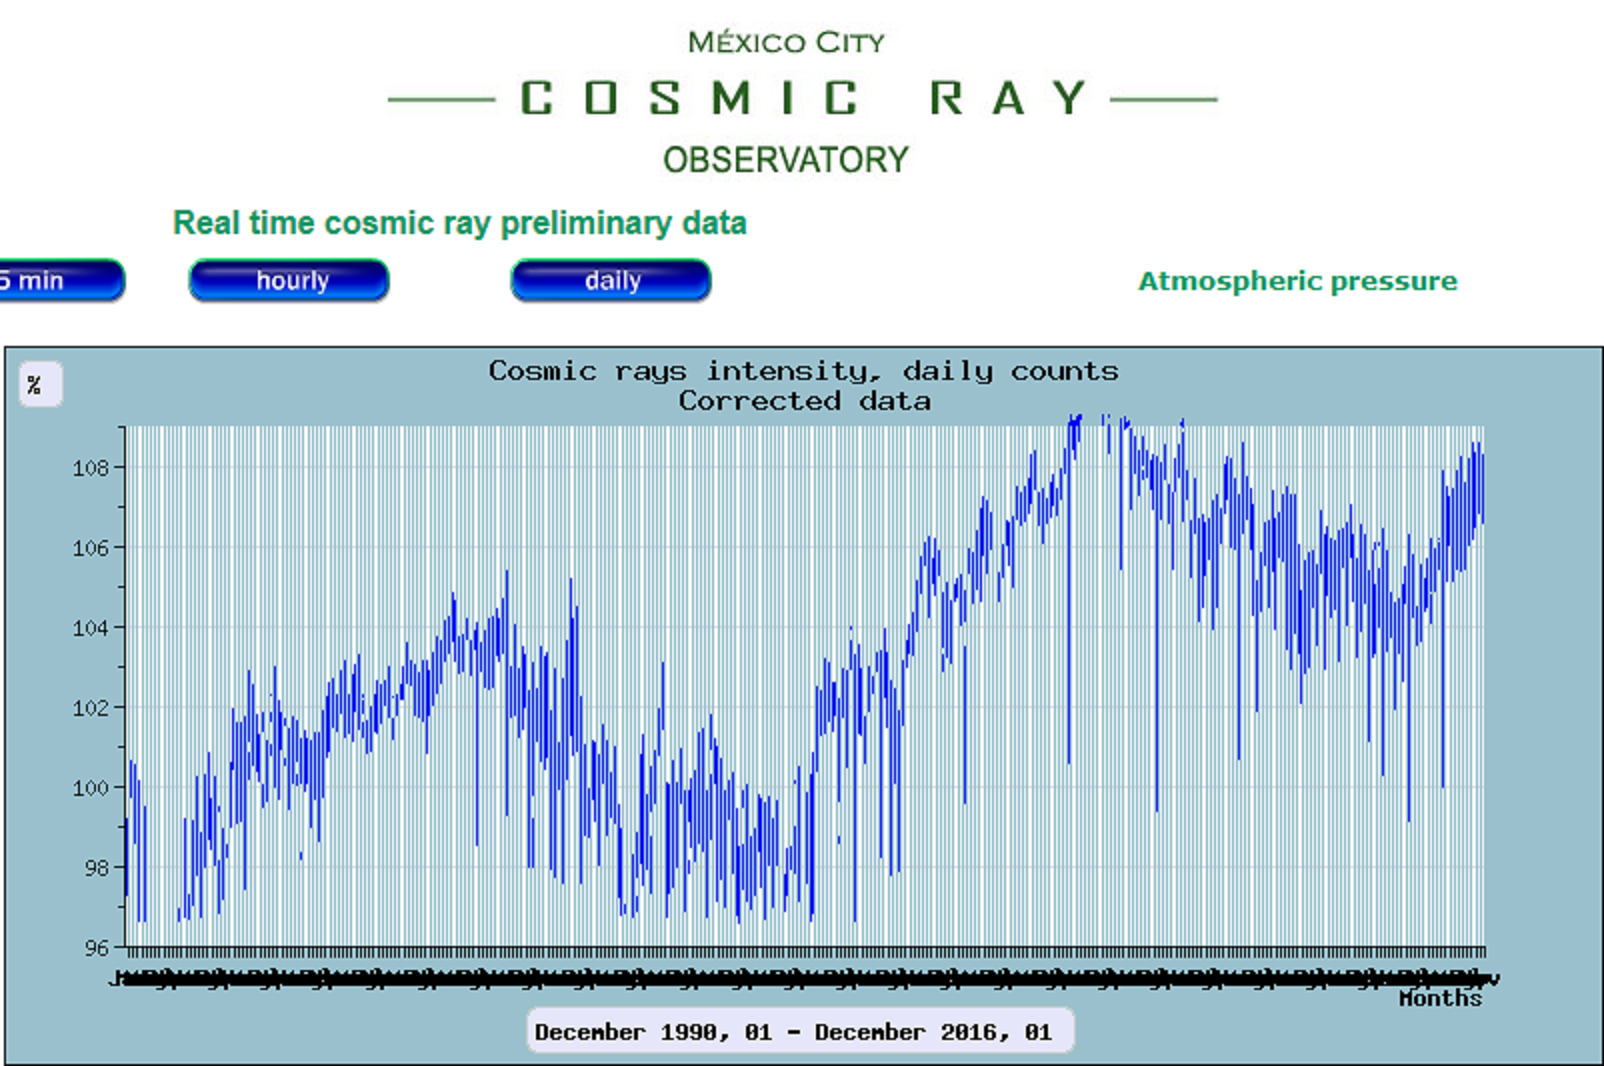
They cherry picked data. Just like you did with your cosmic ray chart.
But you do know where that "river" is located, right? It's in the outer core of the planet. The outer core which is composed entirely of molten iron. It is also under 1,800 miles of mantle. And there is no indication that it has changed recently because it has not been observed for long enough to make such a determination.
The increased pressure has to go somewhere, it doesn't disappear like you seem to think.
www.esa.int...
Swarm reveals that these changes are actually a jet stream moving at more than 40 km a year – three times faster than typical outer-core speeds and hundreds of thousands of times faster than Earth’s tectonic plates move.
So does the chart I posted. The chart I posted also includes other catalogs. It is more complete than what they used.
Not to mention the fact that USGS seismologists who used the "Advanced National Seismic System (ANSS) catalog of M≥ 5.0 global earthquakes for the period between 1979 and 2014,"
They cherry picked data. Just like you did with your cosmic ray chart.
edit on 11/16/2018 by Phage because: (no reason given)
originally posted by: Phage
www.esa.int...
Swarm reveals that these changes are actually a jet stream moving at more than 40 km a year – three times faster than typical outer-core speeds and hundreds of thousands of times faster than Earth’s tectonic plates move.
By Andy Coghlan
Deep below our planet’s surface a molten jet of iron nearly as hot as the surface of the sun is picking up speed.
This stream of liquid has been discovered for the first time by telltale magnetic field readings 3000 kilometres below North America and Russia taken from space.
The vast jet stream some 420 kilometres wide has trebled in speed since 2000, and is now circulating westwards at between 40 and 45 kilometres per year deep under Siberia and heading towards beneath Europe (see diagram, below). That is three times faster than typical speeds of liquid in the outer core.
...
www.newscientist.com...
It was a change in which the speed of the molten iron river trebled in speed... Then there is the fact that the weakening of Earth's magnetic field became 10 times worse in 2014. This signals dramatic changes occurring in Earth's core... But like always "You/Phage" and the AGWers want to blame it all on mankind instead of admitting Earth has gone through similar changes in the past, and they were, just like the one we have been in and are to this day "natural changes."
originally posted by: Phage
So does the chart I posted. The chart I posted also includes other catalogs. It is more complete than what they used.
They cherry picked data. Just like you did with your cosmic ray chart.
Those two seismologists studied the records. And once again PROVE they used the wrong records... You keep making this claim and never prove it...
Those two men know more about seismology than you ever will.
The one cherry picking the data and making false claims keeps being you.
The Worsening Cosmic Ray Situation
March 5, 2018 / Dr.Tony Phillips
March 5, 2018: Cosmic rays are bad–and they’re getting worse.
That’s the conclusion of a new paper just published in the research journal Space Weather. The authors, led by Prof. Nathan Schwadron of the University of New Hampshire, show that radiation from deep space is dangerous and intensifying faster than previously expected.
...
spaceweatherarchive.com...
Yet "Phage" wants to claim everyone else is wrong except Phage...
edit on 17-11-2018 by ElectricUniverse because: add and correct comment.
edit on 17-11-2018 by ElectricUniverse because: add
link.
a reply to: ElectricUniverse
Hmm.....Global Warming OR Arson ............Which One Would I Put 10 Grand On ? ...Hmm........
Hmm.....Global Warming OR Arson ............Which One Would I Put 10 Grand On ? ...Hmm........
originally posted by: Zanti Misfit
a reply to: ElectricUniverse
Hmm.....Global Warming OR Arson ............Which One Would I Put 10 Grand On ? ...Hmm........
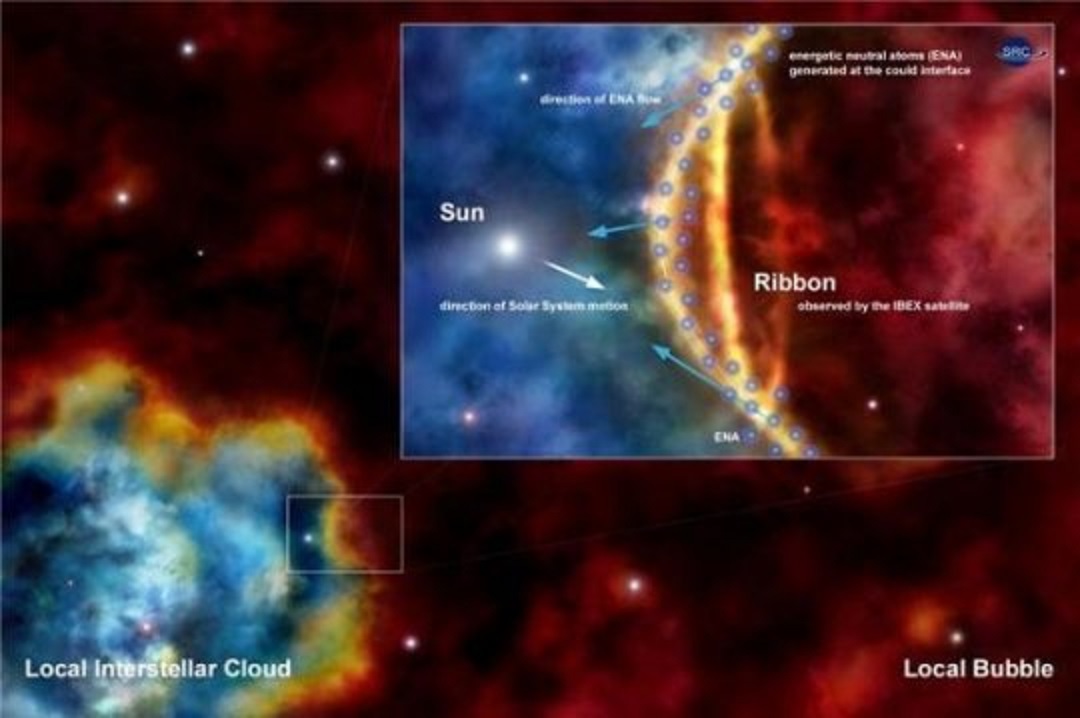
There is no doubt that there are people flooding the U.S. who have an agenda of causing as much chaos in the U.S. as they can cause. But it is also true that the Earth, and the entire Solar System, are changing and making such catastrophes worse. But this has nothing to do with "Anthropogenic Global Warming" as believed by leftists. The direction of the interstellar wind also changed a few years back showing that we have been entering a completely new area of the Local Fluff which is a million degrees hotter than the one we have been for the past 10,000-15,000 years or so. In less than 100 years the entire Solar System will be entirely in this region of the Local Fluff.
...
Like the wind adjusting course in the middle of a storm, scientists have discovered that the particles streaming into the solar system from interstellar space have most likely changed direction over the last 40 years. Such information can help us map out our place within the galaxy surrounding us, and help us understand our place in space.
...
Eleven Spacecraft Show Interstellar Wind Changed Direction Over 40 Years
www.sciencedaily.com...
I am more worried about the changes we will see from now til then which will only get worse and worse, unless a miracle happens and something changes the direction of the Solar System.
edit on 17-11-2018 by ElectricUniverse because: add links.
originally posted by: ElectricUniverse
originally posted by: Zanti Misfit
a reply to: ElectricUniverse
Hmm.....Global Warming OR Arson ............Which One Would I Put 10 Grand On ? ...Hmm........
There is no doubt that there are people flooding the U.S. who have an agenda of causing as much chaos in the U.S. as they can cause. But it is also true that the Earth, and the entire Solar System, are changing and making such catastrophes worse. But this has nothing to do with "Anthropogenic Global Warming" as believed by leftists. The direction of the interstellar wind also changed a few years back showing that we have been entering a completely new area of the Local Fluff which is a million degrees hotter than the one we have been for the past 10,000-15,000 years or so.
Yes , Solar Activity attributes Greatly to Earths Extremes in Climate . Mans Contribution of CO2 Emissions in Our Upper Atmosphere is Negligent compared to say , Just One Volcanic Eruption . Now , the Fires Recently in California show an Obvious Neglect by the State Government to Respond to a Crisis in a Timely Manner Created by their Own Incompetent Actions . Meanwhile , the Average " Joe " in Cally is getting his Home Torched Courtesy of Jerry " Demented Soul " Brown .......(
edit on 17-11-2018 by Zanti Misfit because: (no reason given)
edit on 17-11-2018 by
Zanti Misfit because: (no reason given)
a reply to: ElectricUniverse
' I am more worried about the changes we will see from now til then which will only get worse and worse, unless a miracle happens and something changes the direction of the Solar System. '
The Milky Way Galaxy has it's Own Procession , the Maya Calendar Compensated for that in it's Calculations . It could be that the 2012 End Time could have been Off by 7 Years . I dunno , WTF do Any of us Believe ? ........)
a reply to: ElectricUniverse
You see, they deliberately cherry picked the data because they were looking for something specific, the "clustering" of earthquakes. They did not look for, nor did they find, an overall increase in earthquake frequency.
But here's an interesting thing:
Low energy ions. Tell me, are galactic cosmic rays considered to be low-energy ions?
The entire outer core is molten iron. This seems to be a "jet stream" moving within the outer core, yes. Where's the part about this jet stream causing an increase in volcanic activity? Where is this increase in volcanic activity.
It was a change in which the speed of the molten iron river trebled in speed.
Can you be more specific? Your meaning is unclear. What happened the the magnetic field in 2014, exactly? What was "10 times worse?" Is the data from SWARM? Because SWARM does seem to be showing us that the Earth's magnetic field varies, perhaps more than was thought.
Then there is the fact that the weakening of Earth's magnetic field became 10 times worse in 2014.
Yes. And what did they find?
Those two seismologists studied the records.
agupubs.onlinelibrary.wiley.com...
A strong increase in the number of global earthquakes is noted since 2010 that appears to have accelerated during the first quarter of 2014. However, there is no evidence that this increase represents a departure from temporally independent earthquake occurrence, as many of these earthquakes are local aftershocks of prior events.
You see, they deliberately cherry picked the data because they were looking for something specific, the "clustering" of earthquakes. They did not look for, nor did they find, an overall increase in earthquake frequency.
No. I showed a data set which shows several solar cycles. You showed the changes in cosmic ray data between solar maximum and solar minimum. That is absurd cherry picking on your part. Especially showing it as a trend. That's sort of like comparing summer temperatures to winter temperatures and saying "See, it's getting colder!"
The one cherry picking the data and making false claims keeps being you.
Let's examine that, OK?
The authors, led by Prof. Nathan Schwadron of the University of New Hampshire, show that radiation from deep space is dangerous and intensifying faster than previously expected.
See that word "dose?" That's important because it shows what the paper is about, the exposure of astronauts to radiation. A 10% difference from a prediction from 2014. That doesn't seem to be much but yeah, the effects of the approaching solar minimum seem to have been underestimated a bit. We're learning all the time.
We compare the predictions of Schwadron, Blake, et al. (2014, doi.org...) with the actual dose rates observed by CRaTER in the last 4 years. The observed dose rates exceed the predictions by ∼10%, showing that the radiation environment is worsening more rapidly than previously estimated.
But here's an interesting thing:
agupubs.onlinelibrary.wiley.com...
Much of this increase is attributable to relatively low‐energy ions, which can be effectively shielded.
Low energy ions. Tell me, are galactic cosmic rays considered to be low-energy ions?
edit on 11/18/2018 by Phage because: (no reason given)
a reply to: ElectricUniverse
I'm not sure where you came up with that "million degrees hotter" but you should work on learning the difference between temperature and heat. Something can be very hot, but not have much heat. For example, the solar wind has a temperature of about 1 million degrees but there isn't much heat there because there isn't much stuff there. That "fluff", has even less stuff than the solar wind. It may be hot but there ain't much heat.
The direction of the interstellar wind also changed a few years back showing that we have been entering a completely new area of the Local Fluff which is a million degrees hotter than the one we have been for the past 10,000-15,000 years or so
I'm not sure where you came up with that "million degrees hotter" but you should work on learning the difference between temperature and heat. Something can be very hot, but not have much heat. For example, the solar wind has a temperature of about 1 million degrees but there isn't much heat there because there isn't much stuff there. That "fluff", has even less stuff than the solar wind. It may be hot but there ain't much heat.
edit on 11/18/2018 by Phage because: (no reason given)
a reply to: Zanti Misfit
So we see an 11 year cycle of climate extremes?
Solar activity varies greatly on that cycle.
Yes , Solar Activity attributes Greatly to Earths Extremes in Climate
So we see an 11 year cycle of climate extremes?
Solar activity varies greatly on that cycle.
edit on 11/18/2018 by Phage because: (no reason given)
a reply to: Zanti Misfit
We see an 11 year cycle in dramatic climate extremes?
Yes , and as a Result ?
We see an 11 year cycle in dramatic climate extremes?
edit on 11/19/2018 by Phage because: (no reason given)
a reply to: Zanti Misfit
Maybe not. I hadn't noticed that 11 year cycle of extremes in climate.
Have you? How is it manifested? Got some data?
Maybe not. I hadn't noticed that 11 year cycle of extremes in climate.
Have you? How is it manifested? Got some data?
edit on 11/19/2018 by Phage because: (no reason given)
originally posted by: Phage
The entire outer core is molten iron. This seems to be a "jet stream" moving within the outer core, yes. Where's the part about this jet stream causing an increase in volcanic activity? Where is this increase in volcanic activity.
Phage, you just can't never admit to being wrong. You go as far as claiming, every time, that research from volcanologists, geologists, etc who have studied are wrong. If the molten iron river trebled it's speed it is only logical that it is exerting more pressure in Earht's lithosphere. THis together with the fact that Earth's own magnetic field has been changing and it dramatically worsened in 2014 point to the fact that Earth's iron core is going through changes we haven't seen for a very long time.
originally posted by: Phage
Can you be more specific? Your meaning is unclear. What happened the the magnetic field in 2014, exactly? What was "10 times worse?" Is the data from SWARM? Because SWARM does seem to be showing us that the Earth's magnetic field varies, perhaps more than was thought.
How many people have access to your pc and post with your name? It feels like every time you discuss a topic you forget completely what was discussed, or more than one person has access to your pc.
Earth's Magnetic Field Is Weakening 10 Times Faster Now
originally posted by: Phage
Yes. And what did they find?
You see, they deliberately cherry picked the data because they were looking for something specific, the "clustering" of earthquakes. They did not look for, nor did they find, an overall increase in earthquake frequency.
...
4 Conclusions
A strong increase in the number of global earthquakes is noted since 2010 that appears to have accelerated during the first quarter of 2014. However, there is no evidence that this increase represents a departure from temporally independent earthquake occurrence, as many of these earthquakes are local aftershocks of prior events. While some studies have concluded that specific large earthquakes have had a significant impact on global M ≥ 5.0 seismicity since 2010, we cannot find a strong signal associated with global M ≥ 7.0 earthquakes that rises above the random fluctuations that are observed between regular 48 h periods; the largest rate increases we see are not associated with global main shocks (Figure 2). This is quantified here at the M ≥ 5.6 level because a temporally independent Poisson process governing the distribution of these earthquakes cannot be ruled out at 95% confidence, even with a wide range of local declustering and binning parameters. If M ≥ 7.0 earthquakes have significant global influence on other moderate to large events (M ≥ 5.6), then the catalog should be overdispersed well outside local aftershock zones. We do note apparent dependent clustering below this magnitude threshold that cannot be explained by local aftershocks or swarms.
...
agupubs.onlinelibrary.wiley.com...
A strong increase in the number of global earthquakes is noted since 2010 that appears to have accelerated during the first quarter of 2014.
Ironically this increase in earthquakes accelerated at the same time Earth's magnetic field started weakening 10 times faster in 2014. Whether they can or cannot find if this "increase in earthquakes" is "a departure from temporally independent earthquake occurrence" does not rule out the fact that the amount of earthquakes did increase. Even in this paper they point out that "studies have concluded that specific large earthquakes have had a significant impact on global M ≥ 5.0 seismicity since 2010."
originally posted by: Phage
No. I showed a data set which shows several solar cycles. You showed the changes in cosmic ray data between solar maximum and solar minimum. That is absurd cherry picking on your part. Especially showing it as a trend. That's sort of like comparing summer temperatures to winter temperatures and saying "See, it's getting colder!"
Absurd cherry picking?... How the heck did i cherry pick the data showing that the amount of cosmic rays, especially x-rays, the Solar system is receiving has been increasing?...
I did not pick what data to show, and even showed several articles pointing to this increase in cosmic rays and x-rays reaching our Solar System. I also pointed out that since 2008 and i quote:
...
The new results show an unexpected surplus of cosmic ray electrons at very high energy -- 300-800 billion electron volts -- that must come from a previously unidentified source or from the annihilation of very exotic theoretical particles used to explain dark matter.
...
www.nasa.gov...
I also showed that if we receive energy from cosmic rays greater than 500 million electron volts, it is enough energy that "the nuclear byproducts of the cascade can reach Earth's surface."
neutronm.bartol.udel.edu...
originally posted by: Phage
Let's examine that, OK?
See that word "dose?" That's important because it shows what the paper is about, the exposure of astronauts to radiation. A 10% difference from a prediction from 2014. That doesn't seem to be much but yeah, the effects of the approaching solar minimum seem to have been underestimated a bit. We're learning all the time.
And i pointed out that although that particular article is about radiation in space, if we are receiving since 2008 energy from cosmic rays that exceeds 500 million electron volts, then the extra energy is reaching even the earth's surface, yet you want to claim that this extra energy, over 300-800 billion electron volts which has continued to increase since 2008, would not affect Earth's atmosphere and our climate?
How is that Phage?... What you are claiming is that this extra energy simply disappears, and that's not true.
originally posted by: Phage
But here's an interesting thing:
agupubs.onlinelibrary.wiley.com...
Much of this increase is attributable to relatively low‐energy ions, which can be effectively shielded.
Low energy ions. Tell me, are galactic cosmic rays considered to be low-energy ions?
RELEASE : 08-301
Mysterious Source of High-Energy Cosmic Radiation Discovered
WASHINGTON -- Scientists announced Wednesday the discovery of a previously unidentified nearby source of high-energy cosmic rays. The finding was made with a NASA-funded balloon-borne instrument high over Antarctica.
...
www.nasa.gov...
What has been happening since 2008 Phage?
That article that you excerpted is stating that also the amount of radiation in the Solar System has increased more than was expected.
a reply to: ElectricUniverse
Suddenly? In 2014?
www.livescience.com...
However, there is no evidence that this increase represents a departure from temporally independent earthquake occurrence, as many of these earthquakes are local aftershocks of prior events.
Yes. And we receive them quite often.
I also showed that if we receive energy from cosmic rays greater than 500 million electron volts, it is enough energy that "the nuclear byproducts of the cascade can reach Earth's surface."
You really don't understand what that number means, but yes, most of that energy is depleted when those "byproducts" you mention are created.
How is that Phage?... What you are claiming is that this extra energy simply disappears, and that's not true.
Cosmic ray flux decreased after the solar minimum in 2008-2009 and increased after the solar maximum in 2014-2015. Like it seems to do quite often.
What has been happening since 2008 Phage?
edit on 11/20/2018 by Phage because: (no reason given)
originally posted by: ElectricUniverse
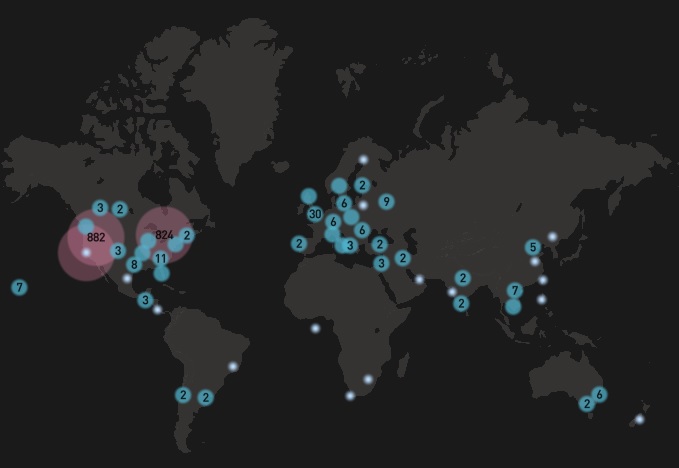
But I know some of you are already asking yourselves "but what does this have to do with the California fires?"
Well, i decided to look at where the worse events of Cosmic Rays are hitting us now. There are three large events occurring in three specific areas. Everywhere else on the plant the events are much much smaller. The three areas being hit then worst the events are magnitudes of 800+ higher than anywhere else.
Two of those events are overlapping each other, and incredible enough those two areas are covering a large portion of California, alongside some other states.
Here is a link to where I got the above picture.
Link
Now, for the past 45 minutes or so i have seen at least one of the two overlapping events increase from 809 to over 890. But it keeps going up and down. That number we are seeing is from just one of the two events.
You may have stumbled on a different conspiracy altogether.
What are the odds the 2 heaviest concentrations of "cosmic rays" hitting the most populated areas of a single country?
This leaves a couple possibilities:
1) We really are getting hit in the US with cosmic rays - is the magnetic field above the US weaker than other places?
If so, why? And how?
2) What if they're lying to us about cosmic rays to cover up for something else ?
This map is just too coincidental, hitting the east and west coast of the US and nowhere else in such density.
edit on 20-11-2018 by
Asktheanimals because: (no reason given)
new topics
-
Man sets himself on fire outside Donald Trump trial
Mainstream News: 3 minutes ago -
Biden says little kids flip him the bird all the time.
2024 Elections: 9 minutes ago -
The Democrats Take Control the House - Look what happened while you were sleeping
US Political Madness: 45 minutes ago -
Sheetz facing racial discrimination lawsuit for considering criminal history in hiring
Social Issues and Civil Unrest: 50 minutes ago -
In an Historic First, In N Out Burger Permanently Closes a Location
Mainstream News: 2 hours ago -
MH370 Again....
Disaster Conspiracies: 3 hours ago -
Are you ready for the return of Jesus Christ? Have you been cleansed by His blood?
Religion, Faith, And Theology: 5 hours ago -
Chronological time line of open source information
History: 6 hours ago -
A man of the people
Diseases and Pandemics: 8 hours ago -
Ramblings on DNA, blood, and Spirit.
Philosophy and Metaphysics: 8 hours ago
top topics
-
Israeli Missile Strikes in Iran, Explosions in Syria + Iraq
World War Three: 16 hours ago, 18 flags -
In an Historic First, In N Out Burger Permanently Closes a Location
Mainstream News: 2 hours ago, 14 flags -
Thousands Of Young Ukrainian Men Trying To Flee The Country To Avoid Conscription And The War
Other Current Events: 13 hours ago, 7 flags -
Iran launches Retalliation Strike 4.18.24
World War Three: 16 hours ago, 6 flags -
The Democrats Take Control the House - Look what happened while you were sleeping
US Political Madness: 45 minutes ago, 6 flags -
12 jurors selected in Trump criminal trial
US Political Madness: 16 hours ago, 4 flags -
4 plans of US elites to defeat Russia
New World Order: 9 hours ago, 4 flags -
A man of the people
Diseases and Pandemics: 8 hours ago, 4 flags -
Sheetz facing racial discrimination lawsuit for considering criminal history in hiring
Social Issues and Civil Unrest: 50 minutes ago, 2 flags -
Are you ready for the return of Jesus Christ? Have you been cleansed by His blood?
Religion, Faith, And Theology: 5 hours ago, 2 flags
active topics
-
Israeli Missile Strikes in Iran, Explosions in Syria + Iraq
World War Three • 88 • : CarlLaFong -
The Democrats Take Control the House - Look what happened while you were sleeping
US Political Madness • 12 • : ImagoDei -
Man sets himself on fire outside Donald Trump trial
Mainstream News • 0 • : Mantiss2021 -
Are you ready for the return of Jesus Christ? Have you been cleansed by His blood?
Religion, Faith, And Theology • 16 • : FlyersFan -
12 jurors selected in Trump criminal trial
US Political Madness • 59 • : Vermilion -
MH370 Again....
Disaster Conspiracies • 6 • : KnowItAllKnowNothin -
Biden says little kids flip him the bird all the time.
2024 Elections • 0 • : 5thHead -
4 plans of US elites to defeat Russia
New World Order • 34 • : Oldcarpy2 -
Sheetz facing racial discrimination lawsuit for considering criminal history in hiring
Social Issues and Civil Unrest • 2 • : Hecate666 -
Fossils in Greece Suggest Human Ancestors Evolved in Europe, Not Africa
Origins and Creationism • 71 • : Consvoli