It looks like you're using an Ad Blocker.
Please white-list or disable AboveTopSecret.com in your ad-blocking tool.
Thank you.
Some features of ATS will be disabled while you continue to use an ad-blocker.

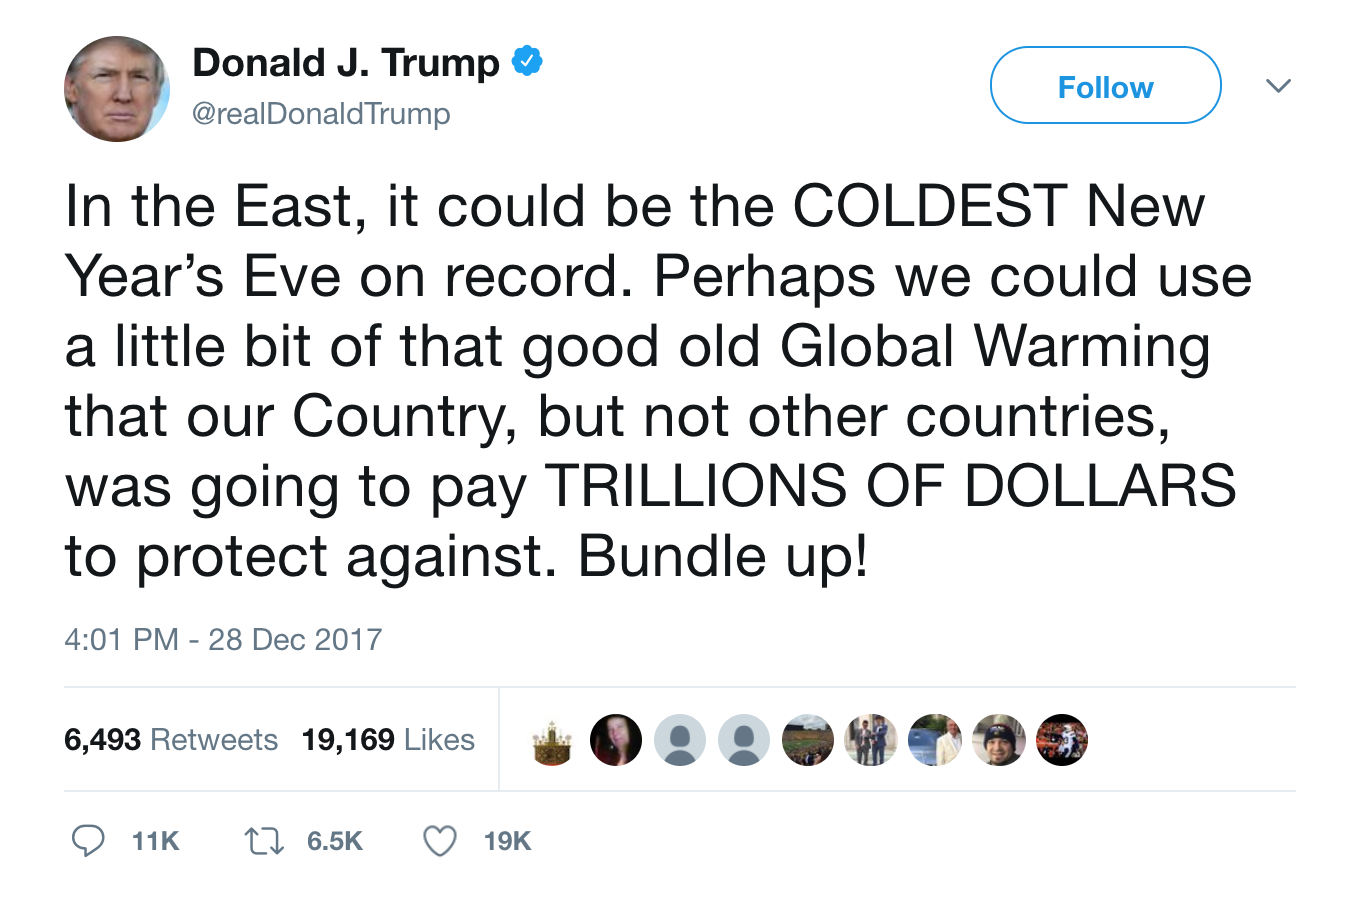
Trump sums up Global Warming in one Savage Tweet
page: 17share:
Not only is global warming real, but it's effects have been observed all the back to the early years of the 20th century.
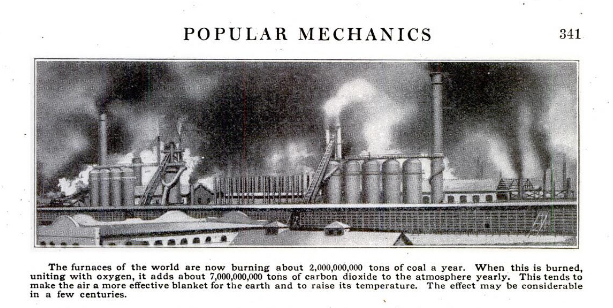
Oh, and here's the Snopes and the Popular Mechanics issue just in case.
Oh, and here's the Snopes and the Popular Mechanics issue just in case.
edit on 12-29-2017 by jaymp because: (no reason given)
originally posted by: testingtesting
a reply to: Phage
Mic drop boom.
I love you Phage lol.
That must be an admission of the truth - the number of models and the range of outcomes represents a very poor forecast and it gets even worse if you take the forecasts out to 2100 as the IPCC does.
By the way, the models themselves are based on a whole host of assumptions about future economic output and societal changes that can't be accurately modelled.
a reply to: UKTruth
You mean like continued increases in CO2 emissions? Yes, certain assumptions are made.
By the way, the models themselves are based on a whole host of assumptions about future economic output and societal changes that can't be accurately modelled.
You mean like continued increases in CO2 emissions? Yes, certain assumptions are made.
edit on 12/29/2017 by Phage because: (no reason given)
originally posted by: EvidenceNibbler
a reply to: JohnnyCanuck
Just as I thought, not capable of finding the Cook et al paper, posting it here for our discussion and debate. Carry on.
read this....
www.pnas.org...
it explains the difference between deniers and believers
originally posted by: Phage
a reply to: EvidenceNibbler
Since Watts included UAH data, here's Dr. Spencer's data. I've often wondered why Anthony Watt's chart (with UAH data) does not seem to show the El Nino spike of 1998.
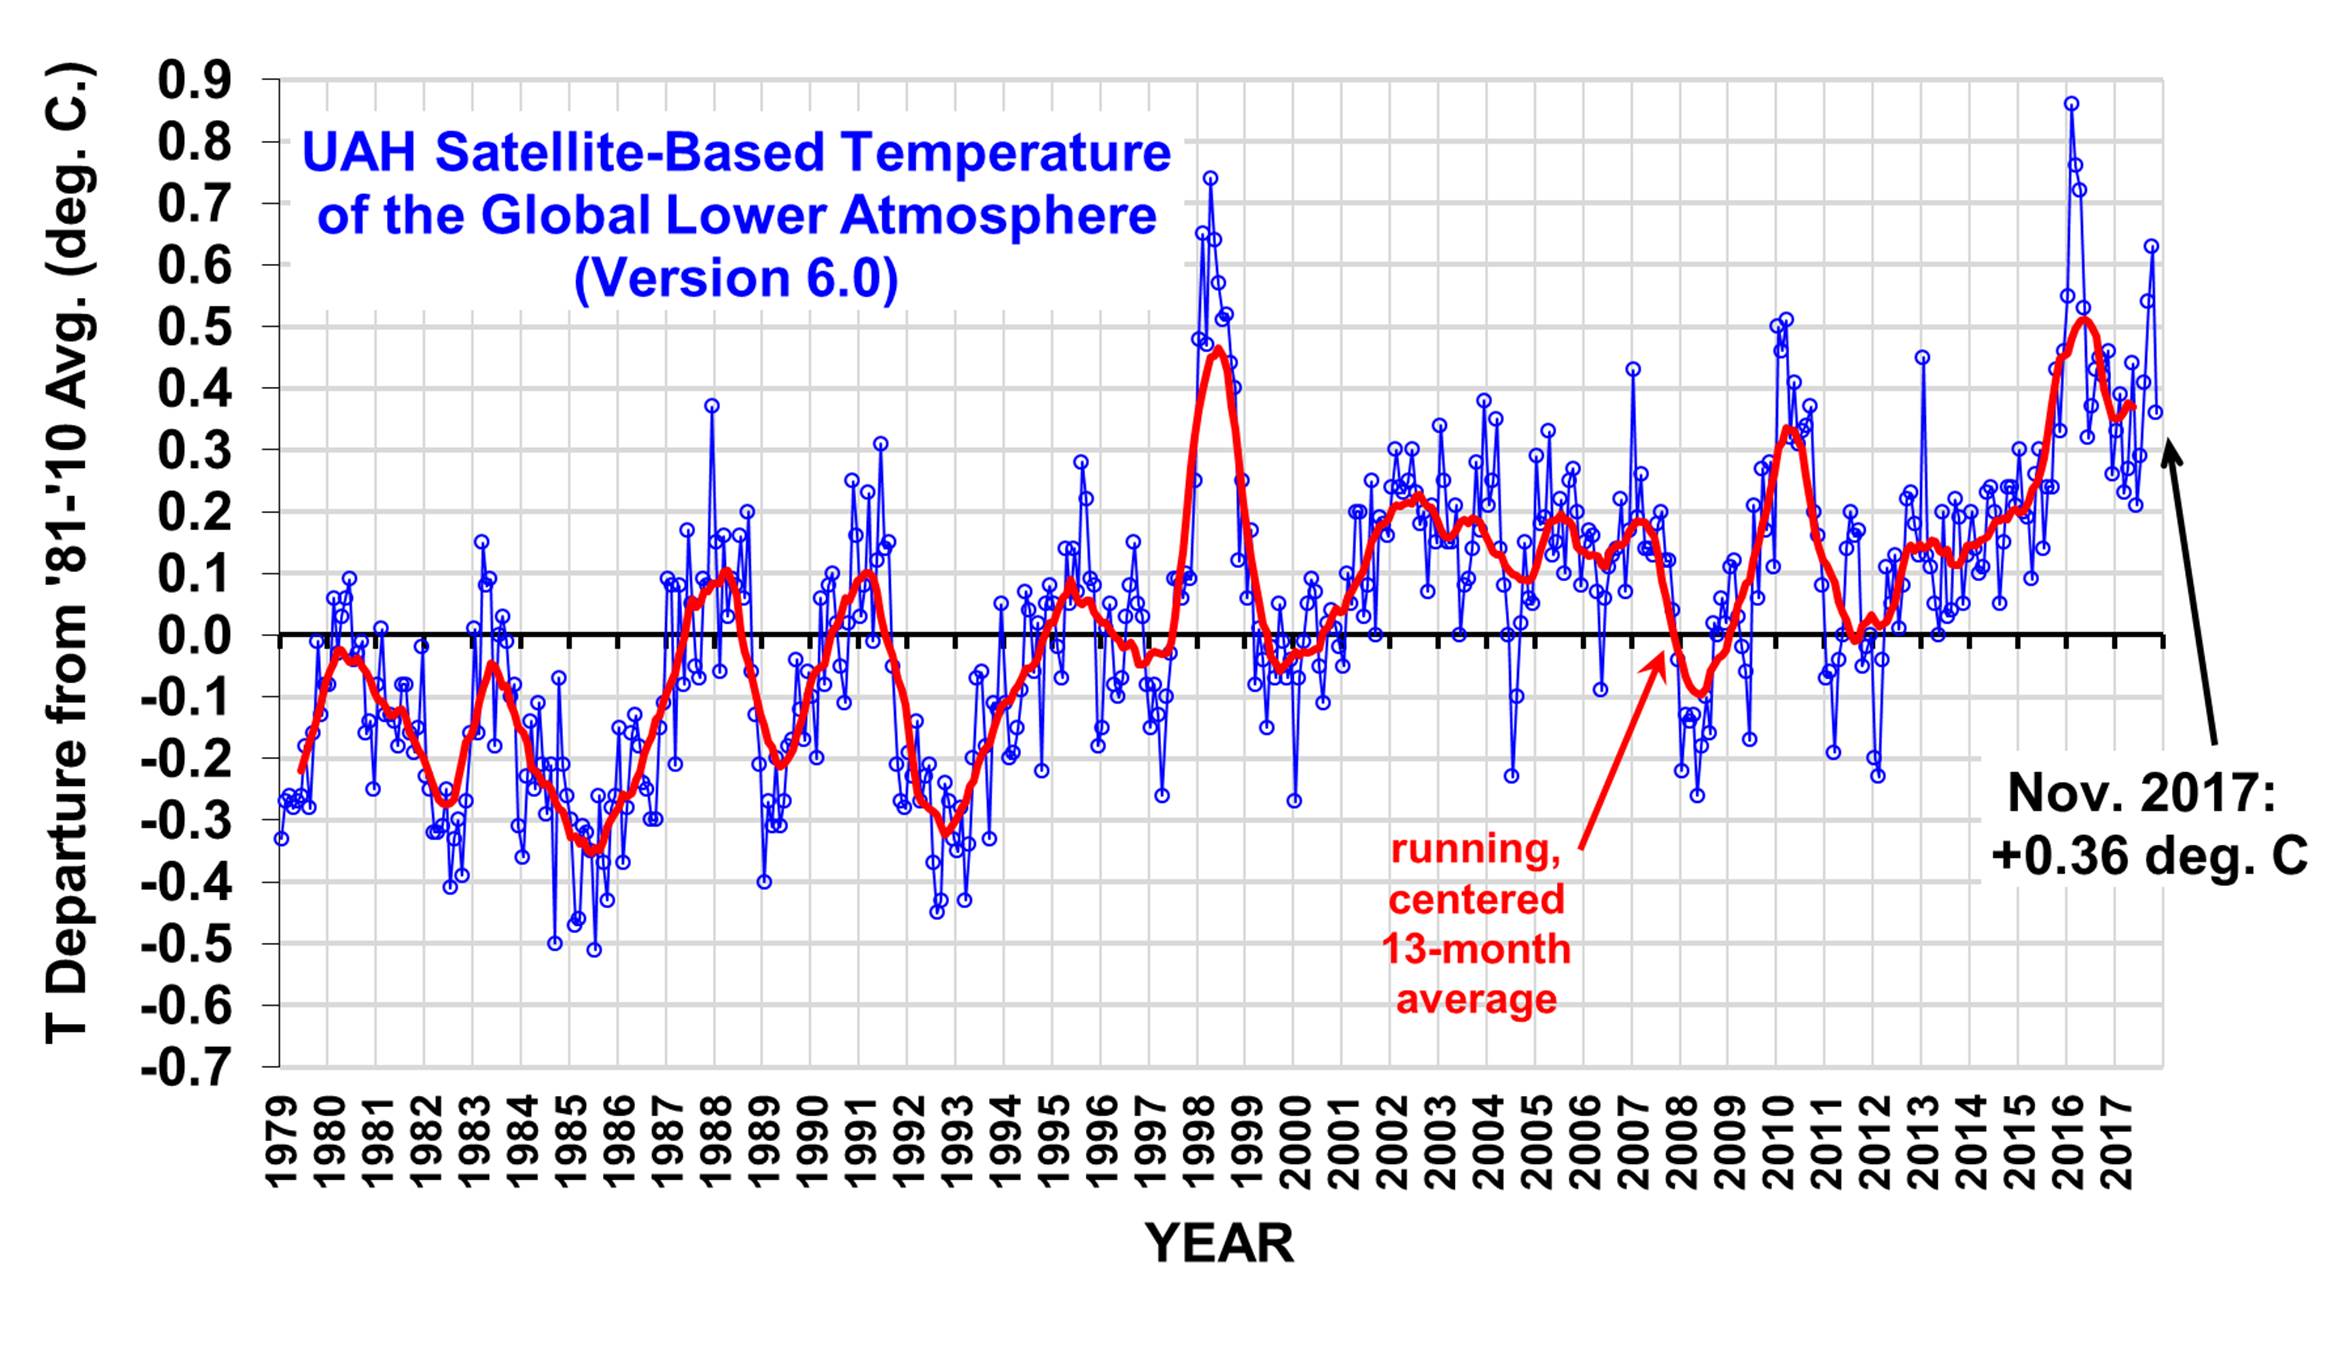
Matches up nicely with the GISS data - although they use an earlier time period for their baseline to calculate deltas. Most of that chart is noise, not far off the statistical variance of the climate models over 10 year periods.
edit on 29/12/2017 by UKTruth because: (no reason given)

a reply to: EvidenceNibbler
I have not the time right now to read the whole thread; so, maybe someone already mentioned David Dilley and his findings. He is worth a listen. He believes that climate change coming up is going to be global cooling, not warming, and that there is not a human influence we can exert to prevent it.
Listen to him, if you like. He is an older guy, but quite smart, although he interchanges the words Arctic and Antarctic a time or two, but whatever:
www.youtube.com...
I am also a scientist, and I happen to think Dilley is correct. So ... not 'all' scientists ever agreed that global warming was a fact, ever, unlike what the mainstream media told the masses hahahahahahaha
originally posted by: Phage
a reply to: UKTruth
By the way, the models themselves are based on a whole host of assumptions about future economic output and societal changes that can't be accurately modelled.
You mean like continued increases in CO2 emissions? Yes, certain assumptions are made.
Lots of assumptions are made in climate models. For example, the IPCC A1 model assumes rapid economic growth as well as a peak population by mid-century, then a decline, as well as increases in technical efficiency. They are estimates layered upon estimates, which is probably why the models perform so poorly and have been revised down since the 1988 model of 0.5 degrees per decade increase.
edit on 29/12/2017 by UKTruth
because: (no reason given)
a reply to: UKTruth
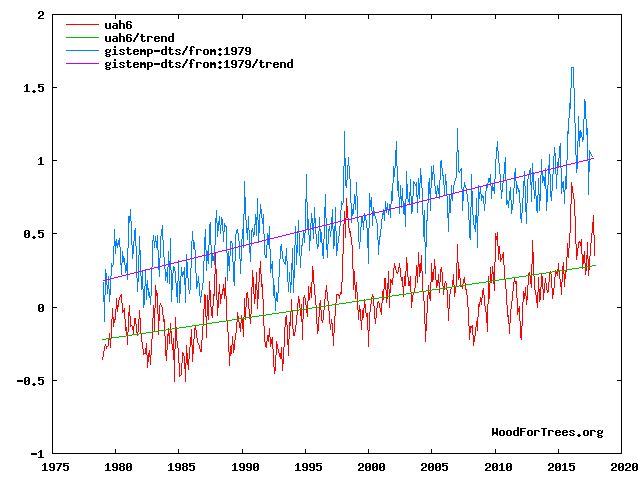
But the multi-decadal trend seems quite apparent. It is also quite in keeping with CMIP5 models.
Fairly close, though UAH shows a flatter trend.
Matches up nicely with the GISS data
Yes, quite a bit of intradecadal noise, as would be expected.
Most of that chart is noise, not far off the statistical ranges of the climate models over 10 year periods.
But the multi-decadal trend seems quite apparent. It is also quite in keeping with CMIP5 models.
edit on 12/29/2017 by Phage because: (no reason given)
a reply to: Phage
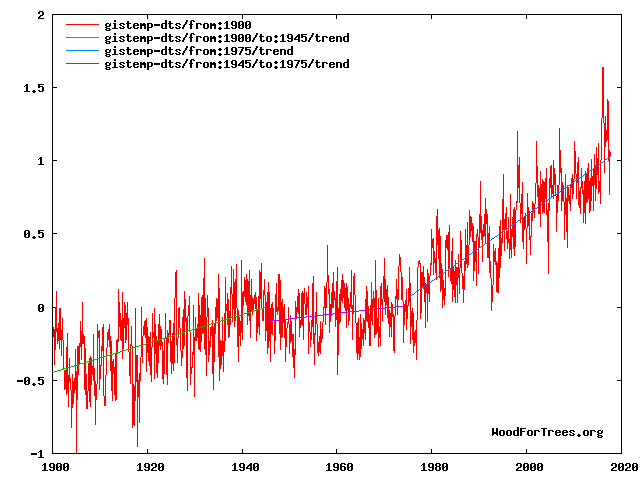
Do you have your chart going back to 1900?
From 1900 to around the end of WW2, we see from the GISS data an increase roughly the same as the 1975 to 2017 period.
From 1945 to 1975 there is a drop of around 0.3 degrees.
Do you have your chart going back to 1900?
From 1900 to around the end of WW2, we see from the GISS data an increase roughly the same as the 1975 to 2017 period.
From 1945 to 1975 there is a drop of around 0.3 degrees.
edit on 29/12/2017 by UKTruth because: (no reason given)
a reply to: UKTruth
But it's somewhat disingenuous to claim that Hansen's 1998 model (I think that's what you're referring to) called for 0.5º/decade. It showed that rate for a single decade; 1988 - 1997. And that was for one of 3 scenarios he presented, the "worst case" scenario for CO2 emissions.
The models are run using various variables, thus a range of outcomes.
They are estimates layered upon estimates, which is probably why the models perform so poorly and have been revised down since the 1988 model of 0.5 degrees per decade increase.
But it's somewhat disingenuous to claim that Hansen's 1998 model (I think that's what you're referring to) called for 0.5º/decade. It showed that rate for a single decade; 1988 - 1997. And that was for one of 3 scenarios he presented, the "worst case" scenario for CO2 emissions.
The universe is made up of protons, nuetrons, electrons and morons.
a reply to: UKTruth
Neither statement seems to be accurate.
From 1900 to around the end of WW2, we see from the GISS data an increase roughly the same as the 1975 to 2017 period.
From 1945 to 1975 there is a drop of around 0.3 degrees.
edit on 12/29/2017 by Phage because: (no reason given)
originally posted by: Phage
a reply to: UKTruth
Neither statement seems to be accurate.
From 1900 to around the end of WW2, we see from the GISS data an increase roughly the same as the 1975 to 2017 period.
From 1945 to 1975 there is a drop of around 0.3 degrees.
Raw data from NASA.
data.giss.nasa.gov...
I think woodfortrees.org might be using a using a different base period to calculate the delta?
By 1944 the temperature anomaly stood at an index of 21, or +0.21 degrees.
By 1976 it had dropped to -11, but actually down to -20 for 1964.
The point being, the trend in this data reverses for 30 years. In fact, it reverses twice during the period, whilst CO2 ppm does not.
Annual average delta chart with 10 period MA.
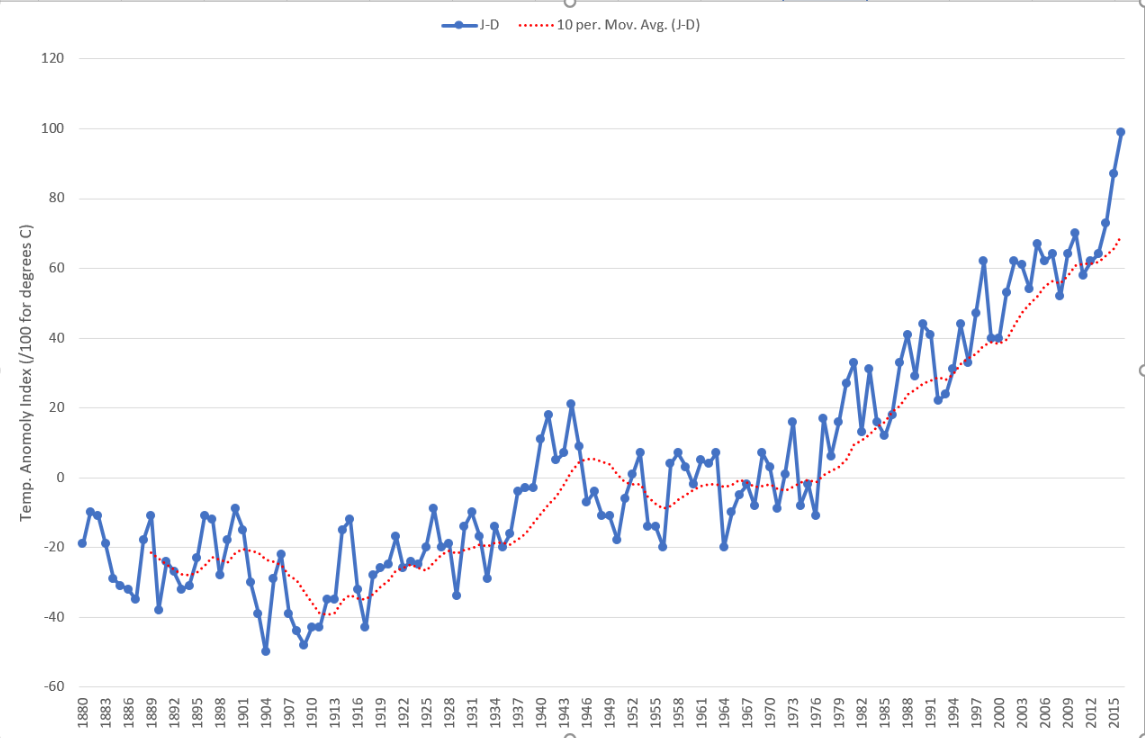
What evidence exists to make us sure that the next 20 - 30 years will not see a decline in temperature as happened after the significant run up from 1900 to 1944 (which is similar in scale to 1975 to 2016)?
edit on 29/12/2017 by UKTruth because: (no reason given)
If Trump thinks that a record breaking cold night disproves the fact that our planet is warming up, then he really doesn't know enough about global
warming to be giving opinions on the subject.
a reply to: UKTruth
You changed the period you were discussing. You first said 1945-1975.
Woodfortrees is using the dataset from NASA but even if it were using a different base period it would only affect the value of the anomaly, not the slope of the trend. But you have taken the difference in endpoints, that is not the same as a trendline.
There was a very slight positive trend in 1945-1975. The trend from 1975 to the present is not the same as the trend from 1900-1945, as you claim.
But perhaps if the US and Europe go back to producing aerosols at the rates they did in the middle of the last century, and maybe if there are more major volcanic eruptions to throw sulfates into the stratosphere, we could see some flattening. Hell, maybe the Sun actually will cool down too. So let's just keep doing what we're doing.
You changed the period you were discussing. You first said 1945-1975.
Woodfortrees is using the dataset from NASA but even if it were using a different base period it would only affect the value of the anomaly, not the slope of the trend. But you have taken the difference in endpoints, that is not the same as a trendline.
What evidence exists to make us sure that the next 20 - 30 years will not see a decline in temperature as happened after the significant run up from 1900 to 1944 (which is similar in scale to 1975 to 2016)?
There was a very slight positive trend in 1945-1975. The trend from 1975 to the present is not the same as the trend from 1900-1945, as you claim.
But perhaps if the US and Europe go back to producing aerosols at the rates they did in the middle of the last century, and maybe if there are more major volcanic eruptions to throw sulfates into the stratosphere, we could see some flattening. Hell, maybe the Sun actually will cool down too. So let's just keep doing what we're doing.
edit on 12/29/2017 by Phage because: (no reason given)
originally posted by: TerryMcGuire
i bet this one is not a real Trump Tweet, but rather one of his staff tweeting under his name. We know now that this happens all the time. The words are too clear, there are no punctuation errors , the sentences are constructed properly and there are no miss-spellings.
Nah, most likely Trump himself. Liberals have been underestimated him from the very beginning and you would think they would change their diet, but they're still eating crow to this very day. Liberals should simply stop talking. That way we will only assume that they're stupid, and they won't keep proving it to us.
Yeah, I changed it by 1 year (i was eyeballing the chart before)- and the data shows a decline in the trend taking a 10-period moving average (not end
point to end point)
Just over 30 years after a peak in 1944 the average temperature over a 10-year average period is LOWER.
As for 1900 to 1944 the average rises by ~0.5 degrees C.
The rise from 1975 to 2016 is ~0.7 degrees C
Given the noise in all these charts I call that similar AND over a similar time frame.
How can we be sure that the average temperature over a 10 year period will not be LOWER than it is today?
I'd say yes, stop what we are doing today- i.e. stop all the doomsday scenarios and unnecessary expense and regulation until science develops far better models and can more effectively prove the case.
edit on 29/12/2017 by UKTruth because: (no reason given)
originally posted by: djz3ro
originally posted by: EvidenceNibbler
[
Do you have any actual data or is this meme the limit of your evidence? Because the ice caps are getting smaller, there's satellite imagery that backs this up but it's 7.40am and I have a 3 year old and a 5 year old to contend with...
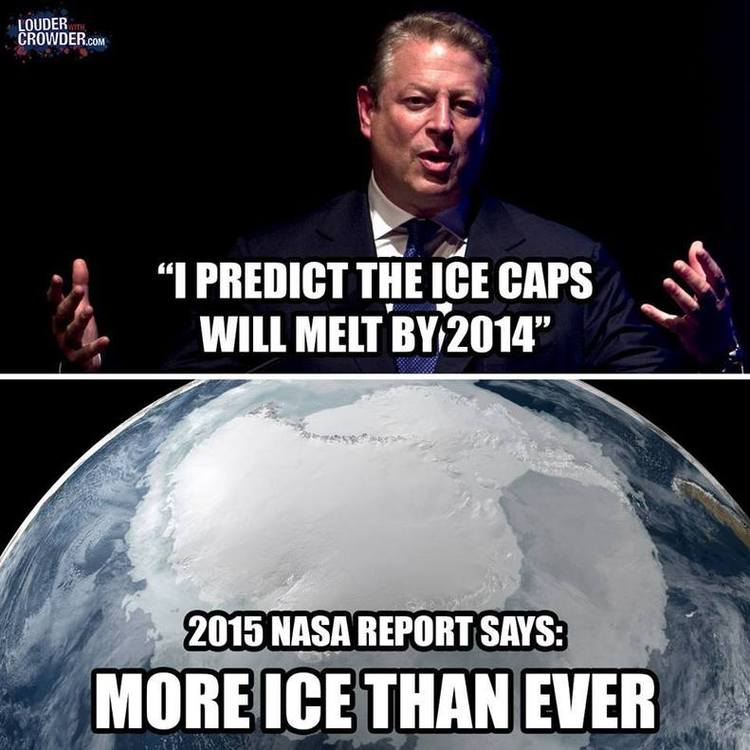
I am gonna guess that you are having trouble comprehending those two pics? What part didn't you get about the truth that most of the rest of us are sharing? Either more ice or not and a pic speaks a thousand words on that one here.
new topics
-
Las Vegas UFO Spotting Teen Traumatized by Demon Creature in Backyard
Aliens and UFOs: 1 hours ago -
2024 Pigeon Forge Rod Run - On the Strip (Video made for you)
Automotive Discussion: 2 hours ago -
Gaza Terrorists Attack US Humanitarian Pier During Construction
Middle East Issues: 3 hours ago -
The functionality of boldening and italics is clunky and no post char limit warning?
ATS Freshman's Forum: 4 hours ago -
Meadows, Giuliani Among 11 Indicted in Arizona in Latest 2020 Election Subversion Case
Mainstream News: 4 hours ago -
Massachusetts Drag Queen Leads Young Kids in Free Palestine Chant
Social Issues and Civil Unrest: 5 hours ago -
Weinstein's conviction overturned
Mainstream News: 6 hours ago -
Supreme Court Oral Arguments 4.25.2024 - Are PRESIDENTS IMMUNE From Later Being Prosecuted.
Above Politics: 7 hours ago -
Krystalnacht on today's most elite Universities?
Social Issues and Civil Unrest: 8 hours ago -
Chris Christie Wishes Death Upon Trump and Ramaswamy
Politicians & People: 8 hours ago
top topics
-
Krystalnacht on today's most elite Universities?
Social Issues and Civil Unrest: 8 hours ago, 9 flags -
Weinstein's conviction overturned
Mainstream News: 6 hours ago, 7 flags -
Supreme Court Oral Arguments 4.25.2024 - Are PRESIDENTS IMMUNE From Later Being Prosecuted.
Above Politics: 7 hours ago, 6 flags -
University of Texas Instantly Shuts Down Anti Israel Protests
Education and Media: 10 hours ago, 6 flags -
Massachusetts Drag Queen Leads Young Kids in Free Palestine Chant
Social Issues and Civil Unrest: 5 hours ago, 4 flags -
Meadows, Giuliani Among 11 Indicted in Arizona in Latest 2020 Election Subversion Case
Mainstream News: 4 hours ago, 4 flags -
Chris Christie Wishes Death Upon Trump and Ramaswamy
Politicians & People: 8 hours ago, 2 flags -
Any one suspicious of fever promotions events, major investor Goldman Sachs card only.
The Gray Area: 12 hours ago, 2 flags -
Gaza Terrorists Attack US Humanitarian Pier During Construction
Middle East Issues: 3 hours ago, 2 flags -
2024 Pigeon Forge Rod Run - On the Strip (Video made for you)
Automotive Discussion: 2 hours ago, 1 flags
active topics
-
Cats Used as Live Bait to Train Ferocious Pitbulls in Illegal NYC Dogfighting
Social Issues and Civil Unrest • 23 • : Ravenwatcher -
VP's Secret Service agent brawls with other agents at Andrews
Mainstream News • 54 • : mashtun -
Meadows, Giuliani Among 11 Indicted in Arizona in Latest 2020 Election Subversion Case
Mainstream News • 8 • : chr0naut -
-@TH3WH17ERABB17- -Q- ---TIME TO SHOW THE WORLD--- -Part- --44--
Dissecting Disinformation • 680 • : 777Vader -
Supreme Court Oral Arguments 4.25.2024 - Are PRESIDENTS IMMUNE From Later Being Prosecuted.
Above Politics • 73 • : xuenchen -
Is there a hole at the North Pole?
ATS Skunk Works • 40 • : Oldcarpy2 -
Fossils in Greece Suggest Human Ancestors Evolved in Europe, Not Africa
Origins and Creationism • 89 • : whereislogic -
University of Texas Instantly Shuts Down Anti Israel Protests
Education and Media • 197 • : NorthOS -
Candidate TRUMP Now Has Crazy Judge JUAN MERCHAN After Him - The Stormy Daniels Hush-Money Case.
Political Conspiracies • 790 • : Oldcarpy2 -
Weinstein's conviction overturned
Mainstream News • 20 • : Xtrozero