It looks like you're using an Ad Blocker.
Please white-list or disable AboveTopSecret.com in your ad-blocking tool.
Thank you.
Some features of ATS will be disabled while you continue to use an ad-blocker.

20 new science papers find climate driven by solar changes
page: 20share:
a reply to: Phage
See the straight lines? Thats the linear trend.
PS. there's a legend on the upper left hand side of the graph.
Global Mean Sea Level can be problematic when measured via Satellite Altimetry.
Link
No, it is to show the 50 year trend, and how it rises and falls, like most every other tidal station.
Is your point in showing the running 50 year trends to indicate the influence of the Metonic Cycle? 1920 to 1950 is not 19 years. I see no evidence of the Metonic Cycle in that data.
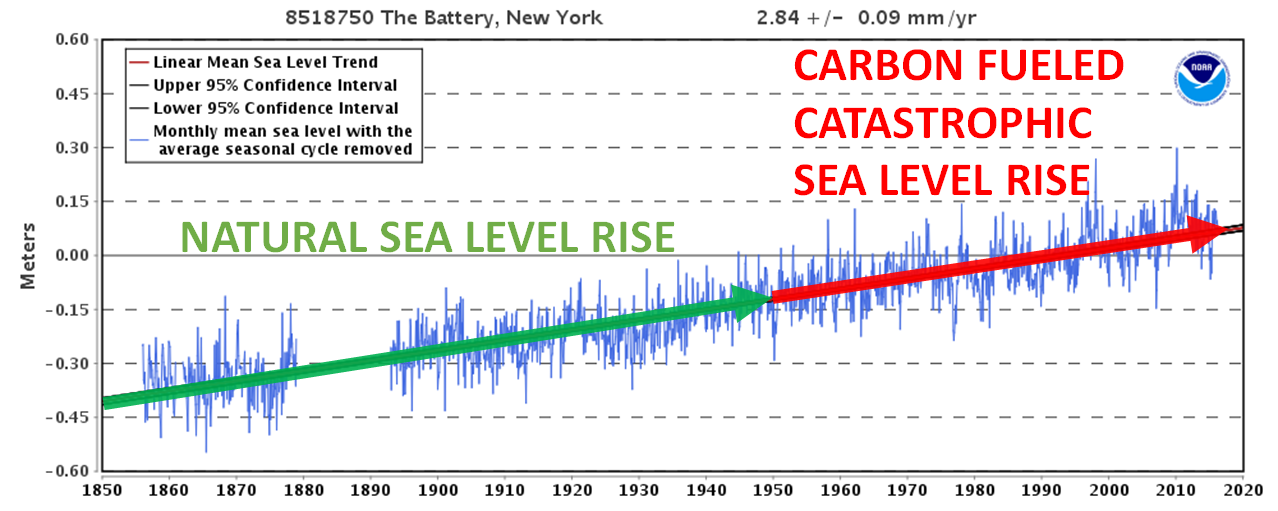
See that blue squiggly line? Thats the mean sea level trend.
Is the point of your second graph to show no change in the trend? See where it's labeled "Linear Mean Sea Level Trend?" What else would you expect a linear trend line to show?
See the straight lines? Thats the linear trend.
PS. there's a legend on the upper left hand side of the graph.
Tide station can be problematic when uplift and subsidence is a factor. But as I said, if you want details they are available in abundance in AR5.
Global Mean Sea Level can be problematic when measured via Satellite Altimetry.
Link
edit on 10-5-2017 by D8Tee because: (no reason given)
a reply to: D8Tee
No. It is the "monthly mean sea level with the average seasonal cycle removed." Pretty noisy signal. Hard to discern anything on the mm level by eye.
I wonder what it would show for the past couple of decades.
No, it is to show the 50 year trend, and how it rises and falls, like most every other tidal station.
See that blue squiggly line? Thats the mean sea level trend.
No. It is the "monthly mean sea level with the average seasonal cycle removed." Pretty noisy signal. Hard to discern anything on the mm level by eye.
That's one reason why it is not used in isolation. Do you think satellite derived atmospheric temperature data is without problems?
Global Mean Sea Level can be problematic when measured via Satellite Altimetry.
edit on 5/10/2017 by Phage because: (no reason given)
a reply to: Phage
Seems the 50 year variation charts all end at in the 1990's.
There is this, which indicates no acceleration.
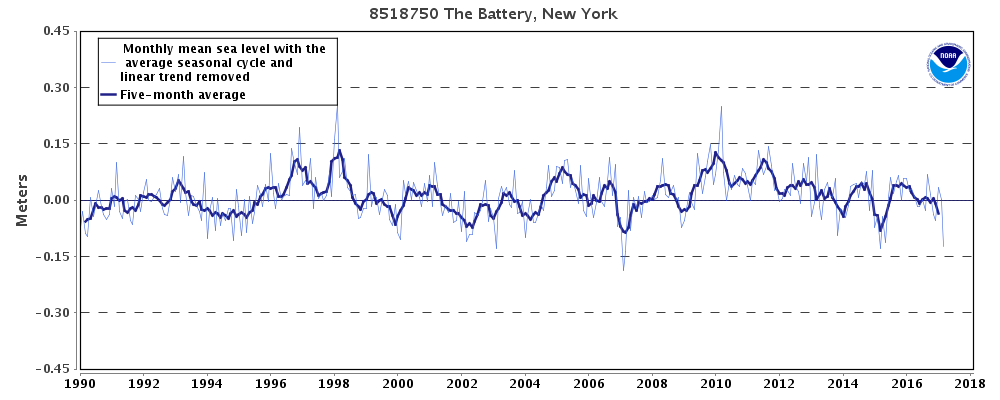
The plot shows the interannual variation of monthly mean sea level and the 5-month running average. The average seasonal cycle and linear sea level trend have been removed. Interannual variation is caused by irregular fluctuations in coastal ocean temperatures, salinities, winds, atmospheric pressures, and ocean currents.
I wonder what it would show for the past couple of decades.
Seems the 50 year variation charts all end at in the 1990's.
There is this, which indicates no acceleration.
The plot shows the interannual variation of monthly mean sea level and the 5-month running average. The average seasonal cycle and linear sea level trend have been removed. Interannual variation is caused by irregular fluctuations in coastal ocean temperatures, salinities, winds, atmospheric pressures, and ocean currents.
a reply to: Phage
It's possible to calculate the rate.
Can only work with what we have.
That chart does not show rates.
It's possible to calculate the rate.
Isostatic rebound is not the concern is it? Looking for accelerating sea level rise is what we are concerned about. Unless you think that there could be accelerating isostatic rebound masking the rise in sea level?
Didn't New York used to be under a glacier?
edit on 10-5-2017 by D8Tee because: (no reason given)
a reply to: Phage
University of Colorado is responsible for the Satellite Altimetry data, they say the rate of GMSL rise is going down.
Link
University of Colorado is responsible for the Satellite Altimetry data, they say the rate of GMSL rise is going down.
Link
Over the 23-year time series, it shows that GMSL has been rising at a rate of 3.3 ± 0.4 mm yr−1, but with notable inter-decadal variability. Our current best estimate of the rates during the first (1993–2002) and second (2003–2012) decades of the altimeter era are 3.5 and 2.7 mm yr−1, respectively, though important sources of uncertainty persist and raise caution regarding the record’s early years
a reply to: D8Tee
I thought you didn't like satellite derived data?
Your source:
I thought you didn't like satellite derived data?
Your source:
This assessment of the sea level budget during Mt Pinatubo’s 1991 eruption and in the several years thereafter has far reaching implications. First, it suggests that our monitoring of sea level via altimetry began in a highly anomalous environment, one in which OHC had been significantly depressed by the eruption while the offsetting influences of the atmosphere and land surface had largely diminished.
edit on 5/10/2017 by
Phage because: (no reason given)
a reply to: D8Tee
Not entirely factual. Thermal expansion does not increase the amount of water in the ocean but it does cause its level to rise.
Satellite Altimetry measures how much water is in the oceans.
Not entirely factual. Thermal expansion does not increase the amount of water in the ocean but it does cause its level to rise.
Duh.
Satellite Altimetry data cannot be used to predict relative sea level changes along the coast.
edit on 5/10/2017 by Phage because: (no reason given)
a reply to: Phage
Most people don't know much about sea level.
Satellite Altimetry measures the volume of water in the oceans.
Not entirely factual. Thermal expansion does not increase the amount of water in the ocean but it does cause its level to rise.
Not a lot of people know that, hope you understand that.
Duh.
Most people don't know much about sea level.
a reply to: D8Tee
No. It measures the distance between a satellite and the surface of the ocean. It cannot measure the volume of water. Perhaps you are confusing altimetry with gravimetric measurements.
Satellite Altimetry measures the volume of water in the oceans.
I live, and grew up on, in, and around the ocean.
Most people don't know much about sea level.
edit on 5/10/2017 by Phage because: (no reason given)
a reply to: Phage
Yes you are correct, it does not directly measure the volume of water in the oceans.
In essence, they would like the GMSL time series to be a proxy for ocean water volume changes. This is what is needed for comparisons to global climate models.
I see they are correcting the datasets for Glacial Isostatic movement of the seafloor now.
I understand that.
No. It measures the distance between a satellite and the surface of the ocean.
Yes you are correct, it does not directly measure the volume of water in the oceans.
In essence, they would like the GMSL time series to be a proxy for ocean water volume changes. This is what is needed for comparisons to global climate models.
I see they are correcting the datasets for Glacial Isostatic movement of the seafloor now.
a reply to: D8Tee
I know you knew, but did you know not eveyone knew haha.
Talking in circles now, it's late, have a good nite.
Hey, since you live by the ocean, can you see the increase in sea levels from say, barnacle lines on a warf or something oceany like that?
LOL, wait, that didn't come out right.
Not a lot of people know that, hope you understand that.
Most people don't know much about sea level.
I know you knew, but did you know not eveyone knew haha.
Talking in circles now, it's late, have a good nite.
Hey, since you live by the ocean, can you see the increase in sea levels from say, barnacle lines on a warf or something oceany like that?
a reply to: D8Tee
A thread in which you were a participant. Remember?
www.abovetopsecret.com...
And it's ongoing.
A thread in which you were a participant. Remember?
www.abovetopsecret.com...
And it's ongoing.
edit on 5/10/2017 by Phage because: (no reason given)
a reply to: Phage
None of the tide gauges record the mysterious acceleration which started in 1993 when the satellite (adjusted) data comes on-line.
Luckily for us, the IPCC can't manipulate the charts, graft the tail end on with the satellite data and show a hockey stick.
The shipping lanes are dependant upon these charts, it's not as easily manipulated as the temperature data is.
edit on 10-5-2017 by D8Tee because: (no reason given)
edit on 10-5-2017 by D8Tee because: (no reason given)
a reply to: D8Tee
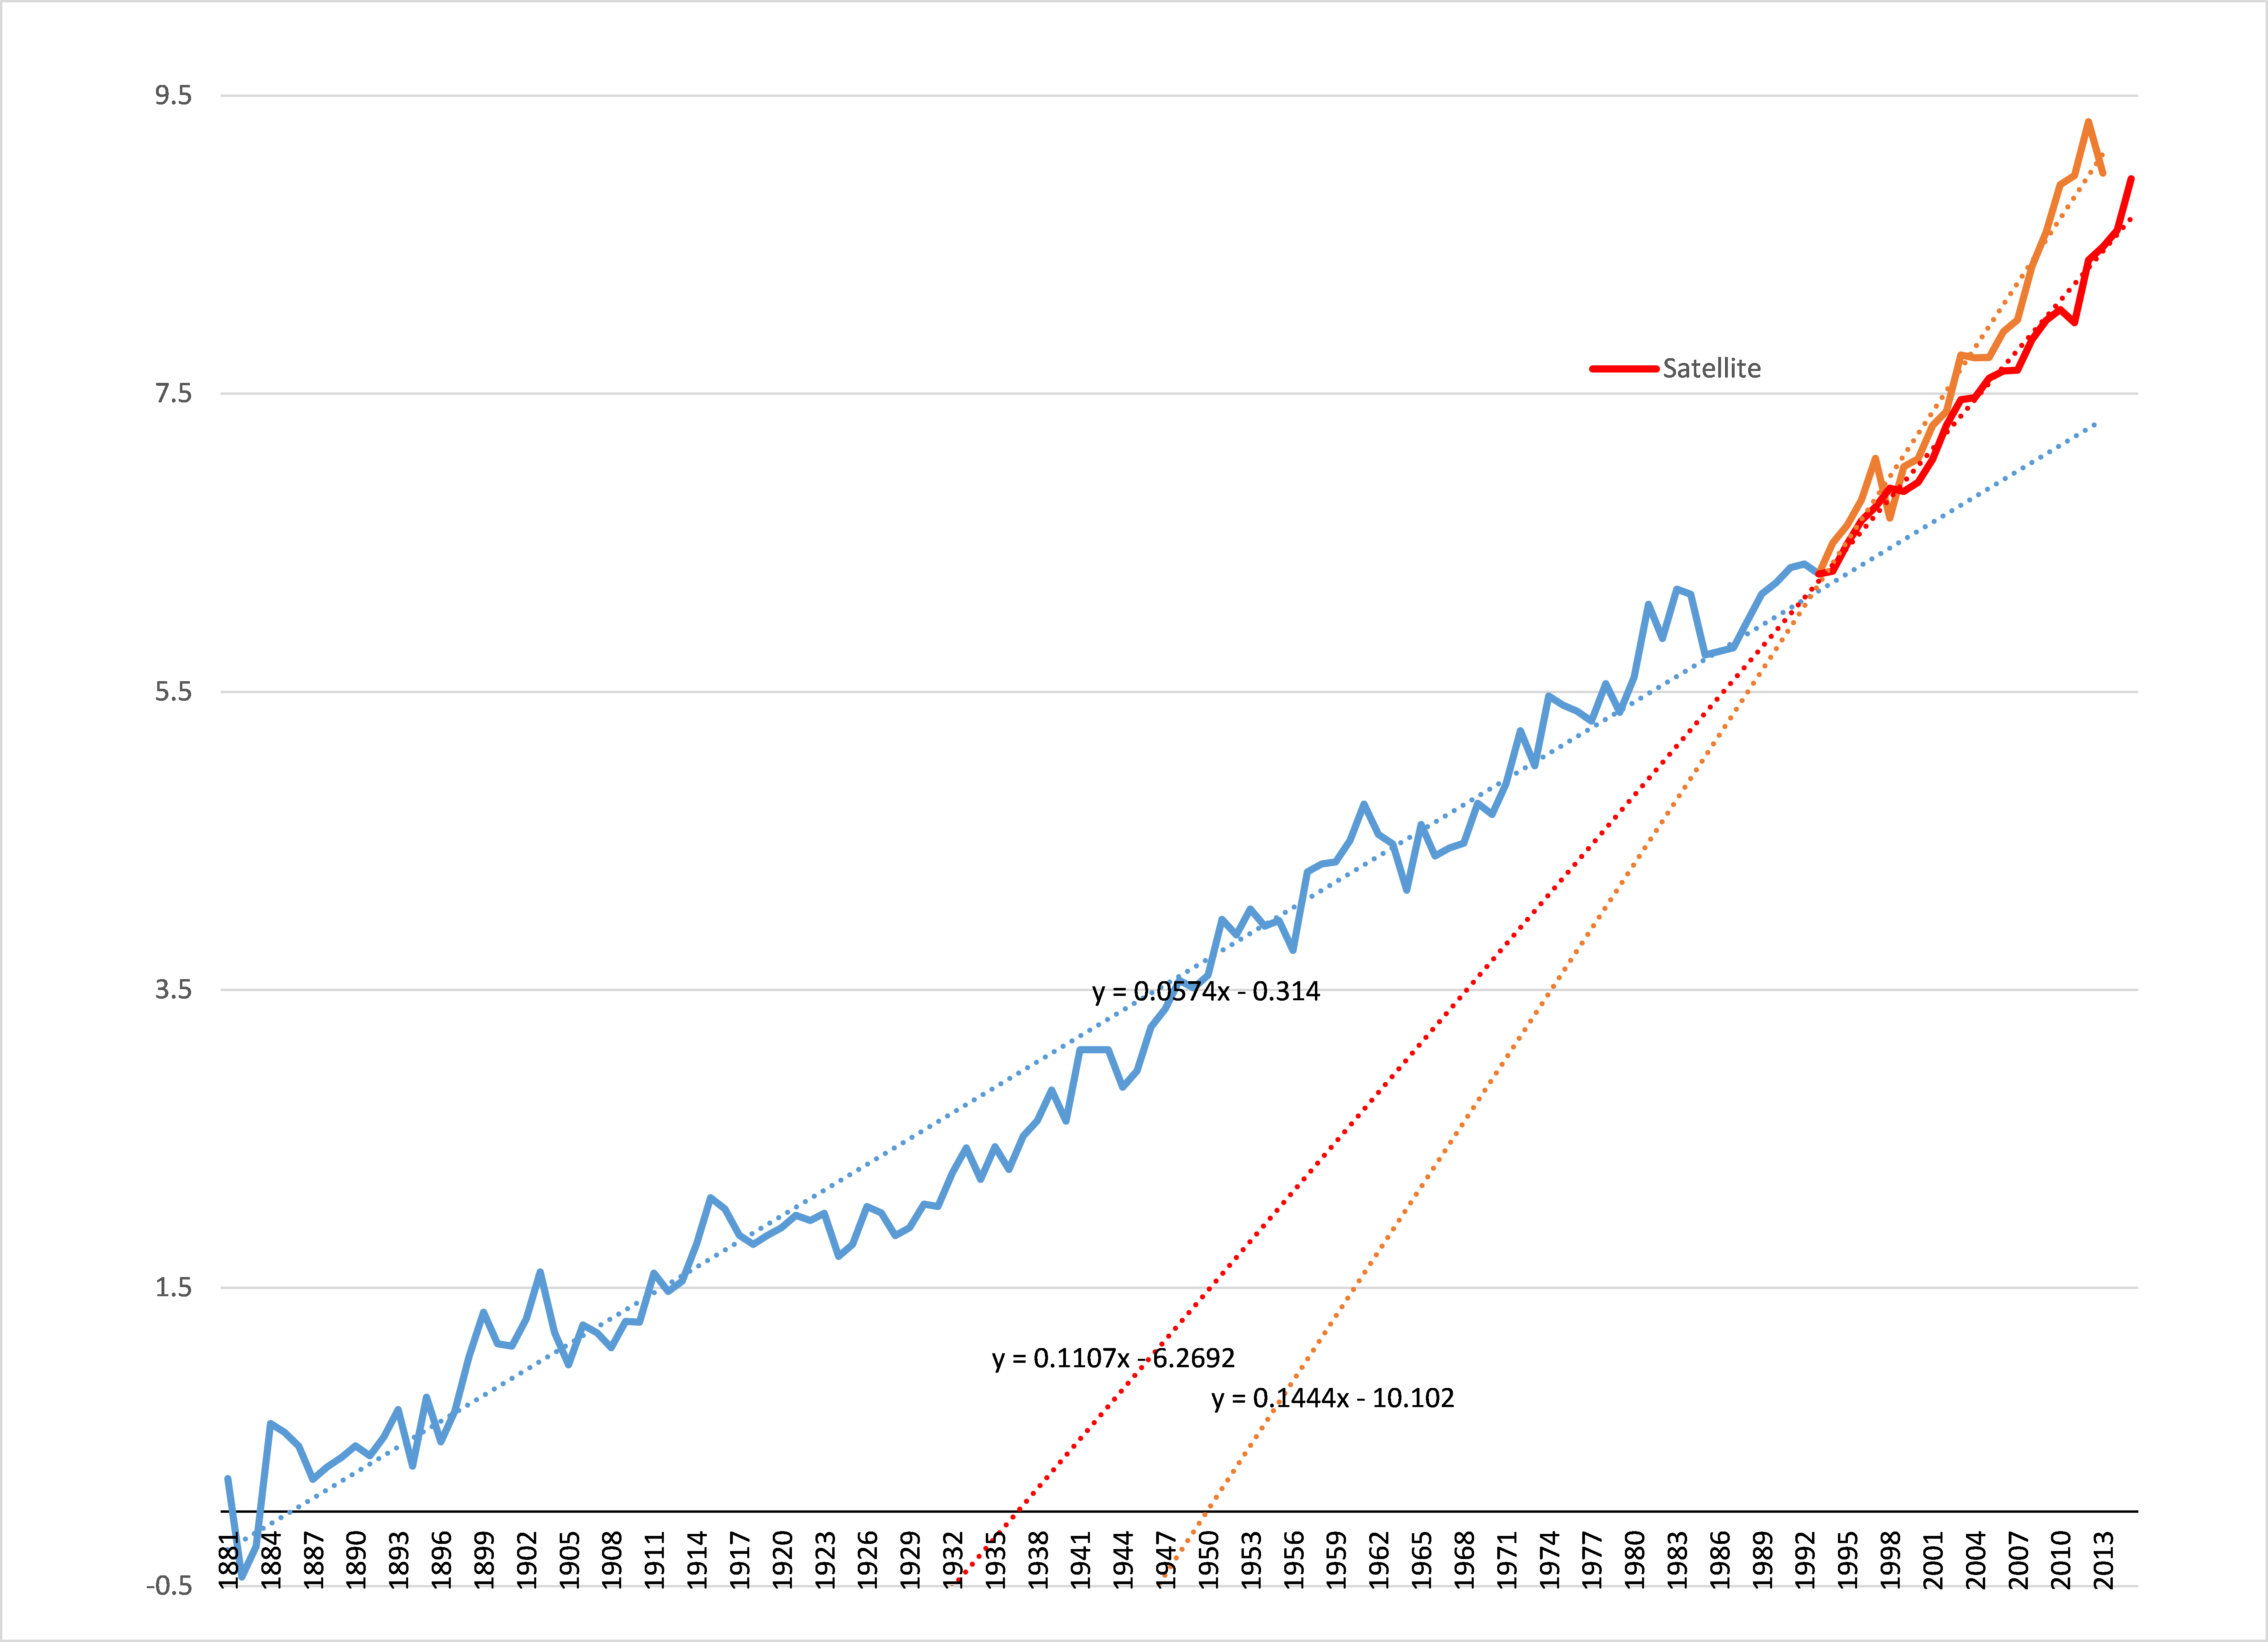
Blue line is tide gauge data 1881-1993
Orange line is tide guage data 1993-2013
Red line is satellite data.
www.epa.gov...
Actually, tide gauge data shows a greater rate of change than the satellite data does.
None of the tide gauges record the mysterious acceleration which started in 1993 when the satellite (adjusted) data comes on-line.
Blue line is tide gauge data 1881-1993
Orange line is tide guage data 1993-2013
Red line is satellite data.
www.epa.gov...
Shipping doesn't worry much about millimeters per year.
The shipping lanes are dependant upon these charts, it's not as easily manipulated as the temperature data is.
edit on 5/10/2017 by Phage because: (no reason given)
originally posted by: Xenogears
Has the Sun been more active in recent decades, and could it be responsible for some global warming?
Sounds convincing doesn't it?... At least it does if you don't use common sense and realize that they never mentioned how much CO2 and methane they released in the greenhouses...
A greenhouse gas with atmospheric CO2 at 400ppm would give a result completely different to a greenhouse gas with CO2 levels at 12,000ppm +
So why didn't they mention exactly how much CO2 they used in the experiment?... All we hear is the dude from mythbusters state they can increase CO2 slowly but never mentions how much CO2 they released...
Is atmospheric CO2 a greenhouse gas? certainly, but at the levels it exists on Earth's atmosphere it is negligible as a ghg.
Then again there is the fact that a molecule of water vapor is at least 10 times more potent than a molecule of CO2. Then you have to remember that as a greenhouse gas water vapor exists on Earth's atmosphere at 1%-5% of trace gases. Meanwhile CO2 exists at 0.04% as a trace gas.
Even if atmospheric CO2 levels increased to 40,000ppm, water vapor molecules would still be 10 times more potent than CO2.
See the difference?
edit on 10-5-2017 by ElectricUniverse because: add and correct comment.
new topics
-
Supreme Court Oral Arguments 4.25.2024 - Are PRESIDENTS IMMUNE From Later Being Prosecuted.
Above Politics: 28 minutes ago -
Krystalnacht on today's most elite Universities?
Social Issues and Civil Unrest: 37 minutes ago -
Chris Christie Wishes Death Upon Trump and Ramaswamy
Politicians & People: 1 hours ago -
University of Texas Instantly Shuts Down Anti Israel Protests
Education and Media: 3 hours ago -
Any one suspicious of fever promotions events, major investor Goldman Sachs card only.
The Gray Area: 5 hours ago -
God's Righteousness is Greater than Our Wrath
Religion, Faith, And Theology: 9 hours ago
top topics
-
VP's Secret Service agent brawls with other agents at Andrews
Mainstream News: 14 hours ago, 11 flags -
Nearly 70% Of Americans Want Talks To End War In Ukraine
Political Issues: 15 hours ago, 5 flags -
Sunak spinning the sickness figures
Other Current Events: 14 hours ago, 5 flags -
Electrical tricks for saving money
Education and Media: 12 hours ago, 4 flags -
Late Night with the Devil - a really good unusual modern horror film.
Movies: 16 hours ago, 3 flags -
Krystalnacht on today's most elite Universities?
Social Issues and Civil Unrest: 37 minutes ago, 3 flags -
Any one suspicious of fever promotions events, major investor Goldman Sachs card only.
The Gray Area: 5 hours ago, 2 flags -
University of Texas Instantly Shuts Down Anti Israel Protests
Education and Media: 3 hours ago, 2 flags -
Supreme Court Oral Arguments 4.25.2024 - Are PRESIDENTS IMMUNE From Later Being Prosecuted.
Above Politics: 28 minutes ago, 1 flags -
Chris Christie Wishes Death Upon Trump and Ramaswamy
Politicians & People: 1 hours ago, 0 flags
active topics
-
Nearly 70% Of Americans Want Talks To End War In Ukraine
Political Issues • 68 • : FlyersFan -
Candidate TRUMP Now Has Crazy Judge JUAN MERCHAN After Him - The Stormy Daniels Hush-Money Case.
Political Conspiracies • 744 • : Threadbarer -
University of Texas Instantly Shuts Down Anti Israel Protests
Education and Media • 45 • : CriticalStinker -
Truth Social goes public, be careful not to lose your money
Mainstream News • 129 • : matafuchs -
Krystalnacht on today's most elite Universities?
Social Issues and Civil Unrest • 2 • : marg6043 -
Remember These Attacks When President Trump 2.0 Retribution-Justice Commences.
2024 Elections • 56 • : WeMustCare -
British TV Presenter Refuses To Use Guest's Preferred Pronouns
Education and Media • 148 • : Consvoli -
VP's Secret Service agent brawls with other agents at Andrews
Mainstream News • 44 • : ByeByeAmericanPie -
New whistleblower Jason Sands speaks on Twitter Spaces last night.
Aliens and UFOs • 59 • : baablacksheep1 -
1980s Arcade
General Chit Chat • 27 • : alwaysbeenhere2