It looks like you're using an Ad Blocker.
Please white-list or disable AboveTopSecret.com in your ad-blocking tool.
Thank you.
Some features of ATS will be disabled while you continue to use an ad-blocker.

20 new science papers find climate driven by solar changes
page: 18share:
originally posted by: Kashai
a reply to: D8Tee
Elevations in urban areas shown on the map may be higher than actual values due to radar reflections from the tops of buildings and other structures. This would result in flooding being more severe than shown on this map. For an interesting presentation of how sea level rise might impact important cities, see U.S. Cities We Could Lose to the Sea at Climate Central.org.
geology.com...
So I guess 36 years of Data is go enough for you.
All the tidal guages, all over the world show the same thing.
NO ACCELERATION IN SEA LEVEL RISE.
There are some century plus records.
The Battery (Longest USA record)
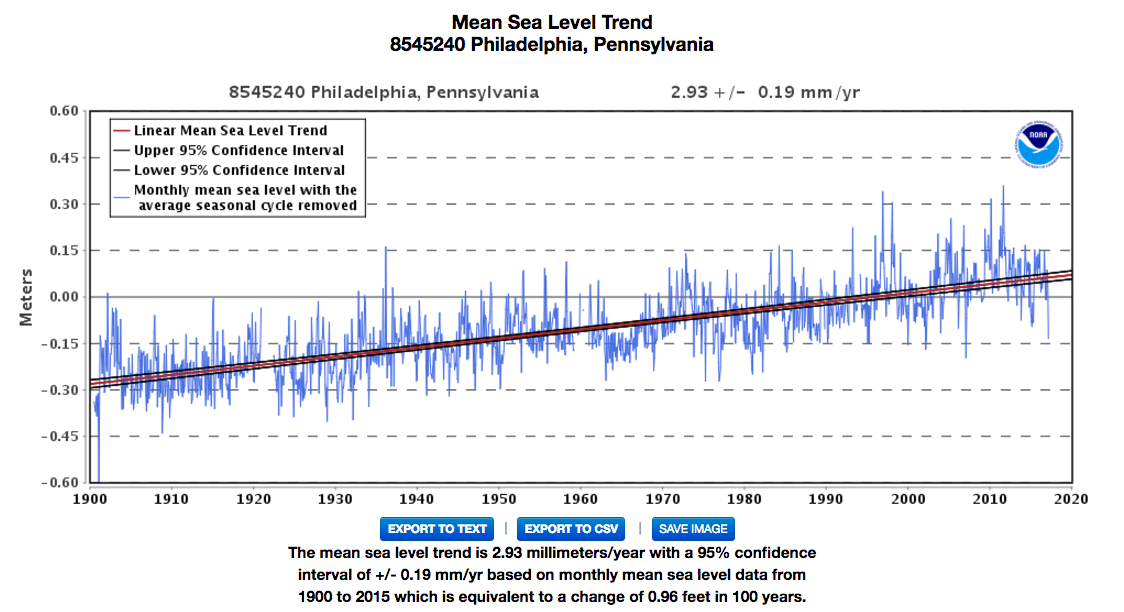
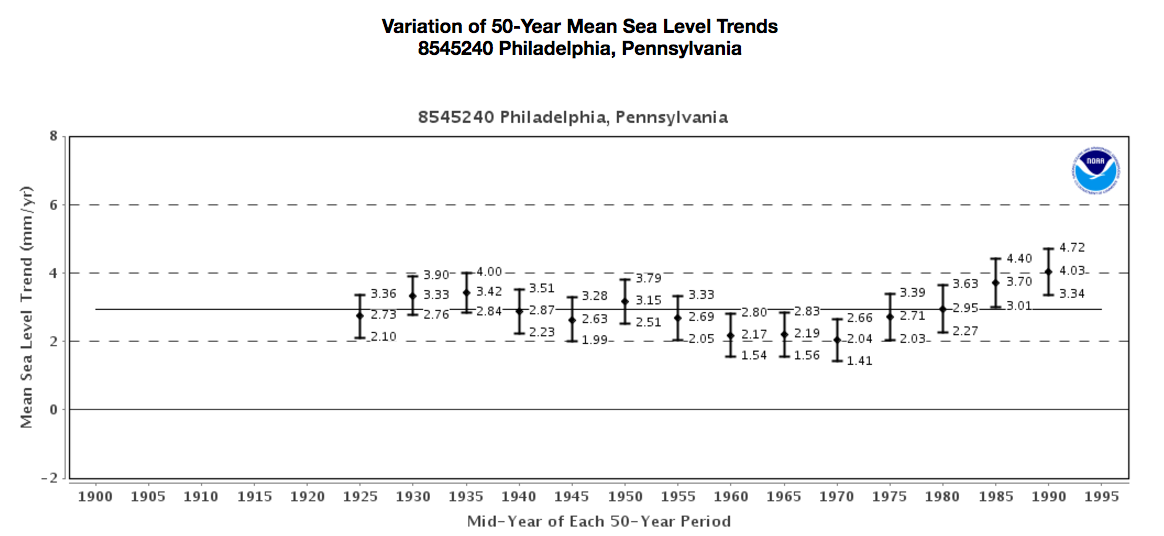
Philadelphia
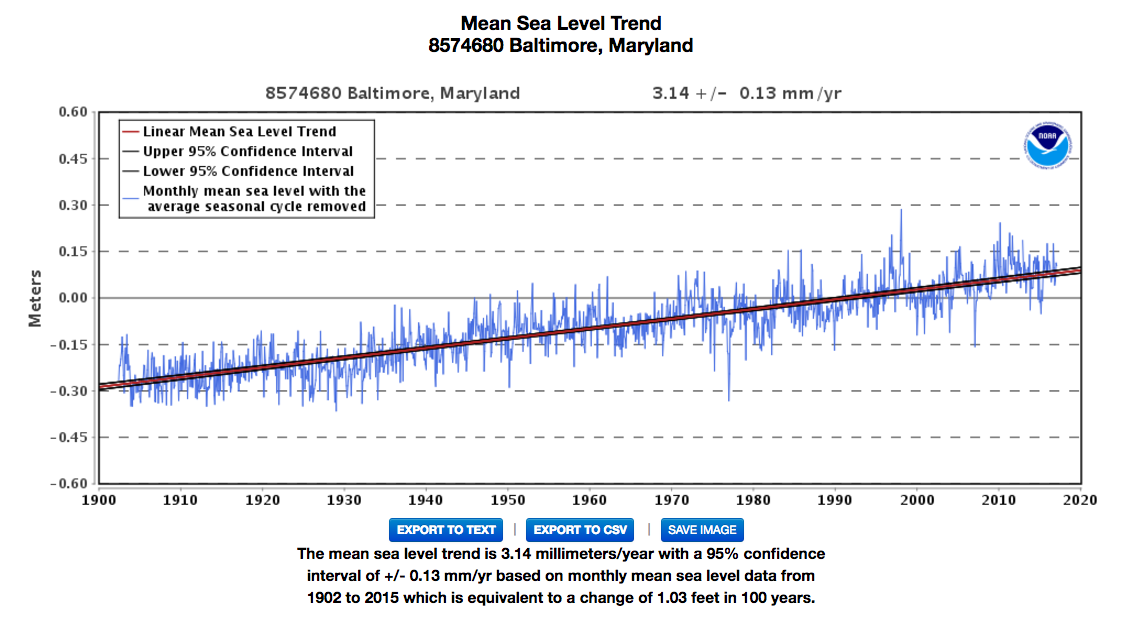
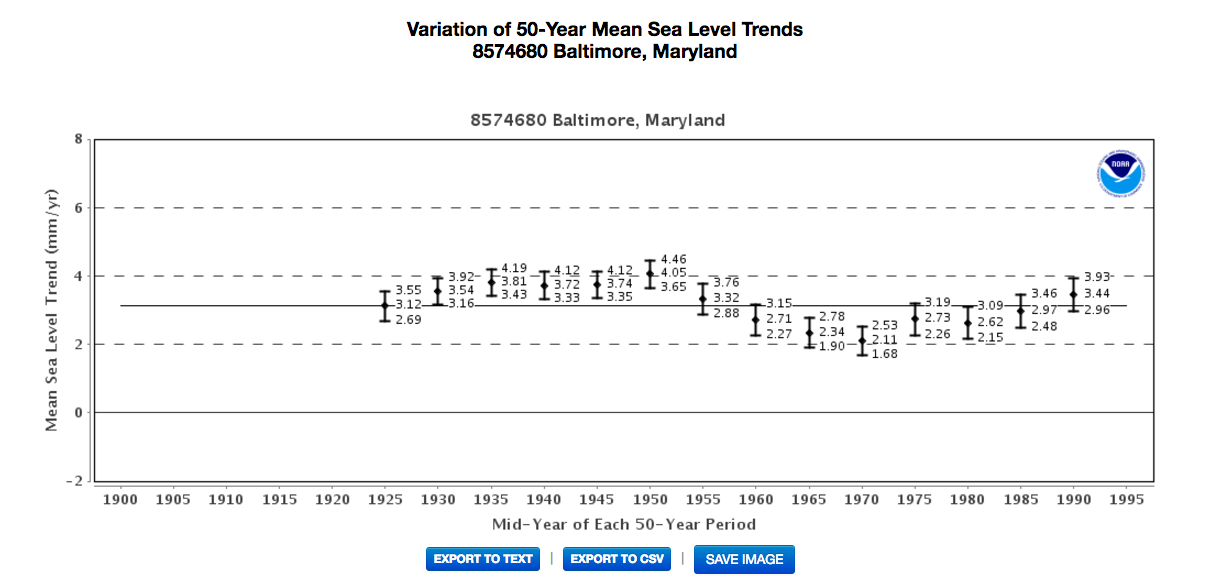
Baltimore
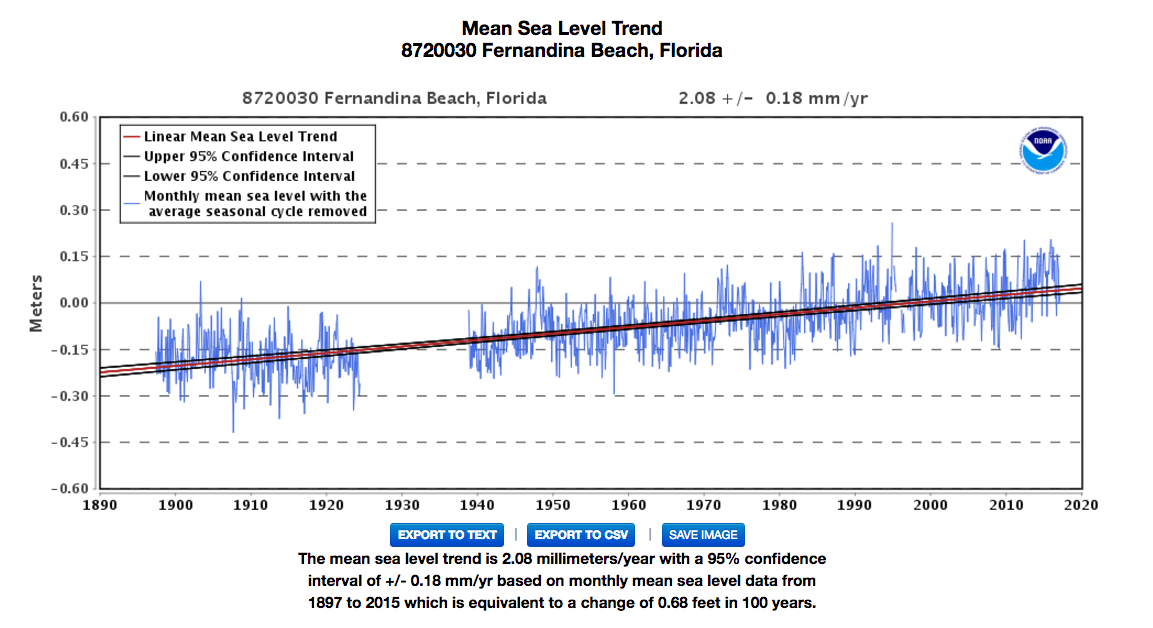
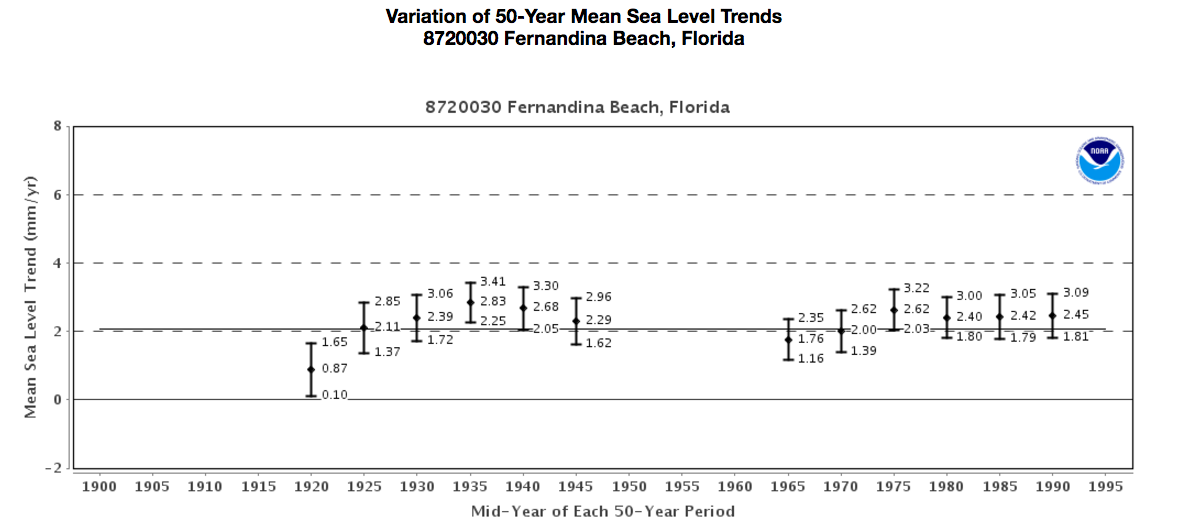
Fernandina Beach
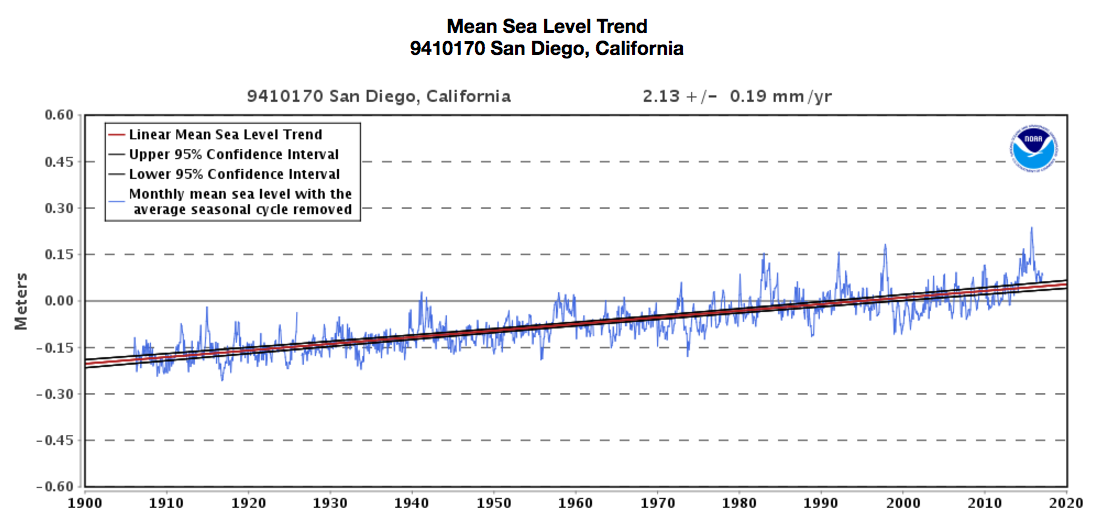
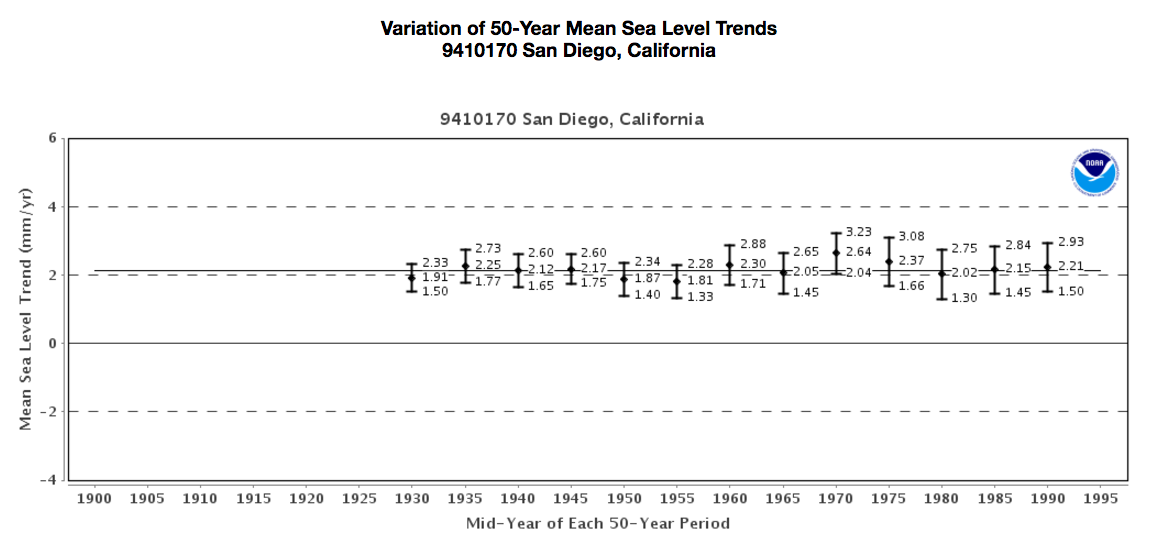
SanDiego
All the rest are here.
NOAA Link
a reply to: D8Tee
So your evidence is that in the Battery they have collected 160 years of Data?
From the link I offered..
en.wikipedia.org...
If you do not get the point perhaps then you should look more into the extent to which 36 year old data of the planet is different than 160 old data about a single Natural Harbor?
So your evidence is that in the Battery they have collected 160 years of Data?
From the link I offered..
The longest NOAA tide gauge data coastal sea level rise measurement record is at The Battery in New York with its 160 year long data record showing a steady rate of sea level rise of about 11 inches per century.
en.wikipedia.org...
If you do not get the point perhaps then you should look more into the extent to which 36 year old data of the planet is different than 160 old data about a single Natural Harbor?
a reply to: Kashai
There are about sixty good-quality, century-long records of sea-level around the world. A couple of them extend back more than 200 years. They all show the same trend, no acceleration in rate of sea level rise.
I'm not sure what you are getting at still.
Where are you getting your 36 year argument?
I need to know why you keep mentioning 36 years please.
a reply to: D8Tee
NOAA data begins in 1970 in that respect I meant 46.
I must be getting tired and it is late for me.
As far as "good quality" records from prior to 1970 what are you talking about exactly?
Given all you claim to know what you claim to know why would "good quality " records present some absolute in relation to your conclusions?
Especially under the circumstances.
edit on 8-5-2017 by Kashai because: Added content
originally posted by: Kashai
a reply to: D8Tee
NOAA data begins in 1970 in that respect I meant 46.
I must be getting tired and it is late for me.
As far as "good quality" records from prior to 1970 what are you talking about exactly?
Given all you claim to know what you claim to know why would "good quality " records present some absolute in relation to your conclusions?
Especially under the circumstances.
The Tidal gauge data does not begin in 1970.
The Tidal Guage data is NOAA data, it goes back MUCH further.
The Tidal Gauge data is not in dispute at all.
It's rock solid.
Satellite altimetry begins in 1993.
edit on 8-5-2017 by D8Tee because: (no reason given)
a reply to: D8Tee
en.wikipedia.org...
en.wikipedia.org...
Have an appointment to go to soon have a goodnight.
Sea-level measurements were made using simple measuring poles or "tide staffs" until around 1830, when self-recording gauges with mechanical floats and stilling wells were introduced.[5] They were the primary means of sea-level measurement for over 150 years and continue to operate at some locations today.
While still part of modern-day tide gauge instrumentation, these technologies have since been superseded by pressure gauges, acoustic gauges or radar gauges.
en.wikipedia.org...
AR5, 2014, indicated that the global mean sea level rise will continue during the 21st century, very likely at a faster rate than observed from 1971 to 2010.[5] Projected rates and amounts vary. A January 2017 NOAA report suggests a range of rise of 0.3 – 2.5 m possible during the 21st century
en.wikipedia.org...
Have an appointment to go to soon have a goodnight.
edit on 8-5-2017 by Kashai because: Added content
edit on 8-5-2017 by Kashai because: Content edit
originally posted by: D8Tee
originally posted by: Kashai
a reply to: D8Tee
NOAA data begins in 1970 in that respect I meant 46.
I must be getting tired and it is late for me.
As far as "good quality" records from prior to 1970 what are you talking about exactly?
Given all you claim to know what you claim to know why would "good quality " records present some absolute in relation to your conclusions?
Especially under the circumstances.
The Tidal gauge data does not begin in 1970.
The Tidal Guage data is NOAA data, it goes back MUCH further.
The Tidal Gauge data is not in dispute at all.
It's rock solid.
Satellite altimetry begins in 1993.
Are you even aware that all of the NOAA tidal data is based on what we call a Semi Empirical Midel? Do you understand the distinction between an Empirical Model and a Semi Empirical Model? Do you understand that there are errors caused by both satellites angular declination(anything above 66' is skewed and the farther off point, the more skewed the data is? Do you understand that a lot of this satellite data is based on measurements near coastal metropolitan cities. Can you describe the effects of skyscrapers on satellite data? Do you know what the effects are or even that there were effects from man made structures on the satellite imagery and measurements? Once again... SEMI Empirical Data. No, your data is not rock solid.
originally posted by: peter vlar
originally posted by: D8Tee
originally posted by: Kashai
a reply to: D8Tee
NOAA data begins in 1970 in that respect I meant 46.
I must be getting tired and it is late for me.
As far as "good quality" records from prior to 1970 what are you talking about exactly?
Given all you claim to know what you claim to know why would "good quality " records present some absolute in relation to your conclusions?
Especially under the circumstances.
The Tidal gauge data does not begin in 1970.
The Tidal Guage data is NOAA data, it goes back MUCH further.
The Tidal Gauge data is not in dispute at all.
It's rock solid.
Satellite altimetry begins in 1993.
Are you even aware that all of the NOAA tidal data is based on what we call a Semi Empirical Midel?
No, it's not. The data is Empirical, the models developed from that data are Semi Empirical Models. Who's We? Maybe you'll have to get your father in law to look at this post and help you out, cause you are thoroughly confused.
Do you understand the distinction between an Empirical Model and a Semi Empirical Model?
Yes, i do.
I'm aware of the sources of error associated with Satellite Altimetry.
Do you understand that there are errors caused by both satellites angular declination(anything above 66' is skewed and the farther off point, the more skewed the data is?
Satellite altimetry data certainly does not include the collection of inland data points. It measures Global Mean Sea level. Therefore the effects of skyscrapers on the Satellite Altimetry data is a big fat zero. I can't believe you would think they are measuring inland data points lol, and you are trying to school me? Makes me chuckle.
Do you understand that a lot of this satellite data is based on measurements near coastal metropolitan cities. Can you describe the effects of skyscrapers on satellite data?
You don't know what you are talking about. This is not satellite imagery, it's satellite altimetry. What man made structures are you talking about, offshore rigs?
Do you know what the effects are or even that there were effects from man made structures on the satellite imagery and measurements? Once again... SEMI Empirical Data.
The tidal gauge dataset that NOAA has is not in dispute.
No, your data is not rock solid.
The most important thing that everyone should know about climate change and sea-level is that there's been no detectable sustained acceleration (increase) in the rate of sea-level rise in over 85 years. All around the world, the best sea-level measurements all show the same thing: an almost perfectly linear trend. Sea-level is rising no faster now, with CO2 at 0.040% of the atmosphere, than it was when CO2 was less than 0.031%.
The Semi Empirical Models developed to predict Global Mean Sea Level that you were attempting to speak to are actually an issue, you just have things confused. The models are developed to predict future sea level rise, and as you know, semi empirical models aren't much good for anything. Give us empirical evidence, thats what is needed. The worlds tidal gauge stations are empirical evidence that there has been no acceleration in the rate of sea level rise.
I have a couple question for you, do you know what Global Mean Sea Level is and why it cannot be used to predict sea level changes along the coast? What is the difference between Tidal Gauge Sea Level and Global Mean Sea Level?
ETA: You realize by disputing the Satellite Altimetry data and Empirical models of GMSL rise, you have switched to being on my side right? Many of your statements were wildly inaccurate, but still, it is good that you question the Semi Empirical models and the Satellite Altimetry, there are good reasons to question it.
edit on 8-5-2017 by D8Tee because: (no reason given)
edit on 8-5-2017 by D8Tee because: (no reason
given)
a reply to: D8Tee
You has a double post.
I you sure you would not like to get into some games of Chess or perhaps like me Billiards also can be very interesting.
You saying that when it comes to pretty much every Scientist that works in every Institution throughout the world, that addresses this topic disagrees with you.
Historically and in so far as I know that is actually not necessarily a "bad" place to be in. But at the same time what your suggesting could be explained by other factors.
Hence the term, "Semi Empirical Model".
Otherwise known in the common as something theoretical.
In evaluation....
en.wikipedia.org...
You has a double post.
I you sure you would not like to get into some games of Chess or perhaps like me Billiards also can be very interesting.
You saying that when it comes to pretty much every Scientist that works in every Institution throughout the world, that addresses this topic disagrees with you.
Historically and in so far as I know that is actually not necessarily a "bad" place to be in. But at the same time what your suggesting could be explained by other factors.
Hence the term, "Semi Empirical Model".
Otherwise known in the common as something theoretical.
In evaluation....
Climate engineering
Main article: Climate engineering
Climate engineering (sometimes called geoengineering or climate intervention) is the deliberate modification of the climate. It has been investigated as a possible response to global warming, e.g. by NASA[217] and the Royal Society.[218] Techniques under research fall generally into the categories solar radiation management and carbon dioxide removal, although various other schemes have been suggested.A study from 2014 investigated the most common climate engineering methods and concluded they are either ineffective or have potentially severe side effects and cannot be stopped without causing rapid climate change.[219]
en.wikipedia.org...
edit on 8-5-2017 by Kashai because: Content edit
a reply to: Kashai
The semi empirical model is referring to the model that indicates accelerating sea level rise.
If you want empirical data, look at the tidal gauge data, it shows no such acceleration.
The NOAA tidal guage data is not in dispute, it is empirical data and indicates no acceleration in sea level rise.
It's the semi empirical models that indicate accerlerating sea levels, not the empirical evidence.
edit on 8-5-2017 by D8Tee because: (no reason given)
originally posted by: Phage
a reply to: OccamsRazor04
I asked for evidence of an increase in total solar irradiance.
Pluto is undergoing global warming, as evidenced by a three-fold increase in the planet's atmospheric pressure during the past 14 years
In regard to Pluto, as I said, very long seasons and a short period of detailed observation.
airandspace.si.edu...
There are times where I suspect you are being purposely dense to stimulate conversation, and other times where I think you are being defensive because of your personal standpoint, but this is just another level of dumb.
The link you provide shows an irregular orbit sure, you know this, i know this. What the link also says, is that Pluto is moving AWAY FROM THE SUN, with it being closer than Neptune in the 80s and 90s. Now that Pluto is further away, and shows 14 years of WARMING UP, what is your take on this info, from the link you provided to counter this heating claim?
A bland request for solar radiance numbers? Bleh. You posted a link about orbits to imply that distance and timing was causing the warming, and yet your very own link disproves this, and you walk away with a stick up your ass like you proved some critical point and are the hero of the day.
ATS really is # sometimes...
edit on 8-5-2017 by Nodrak because: (no reason given)
originally posted by: Kashai
a reply to: D8Tee
NOAA tide gauge coastal sea level rise data measurements encompassing the 46 year period from 1970 through 2016 do not support and in fact clearly contradict the UN IPCC AR5 WG1 conclusion regarding supposed man made contributions to increasing rates of sea level rise since the early 1970s.
wattsupwiththat.com...
You and Peter both need to reread the article that you linked, neither of you understood it.
Notice the title?
Dialing back the 10 foot hype – NOAA Tide Gauge Data shows no coastal sea level rise acceleration
edit on 8-5-2017 by D8Tee because: (no reason given)
a reply to: Nodrak
I post this link because it's slightly unusual.
It lists ATS as a source!
First time I've seen that lol.
Entire solar system heating up
Here's the ATS link they referenced:
Link
I post this link because it's slightly unusual.
It lists ATS as a source!
First time I've seen that lol.
Entire solar system heating up
Another affirmation of solar change comes from Pluto. Pluto resides on the icy outskirts of the solar system near a giant shell of astronomical bodies know as the Oort Cloud. Although Pluto resides in the coolest regions of the solar system, the dwarf planet is heating up. Specifically, Pluto’s atmospheric pressure has increased by 300 percent, which is more than any other planet in the solar system. Even more paradoxical, Pluto’s atmosphere is becoming denser as it travels farther away from the sun. Due to this, scientists suspect Pluto is at the forefront of a high energy region of the galaxy that the solar system is beginning to reside in.
Their is no doubt that human activity is impacting climate change. Nevertheless, there are other forces outside the solar system that are effecting climate inside the solar system. Whatever the case may be, Earth can expect a rough ride as it travels through foreign warm waters.
Sources include:
(1)TheEventChronicle.com
(2)AboveTopSecret.com
Here's the ATS link they referenced:
Link
edit on 8-5-2017 by D8Tee because: (no reason given)
edit on 8-5-2017 by D8Tee because: (no reason given)
a reply to: D8Tee
Actually you really should research the data that has been offered to you prior to such a position.
You know when it gets to the really cool stuff in modern science?
Into an open mind is investigated in relation to those type of jobs.
That investigation if you hired can add to you resume.
Actually you really should research the data that has been offered to you prior to such a position.
You know when it gets to the really cool stuff in modern science?
Into an open mind is investigated in relation to those type of jobs.
That investigation if you hired can add to you resume.
edit on 8-5-2017 by Kashai because: Added Content
new topics
-
Hate makes for strange bedfellows
US Political Madness: 56 minutes ago -
Who guards the guards
US Political Madness: 3 hours ago -
Has Tesla manipulated data logs to cover up auto pilot crash?
Automotive Discussion: 5 hours ago -
whistleblower Captain Bill Uhouse on the Kingman UFO recovery
Aliens and UFOs: 10 hours ago
top topics
-
Lawsuit Seeks to ‘Ban the Jab’ in Florida
Diseases and Pandemics: 17 hours ago, 23 flags -
CIA botched its handling of sexual assault allegations, House intel report says
Breaking Alternative News: 15 hours ago, 11 flags -
whistleblower Captain Bill Uhouse on the Kingman UFO recovery
Aliens and UFOs: 10 hours ago, 10 flags -
Who guards the guards
US Political Madness: 3 hours ago, 7 flags -
Hate makes for strange bedfellows
US Political Madness: 56 minutes ago, 6 flags -
1980s Arcade
General Chit Chat: 12 hours ago, 5 flags -
Teenager makes chess history becoming the youngest challenger for the world championship crown
Other Current Events: 14 hours ago, 4 flags -
Deadpool and Wolverine
Movies: 13 hours ago, 4 flags -
Has Tesla manipulated data logs to cover up auto pilot crash?
Automotive Discussion: 5 hours ago, 2 flags
active topics
-
Candidate TRUMP Now Has Crazy Judge JUAN MERCHAN After Him - The Stormy Daniels Hush-Money Case.
Political Conspiracies • 657 • : Threadbarer -
"We're All Hamas" Heard at Columbia University Protests
Social Issues and Civil Unrest • 222 • : FlyersFan -
1980s Arcade
General Chit Chat • 13 • : Bluntone22 -
British TV Presenter Refuses To Use Guest's Preferred Pronouns
Education and Media • 110 • : Annee -
Michael Avenatti Says He Will Testify FOR Trump
US Political Madness • 61 • : JadedGhost -
Hate makes for strange bedfellows
US Political Madness • 6 • : network dude -
Who guards the guards
US Political Madness • 2 • : budzprime69 -
New whistleblower Jason Sands speaks on Twitter Spaces last night.
Aliens and UFOs • 41 • : baablacksheep1 -
whistleblower Captain Bill Uhouse on the Kingman UFO recovery
Aliens and UFOs • 11 • : baablacksheep1 -
IDF Intel Chief Resigns Over Hamas attack
Middle East Issues • 37 • : TheWoker