It looks like you're using an Ad Blocker.
Please white-list or disable AboveTopSecret.com in your ad-blocking tool.
Thank you.
Some features of ATS will be disabled while you continue to use an ad-blocker.

Climate change would swamp Trump’s border wall
page: 7share:
This may not affect the wall or the Rio Grande, but somewhere on this thread someone said the sea isn't rising.
I just wanted to say...that According to NOAA
Global sea level has been rising over the past century, and the rate has increased in recent decades. In 2014, global sea level was 2.6 inches above the 1993 average—the highest annual average in the satellite record (1993-present). Sea level continues to rise at a rate of about one-eighth of an inch per year.
And this appears to be an issue for several US cities including in Florida. I forget whether is was Miami or Orlando, but sea level rise is flooding streets without any rain. They're spending a lot of tax payer dollars to raise or build up some streets and to install pumping stations throughout.
edit on 11-4-2017 by amazing because: (no reason given)
a reply to: amazing
Have you even read the last several posts?
Where was that said?
but somewhere on this thread someone said the sea isn't rising.
Source?
And this appears to be an issue for several US cities including in Florida
Have you even read the last several posts?
edit on 11-4-2017 by D8Tee because: (no reason given)
originally posted by: D8Tee
a reply to: amazing
Where was that said?
but somewhere on this thread someone said the sea isn't rising.
Source?
And this appears to be an issue for several US cities including in Florida
Have you even read the last several posts?
It's all over. Here's one article. It was Miami Beach.
www.miamiherald.com...
and yeah the one part of my quote that says sea level rise has accelerated in recent decades. I thought that was important. Especially after reading the last several posts.
edit on 11-4-2017 by amazing because: (no reason given)
a reply to: amazing
From your source:
The tidal gauges show no increase in the rate of sea level rise.
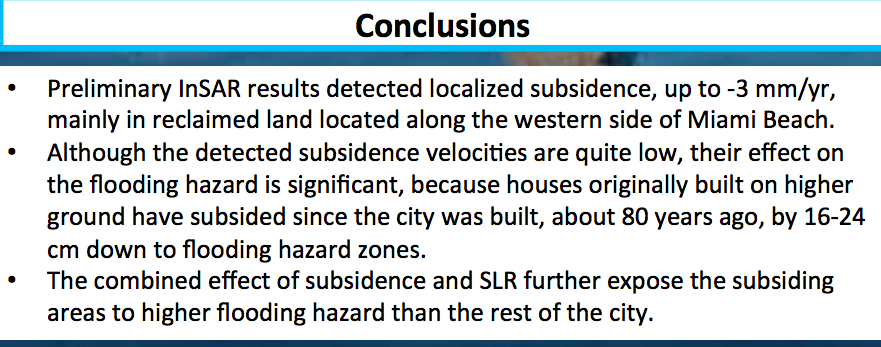
Florida has an accelerated rate of sea level rise due to land subsidence, is that going to get blamed on C02 as well?
From your source:
But one corner of Miami Beach stayed perfectly dry. In Sunset Harbour, which has historically flooded during seasonal high tides.
Any Beach old-timer will tell you the city has flooded for decades during king tides — the same thing happens in much of low-lying Florida. But all the data and tide gauges confirm it’s getting worse.
The tidal gauges show no increase in the rate of sea level rise.
Florida has an accelerated rate of sea level rise due to land subsidence, is that going to get blamed on C02 as well?
a reply to: amazing
This satellite data is not supported by the tidal gauges which continue to show the same rate of rise that they have for the last couple centuries.
Satellite altimetry now indicates a global sea level trend of over 3 mm/yr since 1993.
yeah the one part of my quote that says sea level rise has accelerated in recent decades. I thought that was important. Especially after reading the last several posts.
This satellite data is not supported by the tidal gauges which continue to show the same rate of rise that they have for the last couple centuries.
originally posted by: D8Tee
a reply to: amazing
From your source:
But one corner of Miami Beach stayed perfectly dry. In Sunset Harbour, which has historically flooded during seasonal high tides.
Any Beach old-timer will tell you the city has flooded for decades during king tides — the same thing happens in much of low-lying Florida. But all the data and tide gauges confirm it’s getting worse.
The tidal gauges show no increase in the rate of sea level rise.
Florida has an accelerated rate of sea level rise due to land subsidence, is that going to get blamed on C02 as well?
Looks like Sea lever rise to me, since we know the sea level is rising. If you research it you'll see that scientists are attributing most of the flooding to sea level rise and not land subsidence.
a reply to: amazing
Link
Yes we know the sea level is rising, we have known that for 200 years, the rate has not changed according to the tidal gauges.
Looks like Sea lever rise to me, since we know the sea level is rising.
No, you will find that it is a combination of the two. Miami Beach is actually sinking faster than the sea level is rising, complicating the issue. Reading headlines from the MSM is not quality research.
If you research it you'll see that scientists are attributing most of the flooding to sea level rise and not land subsidence.
Link
originally posted by: D8Tee
a reply to: amazing
Yes we know the sea level is rising, we have known that for 200 years, the rate has not changed according to the tidal gauges.
Looks like Sea lever rise to me, since we know the sea level is rising.
No, you will find that it is a combination of the two. Miami Beach is actually sinking faster than the sea level is rising, complicating the issue. Reading headlines from the MSM is not quality research.
If you research it you'll see that scientists are attributing most of the flooding to sea level rise and not land subsidence.
Link
I just read an article by a couple of scientists telling me that sea level rise was most of the problem with a small portion due to land sinking. Who should I believe? You or... some actual scientists? I'm going with the scientists. Reading headlines from right leaning media sources is not quality research. Also the rate of sea level rise has changed according to scientists. That's what they said. LOL Serious.
edit on
11-4-2017 by amazing because: (no reason given)
edit on 11-4-2017 by amazing because: (no reason given)
a reply to: amazing
All depends on the location you are at. Did you know sea level is not rising everywhere? That it is in fact falling at some locations?
What right leaning media sources have I been linking to?
I've been linking to NOAA and the IPCC for the most part.
It is irresponsible for media outlets to report that the rate of sea level rise is on the increase, it is simply not the case according to the tidal stations.
With regards to the satellite data, I will let the project responsible for the data speak for itself.
sealevel.colorado.edu...
Where is your article?
I just read an article by a couple of scientists telling me that sea level rise was most of the problem with a small portion due to land sinking.
All depends on the location you are at. Did you know sea level is not rising everywhere? That it is in fact falling at some locations?
What right leaning media sources have I been linking to?
I've been linking to NOAA and the IPCC for the most part.
It is irresponsible for media outlets to report that the rate of sea level rise is on the increase, it is simply not the case according to the tidal stations.
With regards to the satellite data, I will let the project responsible for the data speak for itself.
sealevel.colorado.edu...
Why is the GMSL different than local tide gauge measurements?
The global mean sea level (GMSL) we estimate is an average over the oceans (limited by the satellite inclination to ± 66 degrees latitude), and it cannot be used to predict relative sea level changes along the coasts. As an average, it indicates the general state of the sea level across the oceans and not any specific location. Local tide gauges measure the sea level at a single location relative to the local land surface, a measurement referred to as "relative sea level" (RSL). Because the land surfaces are dynamic, with some locations rising (e.g., Hudson Bay due to GIA) or sinking (e.g., New Orleans due to subsidence), relative sea level changes are different across world coasts. To understand the relative sea level effects of global oceanic volume changes (as estimated by the GMSL) at a specific location, issues such as GIA, tectonic uplift, and self attraction and loading (SAL, e.g., Tamisiea et al., 2010), must also be considered.
We do compare the altimeter sea level measurements against a network tide gauges to discover and monitor drift in the satellite (and sometimes tide gauge) measurements. This is discussed further in the tide gauge discussion.
GMSL is a good indicator of changes in the volume of water in the oceans due to mass influx (e.g., land ice melt) and density changes (e.g., thermal expansion), and is therefore of interest in detecting climate change.
edit on 11-4-2017 by D8Tee because: (no reason
given)
originally posted by: amazing
a reply to: D8Tee
I'm also saying that scientists are saying that it's increased in the last few decades.
I'm not making any of that up. I also quoted NOAA.
I also quoted NOAA
I'm not disagreeing with you, the sea level is rising, has been for a long time.
The ground is also sinking in some places and rising at other places.
All I'm saying is that sea level rise is happening. and it's impacting some cities and areas already.
Are you attributing that to climate change?
Because the data shows no increase in the rate of sea level change for the past 160 years, how is that possible if it's linked to C02 levels?
It's natural processes, been happening since long before the rise in C02 levels.
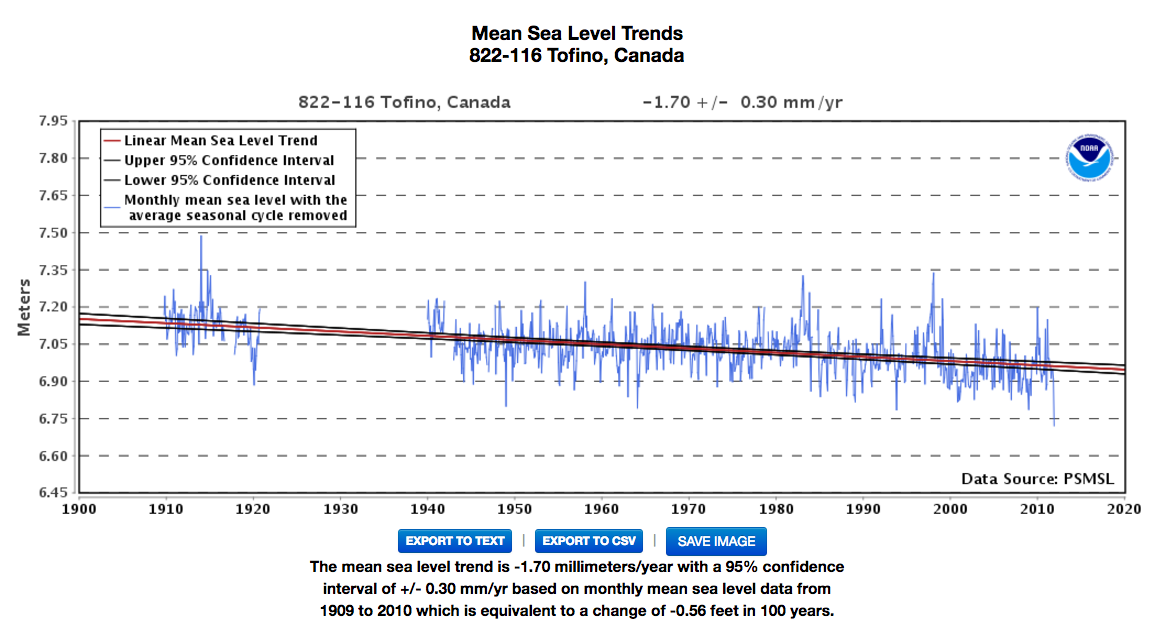
Tofino's falling sea level is not connected to C02 now is it?
edit on 11-4-2017 by D8Tee because: (no reason given)
originally posted by: D8Tee
originally posted by: amazing
a reply to: D8Tee
I'm also saying that scientists are saying that it's increased in the last few decades.
I'm not making any of that up. I also quoted NOAA.
I also quoted NOAA
I'm not disagreeing with you, the sea level is rising, has been for a long time.
The ground is also sinking in some places and rising at other places.
All I'm saying is that sea level rise is happening. and it's impacting some cities and areas already.
Are you attributing that to climate change?
Because the data shows no increase in the rate of sea level change for the past 160 years, how is that possible if it's linked to C02 levels?
It's natural processes, been happening since long before the rise in C02 levels.
Tofino's falling sea level is not connected to C02 now is it?
I've been reading some articles recently that state that. The NOAA article I quoted said that sea level rise has accelerated due to global warming. Here's an article from a Japanese scientist saying the same thing
www.ncbi.nlm.nih.gov...
Am I on the right track to finding the truth?
a reply to: amazing
Yes on the right track.
I will add that the latest IPCC fifth report has a range of 28-98 cm across all scenarios possible by the year 2100.
So yes, the world has to prepare for rising sea levels.
If the current trend of 1.7 mm a year for the tidal gauges stays constant that is 14 centimeters along the coastlines by the year 2100. Are we really concerned with Global Mean Sea Level is it does not affect the coast? I say pay attention to the tidal gauge data, it's what will be flooding our coasts.
Now, when they note the acceleration from 1993, remember, that is their satellite data (GMSL), not the tidal gauges which show no acceleration. As previously noted in the post up a couple from this one, that data cannot be applied to the coast, its from the providers of the data themselves, I am not making that up. It does not correlate with the tidal gauges which is what we are concerned with. Now, if the tidal gauges are not showing an acceleration in sea level rise, which they aren't, is there really a change in the rate of rise, or is it a case of a comparing it with a different data set which most people are not aware of?
I mean really, who knew that GMSL does not mean a rise at the tidal stations where it counts?
How can they not tell us that the increase is due to them measuring GMSL via satellite in these most recent years that account for the rate of change, not tell us they changed the game and quit using the tidal guage data?
Yes on the right track.
The IPCC has published four major assessment reports since its establishment in 1988. The future sea-level rises by 2100 projected in the First to Fourth Assessment Reports are 31–110 cm (Business as usual scenario), 13–94 cm, 9–88 cm and 18–59 cm, respectively
I will add that the latest IPCC fifth report has a range of 28-98 cm across all scenarios possible by the year 2100.
So yes, the world has to prepare for rising sea levels.
If the current trend of 1.7 mm a year for the tidal gauges stays constant that is 14 centimeters along the coastlines by the year 2100. Are we really concerned with Global Mean Sea Level is it does not affect the coast? I say pay attention to the tidal gauge data, it's what will be flooding our coasts.
Now, when they note the acceleration from 1993, remember, that is their satellite data (GMSL), not the tidal gauges which show no acceleration. As previously noted in the post up a couple from this one, that data cannot be applied to the coast, its from the providers of the data themselves, I am not making that up. It does not correlate with the tidal gauges which is what we are concerned with. Now, if the tidal gauges are not showing an acceleration in sea level rise, which they aren't, is there really a change in the rate of rise, or is it a case of a comparing it with a different data set which most people are not aware of?
I mean really, who knew that GMSL does not mean a rise at the tidal stations where it counts?
How can they not tell us that the increase is due to them measuring GMSL via satellite in these most recent years that account for the rate of change, not tell us they changed the game and quit using the tidal guage data?
edit on 11-4-2017 by D8Tee because: (no reason given)
a reply to: D8Tee
First off. Yes the NOAA DOES agree with me. I posted an NOAA link that says that the sea level is rising at an increasing rate. You keep ignoring that to talk to me about linear trends.
So you don't see a rate of sea level increase in that chart you just provided? Because I do. Again, this is rate of change we are talking about here.
Climate Change: Global Sea Level - NOAA link
Sea level has been rising over the past century, and the rate has increased in recent decades. In 2014, global sea level was 2.6 inches (67 mm) above the 1993 average—the highest annual average in the satellite record (1993-present). Sea level continues to rise at a rate of about one-eighth of an inch (3.2 mm) per year, due to a combination of melting glaciers and ice sheets, and thermal expansion of seawater as it warms.
edit
on 12-4-2017 by Krazysh0t because: (no reason given)
a reply to: D8Tee
Question. Do you know what "rate of change" means? Because you have DEFINITELY posted graphs where the rate of change has increased. Your final graph is very definitive. The rate of change shoots up dramatically from about 1970 to present in your final graph. There is an a rather obvious curve at 1970.
Question. Do you know what "rate of change" means? Because you have DEFINITELY posted graphs where the rate of change has increased. Your final graph is very definitive. The rate of change shoots up dramatically from about 1970 to present in your final graph. There is an a rather obvious curve at 1970.
edit on 12-4-2017 by Krazysh0t because: (no reason given)
originally posted by: Krazysh0t
a reply to: D8Tee
First off. Yes the NOAA DOES agree with me. I posted an NOAA link that says that the sea level is rising at an increasing rate. You keep ignoring that to talk to me about linear trends.
So you don't see a rate of sea level increase in that chart you just provided? Because I do. Again, this is rate of change we are talking about here.
Climate Change: Global Sea Level - NOAA link
Sea level has been rising over the past century, and the rate has increased in recent decades. In 2014, global sea level was 2.6 inches (67 mm) above the 1993 average—the highest annual average in the satellite record (1993-present). Sea level continues to rise at a rate of about one-eighth of an inch (3.2 mm) per year, due to a combination of melting glaciers and ice sheets, and thermal expansion of seawater as it warms.
Are you interested in Tidal gauges or Satellite data?
You are aware that Global Mean Sea Level, which is what the satellites report, cannot be used to predict relative sea level changes along the coasts.?
Like I mentioned a long time ago, if you wish to bring the satellite data into play, lets discuss that.
Why do we care what the GMSL is if it cannot be used to predict relative sea level changes along the coasts.?
Which graph is that, the one for Tofino Canada is the last one I posted and it definitely shows that the sea level there is DECREASING?
Your final graph is very definitive. The rate of change shoots up dramatically from about 1970 to present in your final graph. There is an a rather obvious curve at 1970.
The University of Colorado is where the main center for the satellite data collection and manipulation. Here's on of their most recent papers.
Is the detection of accelerated sea level rise imminent?
Global mean sea level rise estimated from satellite altimetry provides a strong constraint on climate variability and change and is expected to accelerate as the rates of both ocean warming and cryospheric mass loss increase over time. In stark contrast to this expectation however, current altimeter products show the rate of sea level rise to have decreased from the first to second decades of the altimeter era. Here, a combined analysis of altimeter data and specially designed climate model simulations shows the 1991 eruption of Mt Pinatubo to likely have masked the acceleration that would have otherwise occurred. This masking arose largely from a recovery in ocean heat content through the mid to late 1990 s subsequent to major heat content reductions in the years following the eruption. A consequence of this finding is that barring another major volcanic eruption, a detectable acceleration is likely to emerge from the noise of internal climate variability in the coming decade.
edit on 12-4-2017 by
D8Tee because: (no reason given)
a reply to: D8Tee
Here’s a simpler view of the difference in measurements between satellites and tide gauges. If you look at NASA’s “Vital Signs” website, there are two graphs of sea level.
climate.nasa.gov...
The top graph is satellite (3.4 mm/yr) and the bottom one is tide gauge (conveniently, with no rate listed but it works out to about 1.5 mm/yr or less than half the satellite value). They overlap for 7 years between 1993 and 2000. Notice there is no change in the trend line in either graph during that 7 year period; in other words, no acceleration of sea level rise. And after 2000, the satellite graph shows essentially no (or negligible) acceleration in sea level rise. But they report different trends (3.4 mm/yr vs 1.5 mm/yr).
Nowhere on either graph is there an acceleration of sea level rise from 1.5 mm/yr to 3.4 mm/yr. They are simply reporting different numbers for the same trend, which means there is a discrepancy that needs to be explained. Either the satellite data is wrong or the tide gauge data is wrong or they’re both wrong, but nowhere is there any dramatic acceleration of sea level rise as widely claimed.
The rather marked difference between the two data sets has still no broadly accepted explanation, but some of the difference is likely due to administrative changes introduced into the raw data obtained by satellites. Se the paragraph below on temporal stability of the satellite-derived data.
Another factor that may explain some of the difference between tide-gauge and satellite data is probably that while any temperature-driven volumen expansion is recorded by the satellites, this change is not affecting tide-gauges at coastal locations, as the water depth here decreases towards zero.
edit on 12-4-2017 by D8Tee because: (no reason given)
originally posted by: D8Tee
Are you interested in Tidal gauges or Satellite data?
I'm interested in all data, but mostly the most accurate data.
You are aware that Global Mean Sea Level, which is what the satellites report, cannot be used to predict relative sea level changes along the coasts.?
Yes, but I've been talking about global sea levels increasing from the beginning. You are the one trying to narrow the scope of the discussion to just coastal levels.
Which graph is that, the one for Tofino Canada is the last one I posted and it definitely shows that the sea level there is DECREASING?
This one
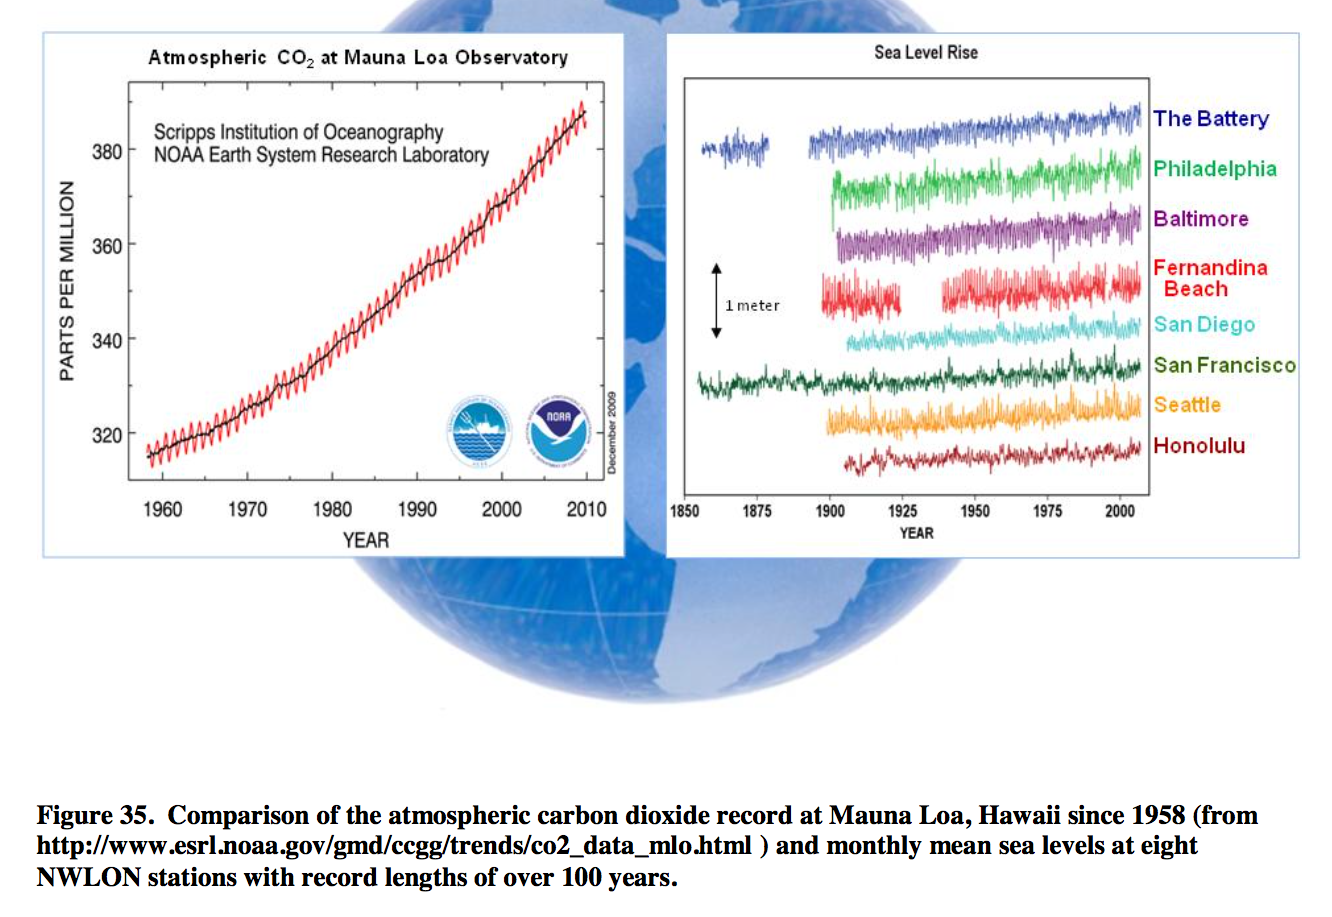
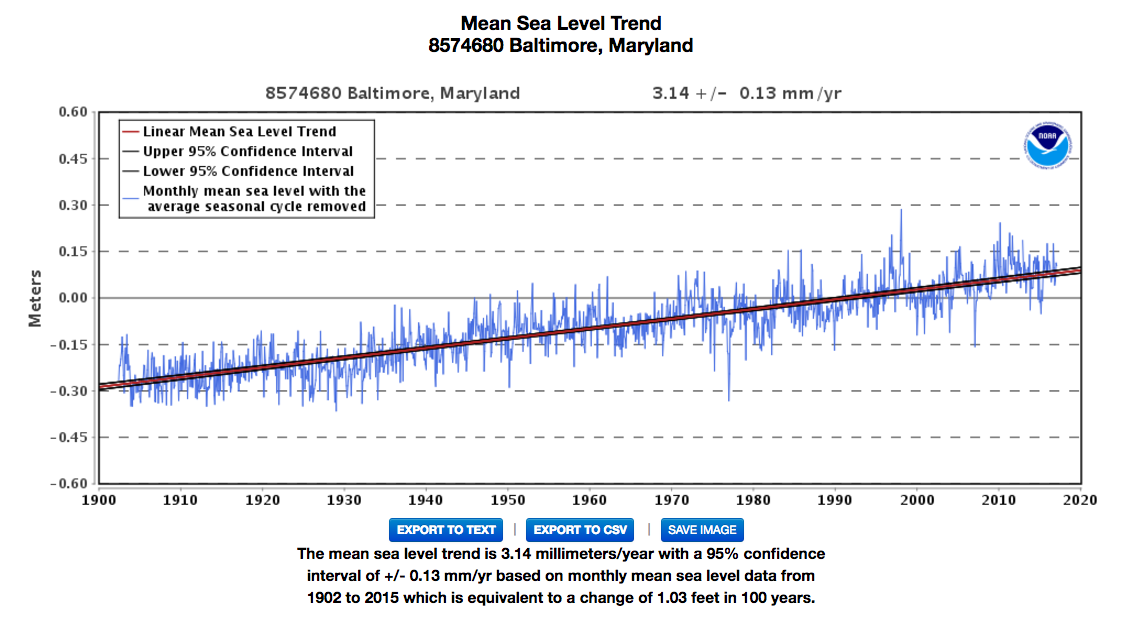
I see a rather obvious curve in the sea level graphs that indicates the derivatives are increasing. The Baltimore one is especially noticeable.
The University of Colorado is where the main center for the satellite data collection and manipulation. Here's on of their most recent papers.
Is the detection of accelerated sea level rise imminent?
Out of curiosity, what do you think that link you just quoted said? Because what I read was that a volcano masked sea rise level in 1991 and baring another volcano eruption the sea level will be rising noticeably in the coming decade.
edit on 13-4-2017 by Krazysh0t because: (no reason
given)
a reply to: Krazysh0t
No one can 'fiddle' with the tidal gauge data, the coast guard would become involved and stop it.
With satellite data, they can add a GIA 0.3 mm in 2012 and call it a GIA adjustment and nobody can say much about that.
There's been other adjustments to the data as well over time, always up...
Oh? I don't see any obvious changes.
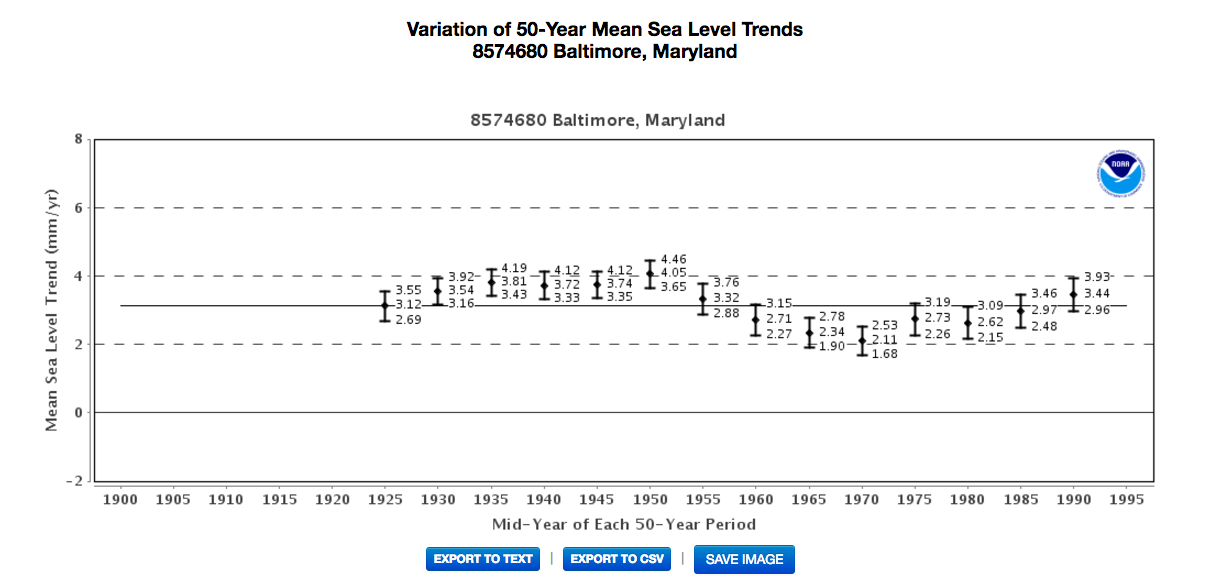
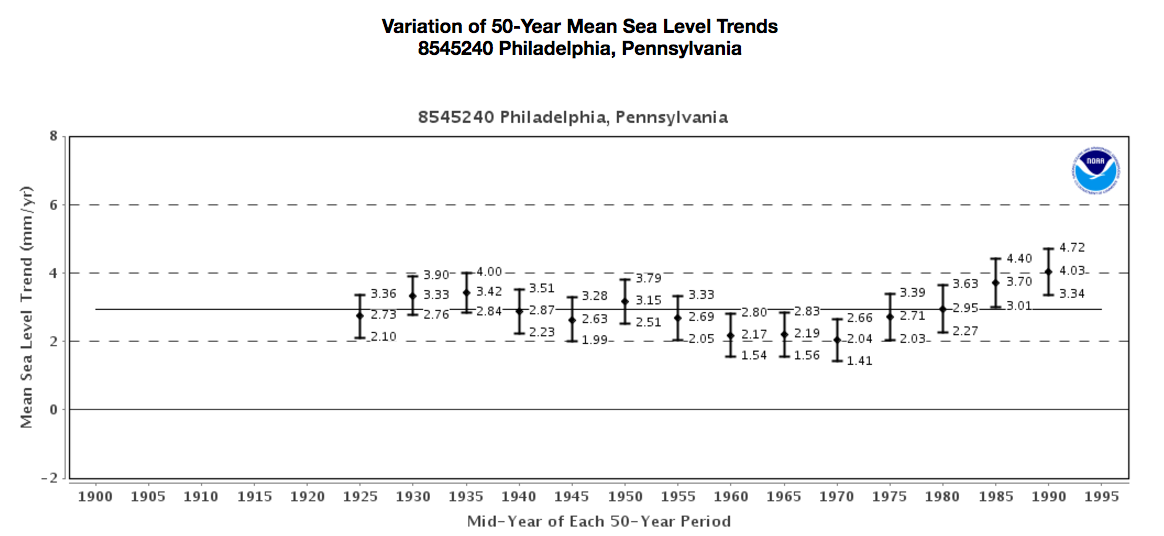
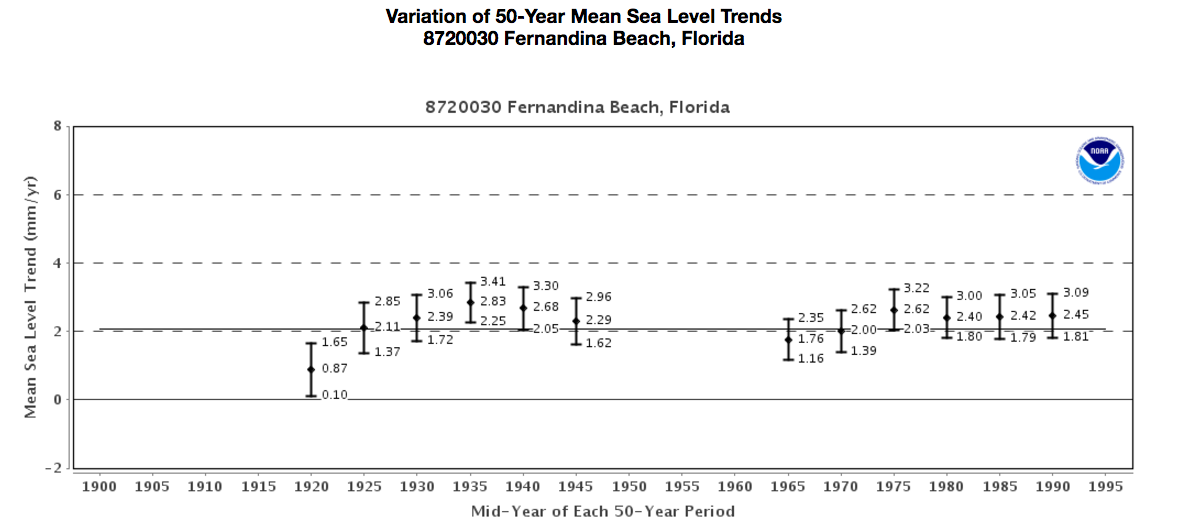
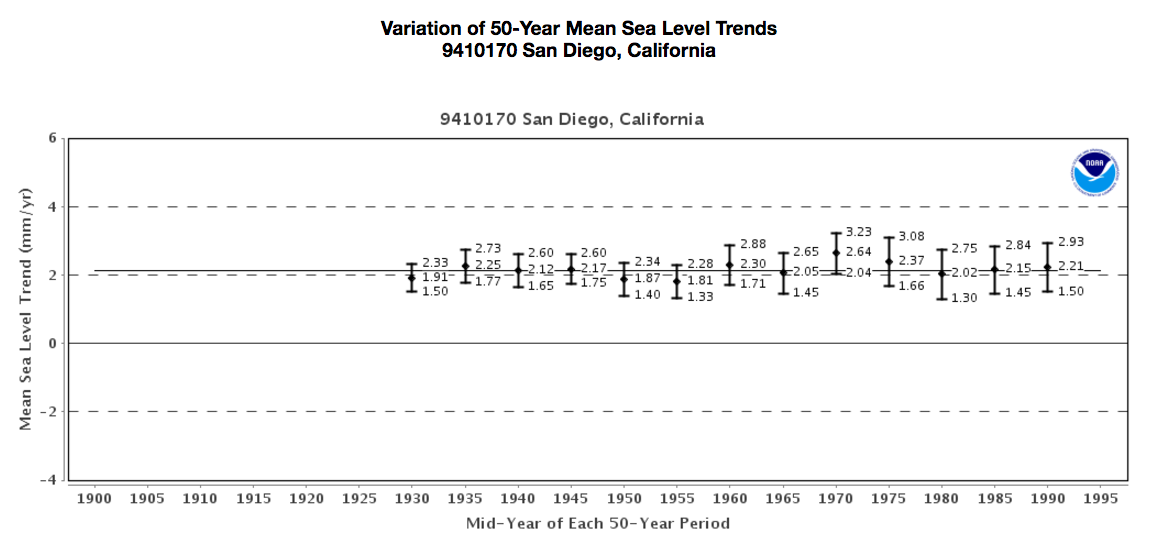
Can you spot the changes in the Variation of 50-Year Mean Sea Level Trends?
Looks like normal variation to me.
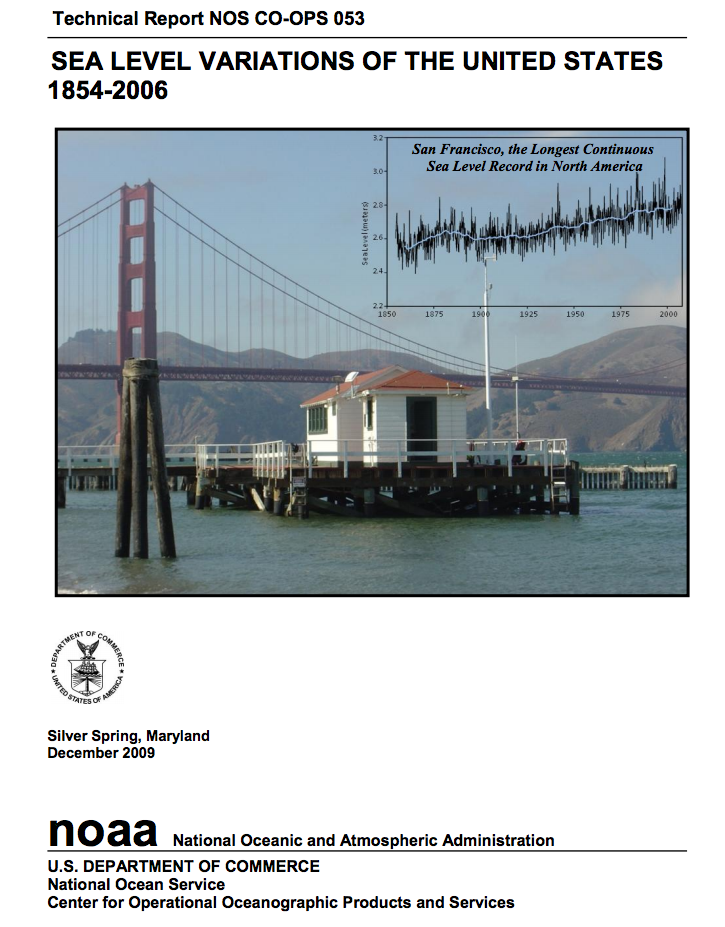
The Battery (Longest USA record)
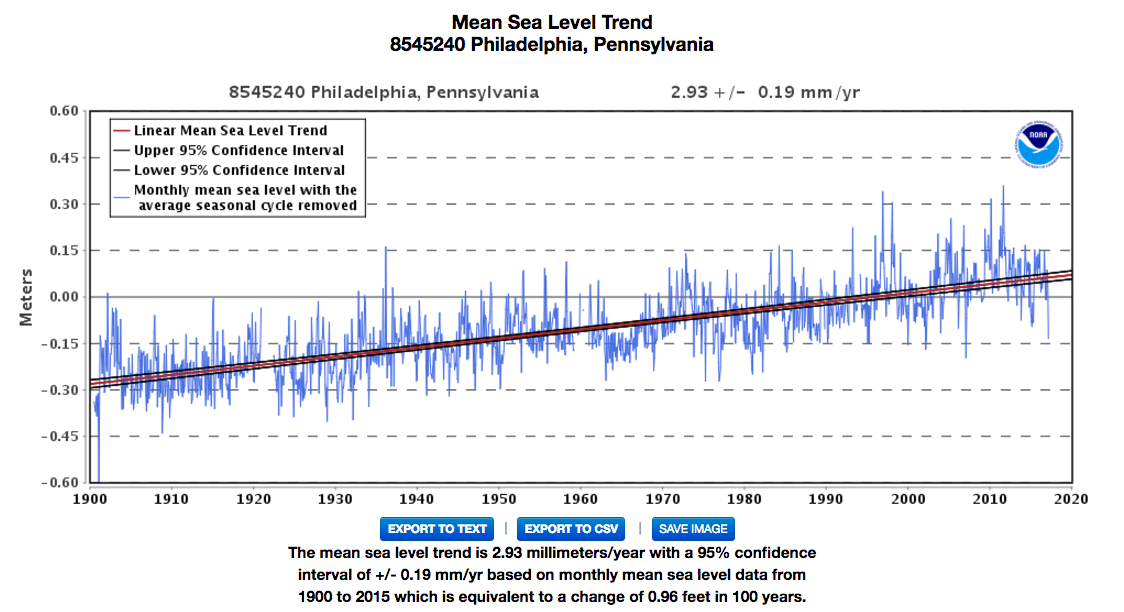
Philadelphia
Baltimore
Fernandina Beach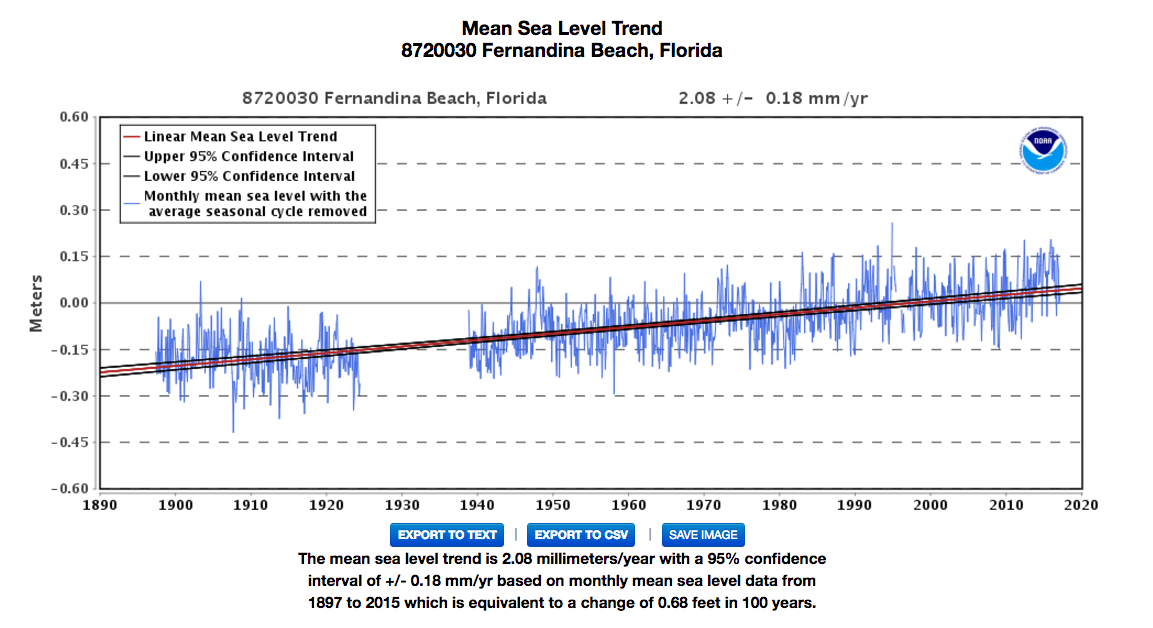
SanDiego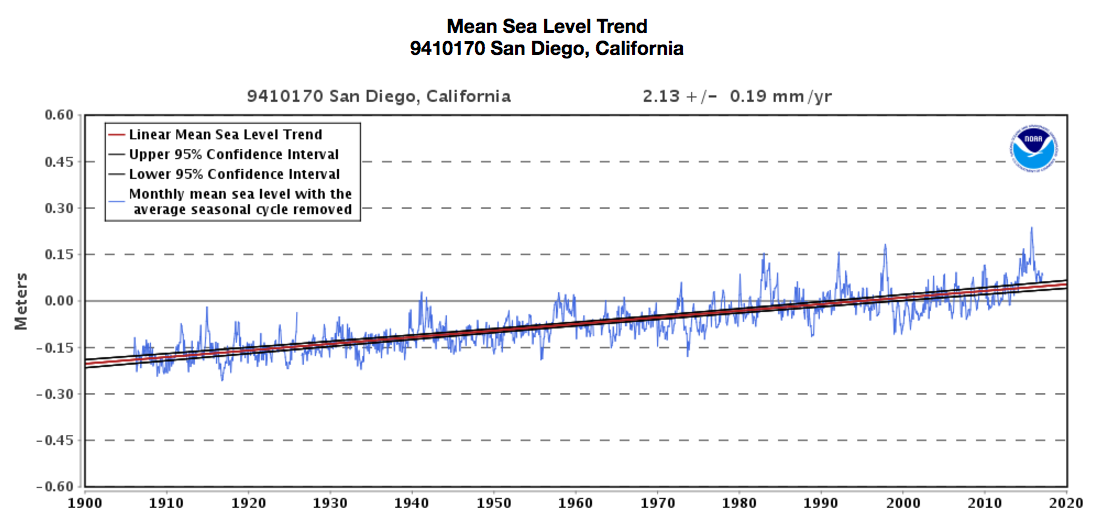
All the rest are here.
NOAA Link
You want my opinion?
They are making excuses and would love to see the tidal gages data go away, it does not correlate well with the models.
excerpts from the paper:
Think of it this way, GMSL measures the amount of water in the oceans, Tidal gauges show the rise that will affect the actual coast. Both may be accurate measurements, but they are apples to oranges comparisons. We are interested if there has been an appreciable change in the rate of rise of either.
I'm interested in all data, but mostly the most accurate data.
No one can 'fiddle' with the tidal gauge data, the coast guard would become involved and stop it.
With satellite data, they can add a GIA 0.3 mm in 2012 and call it a GIA adjustment and nobody can say much about that.
There's been other adjustments to the data as well over time, always up...
It was your contention that coastal areas will be flooded and there will soon be millions of climate refugees, the data does not support this. There are about sixty good-quality, century-long records of sea-level around the world. A couple of them extend back more than 200 years. We have how many years of satellite data? The scientists releasing the data are telling us it is a measure of the volume of water in the oceans and cannot be used to predict sea level rise at coastal areas.
Yes, but I've been talking about global sea levels increasing from the beginning. You are the one trying to narrow the scope of the discussion to just coastal levels.
This one
I see a rather obvious curve in the sea level graphs that indicates the derivatives are increasing. The Baltimore one is especially noticeable.
Oh? I don't see any obvious changes.
Can you spot the changes in the Variation of 50-Year Mean Sea Level Trends?
Looks like normal variation to me.
The Battery (Longest USA record)
Philadelphia
Baltimore
Fernandina Beach
SanDiego
All the rest are here.
NOAA Link
Out of curiosity, what do you think that link you just quoted said? Because what I read was that a volcano masked sea rise level in 1991 and baring another volcano eruption the sea level will be rising noticeably in the coming decade.
You want my opinion?
They are making excuses and would love to see the tidal gages data go away, it does not correlate well with the models.
excerpts from the paper:
Over the 23-year time series, it shows that GMSL has been rising at a rate of 3.3 ± 0.4 mm yr−1, but with notable inter-decadal variability. Our current best estimate of the rates during the first (1993–2002) and second (2003–2012) decades of the altimeter era are 3.5 and 2.7 mm yr−1, respectively, though important sources of uncertainty persist and raise caution regarding the record’s early years
Based on these same studies, however, the majority of the acceleration arises from a shift that occurs around 1990 when the rate of sea level rise increases to the satellite-measured trend of 3.3 mm yr−1.
While the tide gauge record may provide a ballpark estimate for what to expect during the altimeter era, it provides only weak quantitative information regarding what acceleration should be expected. In practice, calculating GMSL from 1900 to the present is a challenging problem based on the spatial and temporal sampling characteristics of available gauges. There is little consensus across tide gauge studies on the rate and acceleration of GMSL over the past century, thus making it difficult to interpret the altimeter era in a broader context. As an alternative approach to understanding sea level variability, we therefore seek to estimate and remove effects that obscure a possible underlying acceleration from the altimeter record itself. By doing so, we can potentially estimate the acceleration in GMSL directly from altimetry.
edit on 13-4-2017 by D8Tee because: (no reason given)
new topics
-
Intro once again
Introductions: 4 minutes ago -
University student disciplined after saying veganism is wrong and gender fluidity is stupid
Education and Media: 1 hours ago -
Geddy Lee in Conversation with Alex Lifeson - My Effin’ Life
People: 2 hours ago -
God lived as a Devil Dog.
Short Stories: 2 hours ago -
Police clash with St George’s Day protesters at central London rally
Social Issues and Civil Unrest: 4 hours ago -
TLDR post about ATS and why I love it and hope we all stay together somewhere
General Chit Chat: 5 hours ago -
Hate makes for strange bedfellows
US Political Madness: 7 hours ago -
Who guards the guards
US Political Madness: 9 hours ago -
Has Tesla manipulated data logs to cover up auto pilot crash?
Automotive Discussion: 11 hours ago
top topics
-
Hate makes for strange bedfellows
US Political Madness: 7 hours ago, 14 flags -
Who guards the guards
US Political Madness: 9 hours ago, 13 flags -
whistleblower Captain Bill Uhouse on the Kingman UFO recovery
Aliens and UFOs: 16 hours ago, 11 flags -
Police clash with St George’s Day protesters at central London rally
Social Issues and Civil Unrest: 4 hours ago, 7 flags -
TLDR post about ATS and why I love it and hope we all stay together somewhere
General Chit Chat: 5 hours ago, 5 flags -
University student disciplined after saying veganism is wrong and gender fluidity is stupid
Education and Media: 1 hours ago, 3 flags -
Has Tesla manipulated data logs to cover up auto pilot crash?
Automotive Discussion: 11 hours ago, 2 flags -
God lived as a Devil Dog.
Short Stories: 2 hours ago, 2 flags -
Geddy Lee in Conversation with Alex Lifeson - My Effin’ Life
People: 2 hours ago, 2 flags -
Intro once again
Introductions: 4 minutes ago, 1 flags
active topics
-
Police clash with St George’s Day protesters at central London rally
Social Issues and Civil Unrest • 36 • : FlyersFan -
"We're All Hamas" Heard at Columbia University Protests
Social Issues and Civil Unrest • 249 • : marg6043 -
Europe declares war on Russia?
World War Three • 66 • : Consvoli -
Candidate TRUMP Now Has Crazy Judge JUAN MERCHAN After Him - The Stormy Daniels Hush-Money Case.
Political Conspiracies • 732 • : matafuchs -
Spectrophilia - Women Who Have Had Affairs With Ghosts Say Spooks Are Better Lovers Than Real Men
Paranormal Studies • 28 • : FlyersFan -
Intro once again
Introductions • 0 • : Angrybrewer2 -
University student disciplined after saying veganism is wrong and gender fluidity is stupid
Education and Media • 6 • : Consvoli -
Thousands Of Young Ukrainian Men Trying To Flee The Country To Avoid Conscription And The War
Other Current Events • 119 • : FlyersFan -
-@TH3WH17ERABB17- -Q- ---TIME TO SHOW THE WORLD--- -Part- --44--
Dissecting Disinformation • 626 • : cherokeetroy -
The Superstition of Full Moons Filling Hospitals Turns Out To Be True!
Medical Issues & Conspiracies • 19 • : FloridaManMatty