It looks like you're using an Ad Blocker.
Please white-list or disable AboveTopSecret.com in your ad-blocking tool.
Thank you.
Some features of ATS will be disabled while you continue to use an ad-blocker.

This is Why it is Not Possible that CO2 is the Cause of Global Warming.
page: 5share:
Lets play with real numbers that are facts:
1. The total atmosphere weighs 1,800,000 BILLION tons.
2. CO2 is .04% of that which is 720 billion tons.
3. The total typical whole planet Man produced CO2 is 6 billion tons. 6 billion tons sounds like a lot but in fact it is .83% of all the CO2 on the planet.
4. Man is responsible for .83% of .04% of the atmosphere. That comes to .000033%.
5. All the plant life on the surface and in the oceans processes around 6 billion tons of CO2 every year into O2 through photosynthesis. It's not like radiation where it builds up. If there is more CO2 there will be more plants to process the CO2 and lower it. If there is less CO2 there will be less plants to process CO2 so it will rise.
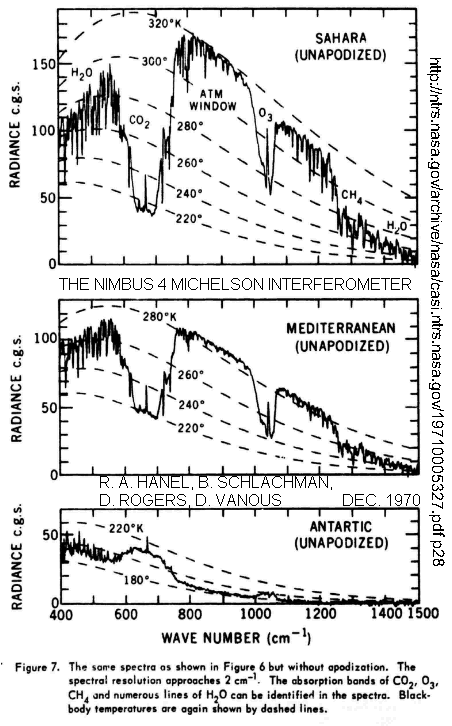
6. Water vapor is science fact to be responsible for 95% of all solar radiation heating retention, reflection or radiation back into space.
All of Man is barely a pin prick on a mile wide, mile long beach in the scheme of things. We aren't that important.
1. The total atmosphere weighs 1,800,000 BILLION tons.
2. CO2 is .04% of that which is 720 billion tons.
3. The total typical whole planet Man produced CO2 is 6 billion tons. 6 billion tons sounds like a lot but in fact it is .83% of all the CO2 on the planet.
4. Man is responsible for .83% of .04% of the atmosphere. That comes to .000033%.
5. All the plant life on the surface and in the oceans processes around 6 billion tons of CO2 every year into O2 through photosynthesis. It's not like radiation where it builds up. If there is more CO2 there will be more plants to process the CO2 and lower it. If there is less CO2 there will be less plants to process CO2 so it will rise.
6. Water vapor is science fact to be responsible for 95% of all solar radiation heating retention, reflection or radiation back into space.
All of Man is barely a pin prick on a mile wide, mile long beach in the scheme of things. We aren't that important.
originally posted by: tkwasny
Lets play with real numbers that are facts:
1. The total atmosphere weighs 1,800,000 BILLION tons.
2. CO2 is .04% of that which is 720 billion tons.
3. The total typical whole planet Man produced CO2 is 6 billion tons. 6 billion tons sounds like a lot but in fact it is .83% of all the CO2 on the planet.
Irrelevant.
www.newscientist.com...
4. Man is responsible for .83% of .04% of the atmosphere. That comes to .000033%.
5. All the plant life on the surface and in the oceans processes around 6 billion tons of CO2 every year into O2 through photosynthesis. It's not like radiation where it builds up. If there is more CO2 there will be more plants to process the CO2 and lower it. If there is less CO2 there will be less plants to process CO2 so it will rise.
The amount of CO2 is currently increasing, despite this plant growth.
6. Water vapor is science fact to be responsible for 95% of all solar radiation heating retention, reflection or radiation back into space.
All of Man is barely a pin prick on a mile wide, mile long beach in the scheme of things. We aren't that important.
Unless proven otherwise by experimental results, which is what has happened.
CO2 has gone from 280 to 400 from humans.
Where are all the Bison?
1.bp.blogspot.com...
edit on 9-12-2016 by mbkennel because: (no reason given)
originally posted by: ElectricUniverse
I call people Willis when their statements make no sense. It makes no sense for me to call you Willis right? Just like making statements or claims like "extremely secure physics" or blaming Dr. Roy Spencer for doing what other atmospheric scientists also do and is normal to do makes no sense whatsoever...
I didn't say anything about "extremely secure physics" so I don't know what you're talking about. Deriving temperature from microwave sounding records is still a new field. Dr. Roy Spencer is one of its pioneers.
He's also quite clearly working out the kinks. Perhaps he's also biased, but it is now obvious to everyone that his records cannot be trusted to be accurate. I mean, almost an entire degree of adjustment for one data point! Yet, you want to use that as the gold standard?
The TLT, which takes a massive chunk of atmosphere 15 km high and dilutes it down to a single modeled temperature reading? That a model based on an uncertain algorithm working on a measurement by something that doesn't actually measure temperature is somehow better than actual damn thermometers on the ground?
Because that's what a microwave sounder is. That's how TLT is created by Dr. Roy Spencer - through algorithm and modelling; manipulation of data that has to be twisted and squeezed in order to coax a value that apparently was wrong in 5.6 by almost an entire degree compared to version 6.0. That's your standard of trust?
That's what you want to put the future of the Earth on, instead of the well-known mechanics behind the greenhouse effect and CO2 being proven as a greenhouse gas? How much sense THAT make?
It's far newer an idea than the idea that carbon dioxide warms the Earth - by over a hundred years. Something that has been spectrographically proven.
Oh, and that graph taking from an early satellite? IT PREDATES MICROWAVE SOUNDERS.
Your arguments are poor. You mostly try to drown out opponents with massive walls of meaningless text, frequently culled from previous posts and quite dated. Further, you spam the hell out of threads with unrelated abstracts and continue to do so when called out on it.
Do you know what you're really doing? You're fighting for a conspiracy. You are continuing the greatest conspiracy of our time: the conspiracy against science; the conspiracy against anthropogenic climate change based on solid, more than century-old physics.
You are the conspirator.
originally posted by: ElectricUniverse
a reply to: Greven
Wait...wait... Do you mean like that graph, not sure who posted it since that person seems to have deleted that graph now, showing the temperature in our oceans and that same person failed to state that this graph was showing temperatures in the ocean from 0-2,000 meters?...
I guess that same person doesn't know that for heat to move down to 2,000 meters in our oceans takes decades(actually it takes thousands of years not decades for heat in our oceans to move down to 2,000m) and that heat was absorbed by the first 200m of our oceans long, long ago...
What relevance does this have with my post?
How the # is it related to this one:
originally posted by: Greven
a reply to: ElectricUniverse
There are 14 papers cited, and 4 of those are from Spencer & Christy; that's a pretty significant chunk.
The data was changed, correct? That's what I've claimed. That's what you've seen. The data sets are clearly different.
You seem to think such changes are an improvement; wouldn't that be the same for other adjustments in climate records, or is it only okay for Roy Spencer to do it? If not, why is he different - why is he to be trusted?
Oh, and a funny thing about how this all plays out that you may not know about. TLT is temperature of the lower troposphere; this is a slice of the atmosphere up to about 12.5 km (see here). It's weighted such that the first several thousand meters count for more, but it still counts up higher and averages this all out to that single number in the data set.
Incidentally, the reason it gets colder as one goes up (with some variation mind you) is because of greenhouse gases. They don't absorb and hold on to heat; rather, they absorb and re-emit heat. The result of this is that less heat escapes higher into the atmosphere with height. An increase in greenhouse gases will magnify this effect.
Consequently, the surface will warm much more than 10 km up; it may in fact cool at that altitude. As a simplistic example, let's say the surface increases by +1.0C, and 10 km up decreases by -0.5C (the remainder of the atmosphere higher up loses the other -0.5C to balance out energy received from the Sun). An unweighted measurement of +0.5C might be inferred from microwave sounding. Do you begin to see how there might be some problems?
One last thought for the evening: even Roy Spencer's 6.0 data set shows a warming trend of +0.11 C/decade. Down from +0.15 C/decade in his 5.6 data set, but whatever. Now that you've quite heavily defended Roy Spencer's 6.0 record, do you agree with the warming trend that it shows?
Do you see anything related? I sure don't.
You reference another poster entirely. It seems like you didn't quote it because you are purposely trying to go off on some tangent. How interesting... I suppose at this point, you're a lost cause.
You have something beyond scientific curiosity guiding your fervent posts on the topic of climate change. I hope that other ATS members can see that; that your arguments are poor and frequently avoid and attempt to distract people reading them.
Why even bother at this point? The head of the EPA will be someone who doesn't believe it's happening, and there's already a witch hunt for anyone involved in climate change - Trump isn't even in office yet! You've 'won' for the time being on the political scene. Give it a rest. I have for the past couple of months... but it ain't getting better.
edit on 20Fri, 09 Dec 2016 20:03:06 -0600America/ChicagovAmerica/Chicago12 by Greven because: (no reason
given)
a reply to: rickymouse
No, it is the Sun and cosmic rays, among other natural factors that influence Earth's magnetic field. Humans do not affect Earth's magnetic field.
No, it is the Sun and cosmic rays, among other natural factors that influence Earth's magnetic field. Humans do not affect Earth's magnetic field.
originally posted by: Greven
Your anecdotes are useless. The President of the United States gave a speech on February 8th,1965; in it he discussed atmospheric changes - nuclear and carbon dioxide being the two named.
Oooh, the President of the United States who does not have a bias and has a degree as a liar, I mean as a lawyer... I guess that settles it... If a liar, i mean a lawyer claims CO2 is the cause it must be it...
originally posted by: Greven
Some people yelled a lot about it getting cooler. They were wrong. The end. Why won't you get over it?
Except that our sun has been acting weird very weird, must be all them vehicles at the sun's surface that Greven dreams about are spewing CO2 and causing the extra warming...
Declining solar activity linked to recent warming
The Sun may have caused as much warming as carbon dioxide over three years.
Quirin Schiermeier
An analysis of satellite data challenges the intuitive idea that decreasing solar activity cools Earth, and vice versa. In fact, solar forcing of Earth's surface climate seems to work the opposite way around — at least during the current Sun cycle.
Joanna Haigh, an atmospheric physicist at Imperial College London, and her colleagues analysed daily measurements of the spectral composition of sunlight made between 2004 and 2007 by NASA's Solar Radiation and Climate Experiment (SORCE) satellite. They found that the amount of visible light reaching Earth increased as the Sun's activity declined — warming the Earth's surface. Their unexpected findings are published today in Nature1.
The study period covers the declining phase of the current solar cycle. Solar activity, which in the current cycle peaked around 2001, reached a pronounced minimum in late 2009 during which no sunspots were observed for an unusually long period.
Sunspots, dark areas of reduced surface temperature on the Sun caused by intense magnetic activity, are the best-known visible manifestation of the 11-year solar cycle. They have been regularly observed and recorded since the dawn of modern astronomy in the seventeenth century. But measurements of the wavelengths of solar radiation have until now been scant.
Radiation leak
Haigh's team compared SORCE's solar spectrum data with wavelengths predicted by a standard empirical model based mainly on sunspot numbers and area, and noticed unexpected differences. The amount of ultraviolet radiation in the spectrum was four to six times smaller than that predicted by the empirical model, but an increase in radiation in the visible wavelength, which warms the Earth's surface, compensated for the decrease.
Contrary to expectations, the net amount of solar energy reaching Earth's troposphere — the lowest part of the atmosphere — seems to have been larger in 2007 than in 2004, despite the decline in solar activity over that period.
The spectral changes seem to have altered the distribution of ozone molecules above the troposphere. In a model simulation, ozone abundance declined below an altitude of 45 kilometres altitude in the period 2004–07, and increased further up in the atmosphere.
The modelled changes are consistent with space-based measurements of ozone during the same period.
"We're seeing — albeit limited to a very short period — a very interesting change in solar irradiation with remarkably similar changes in ozone," says Haigh. "It might be a coincidence, and it does require verification, but our findings could be too important to not publish them now."
Sun surprise
The full implications of the discovery are unclear. Haigh says that the current solar cycle could be different from previous cycles, for unknown reasons. But it is also possible that the effects of solar variability on atmospheric temperatures and ozone are substantially different from what has previously been assumed.
...
www.nature.com...
Let's recap the important part again...
...
Contrary to expectations, the net amount of solar energy reaching Earth's troposphere — the lowest part of the atmosphere — seems to have been larger in 2007 than in 2004, despite the decline in solar activity over that period.
...
www.nature.com...
An influence of solar spectral variations on radiative forcing of climate
Those humans on the sun using all those cars... Shame on humans.... That's it right Greven? All those humans living on the sun and spewing CO2 everywhere huh Greven?...
edit on 10-12-2016 by ElectricUniverse because: add link and add comment.
originally posted by: ElectricUniverse
a reply to: rickymouse
No, it is the Sun and cosmic rays, among other natural factors that influence Earth's magnetic field. Humans do not affect Earth's magnetic field.
I believe we can if we mine out the minerals that form the dipoles. Those dipoles dot the landscape all over the world. The magnetics runs through some areas more than other and the continuity of the crust is also involved as currents run through the crust. They can use magnetic orientation of rock to find how old an area is and to know how areas form. A mountain is usually a dipole. So would be high manmade structures. So can certain mineral deposits.
originally posted by: Greven
Did YOU look at the data? Clearly you glanced at it, but you seem to have forgotten that there are two years in the 1997-1998 El Niño; it was at its strongest in 1997:
1997 -0.5 -0.4 -0.2 0.1 0.6 1.0 1.4 1.7 2.0 2.2 2.3 2.3
Note the multiple 2.3 indices. See the post by intergalactic fire. They were basically the same.
...
Half of the 1997 Super El Niño being warmer doesn't mean the 1997-1998 ENSO was stronger than the 2015-2016 ENSO... More so when 3/4 of the time the 2015-2016 ENSO was stronger than the 1997-1998 ENSO which only was 1/4 of the time stronger...
The 2015-2016 ENSO was warmer 3/4 of the time, while the 1997/1998 was only warmer 1/4 of the time. How does it make sense that the 1997-1998 ENSO was stronger?...
edit on 10-12-2016 by ElectricUniverse because: correct comment.
a reply to: rickymouse
We don't mine out the iron liquid on the Earth's core. Something else is changing Earth's magnetic field, which reacts to changes on the Sun, at the same time that the Sun's magnetic field is also weakening. We are also seeing the same effects in other planets and moons in the solar system. They have been undergoing climate change, and in the form of warming nonetheless, and we see them acting strangely.
Pluto and Charon, have also been warming, and we know that Pluto and Charon are too small to be able to radiate the energy we see them radiating. So something else is causing all these changes, and it isn't mankind.
Here is what is happening to the Sun's magnetic field.
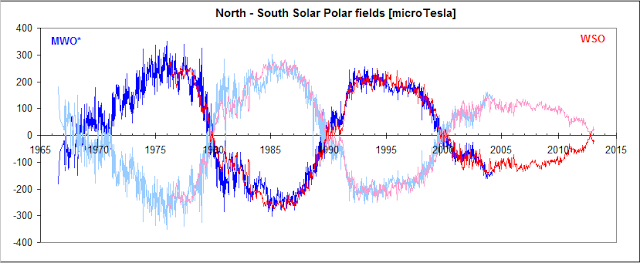
And as i pointed out, even though at a time when the Sun's other activity had been declining from 2004-2007, the visible light the sun has been emitting has been stronger in 2007 than in 2004.
The entire solar system is reacting to this new region of space we have been encountering. That's the common factor that links all these changes, including those affecting Earth.
We don't mine out the iron liquid on the Earth's core. Something else is changing Earth's magnetic field, which reacts to changes on the Sun, at the same time that the Sun's magnetic field is also weakening. We are also seeing the same effects in other planets and moons in the solar system. They have been undergoing climate change, and in the form of warming nonetheless, and we see them acting strangely.
Pluto and Charon, have also been warming, and we know that Pluto and Charon are too small to be able to radiate the energy we see them radiating. So something else is causing all these changes, and it isn't mankind.
Here is what is happening to the Sun's magnetic field.
And as i pointed out, even though at a time when the Sun's other activity had been declining from 2004-2007, the visible light the sun has been emitting has been stronger in 2007 than in 2004.
The entire solar system is reacting to this new region of space we have been encountering. That's the common factor that links all these changes, including those affecting Earth.
edit on 10-12-2016 by ElectricUniverse because: add comment.
edit on 10-12-2016 by ElectricUniverse because: correct
comment.
a reply to: yorkshirelad
Just increase the number of plants on Earth in proportion to the CO2 growth.
Choose one or many! But guess what they all lead to the same conclusion increased CO2 increased trapped heat.
Just increase the number of plants on Earth in proportion to the CO2 growth.
a reply to: ElectricUniverse
To claim other planets are warming is flat out lying.
How hypocritical are you? You claim we do not have enough information to prove Earth is warming, yet now you are claiming that we know Pluto, a celestial body we know very little about is warming?
You may believe that BS, so will others with strong confirmation bias, but you are NOT fooling most of us with such an asinine claim.
Also do you have a valid source for your nifty chart?
edit on 16-12-2016 by jrod because: G
originally posted by: ElectricUniverse
originally posted by: Greven
Did YOU look at the data? Clearly you glanced at it, but you seem to have forgotten that there are two years in the 1997-1998 El Niño; it was at its strongest in 1997:
1997 -0.5 -0.4 -0.2 0.1 0.6 1.0 1.4 1.7 2.0 2.2 2.3 2.3
Note the multiple 2.3 indices. See the post by intergalactic fire. They were basically the same.
...
Half of the 1997 Super El Niño being warmer doesn't mean the 1997-1998 ENSO was stronger than the 2015-2016 ENSO... More so when 3/4 of the time the 2015-2016 ENSO was stronger than the 1997-1998 ENSO which only was 1/4 of the time stronger...
The 2015-2016 ENSO was warmer 3/4 of the time, while the 1997/1998 was only warmer 1/4 of the time. How does it make sense that the 1997-1998 ENSO was stronger?...
Because there is more to ENSO than temperature. www.esrl.noaa.gov...
a reply to: FrogGod
Not remotely possible. Numbers don't work.
The carbon from one year's of emissions is 500 to 1000 years of plant growth from back in the Cretaceous or whatever, and that was when plants grew like crazy, and bacteria and fungi hadn't evolved the ability to break down lignin (if they did the plants when they died would re-release the carbon to the atmosphere instead of making oil and coal).
Also think of it this way: look at the curves from the CO2. There is a yearly cycle, when the much larger Northern Hemisphere is in the growth cycle the carbon goes down as plants grow. Then in winter it is released. And that fluctuation is pretty small compared to the long-term increase from humans.
So the entire planet's worth of seasonal growth and die-off is just a modest blip.
To make up from human fossil emissions, you'd need to grow and somehow sequester from decay (no known mechanism today) dozen's of Earths of plants every year.
edit on 16-12-2016 by mbkennel because: (no reason given)
edit on 16-12-2016 by mbkennel because: (no reason
given)
originally posted by: Greven
The TLT, which takes a massive chunk of atmosphere 15 km high and dilutes it down to a single modeled temperature reading? That a model based on an uncertain algorithm working on a measurement by something that doesn't actually measure temperature is somehow better than actual damn thermometers on the ground?
And direct thermometers in the atmosphere. There are thousands of instrumented balloons released every 12 hours every day over the planet. This has been going on for weather prediction for decades, and is a key input to the global climate record.
Actual science looks very carefullly at all instruments with good physical judgment about their accuracy and calibration. The Berkeley Earth project re-ingested all sorts of raw data and spent years doing their own re-analysis outside of the climate community. The previously skeptical head of it became 100% converted to the mainstream scientific climatological understanding.
www.ua.nws.noaa.gov...
How are radiosonde data used?
Understanding and accurately predicting changes in the atmosphere requires adequate observations of the upper atmosphere. Radiosondes provide a primary source of upper-air data and will remain so into the foreseeable future.
Radiosonde observations are applied to a broad spectrum of efforts. Data applications include:
- Input for computer-based weather prediction models;
- Local severe storm, aviation, fire weather, and marine forecasts;
- Weather and climate change research;
- Input for air pollution models;
- Ground truth for satellite data
The point of this is that the satellites have instruments which must be calibrated against a more reliable source, such as these. Satellites have advantages in area and coverage time and disadvantages in that they are remote and not local and direct physical measurement.
Because that's what a microwave sounder is. That's how TLT is created by Dr. Roy Spencer - through algorithm and modelling; manipulation of data that has to be twisted and squeezed in order to coax a value that apparently was wrong in 5.6 by almost an entire degree compared to version 6.0. That's your standard of trust?
edit on 16-12-2016 by mbkennel because: (no reason given)
edit on 16-12-2016 by mbkennel because: (no reason
given)
originally posted by: yorkshirelad
...
Jesus H They have to have the most powerful computers ever built to work on this and there is is still an
error margin. An error margin that is narrowing but ALWAYS upward! Of course a consistent upward trend like this should have most people who can think exceptionally worried.
...
Always upwards when GCMs have been wrong all the time and observation tells us differently?
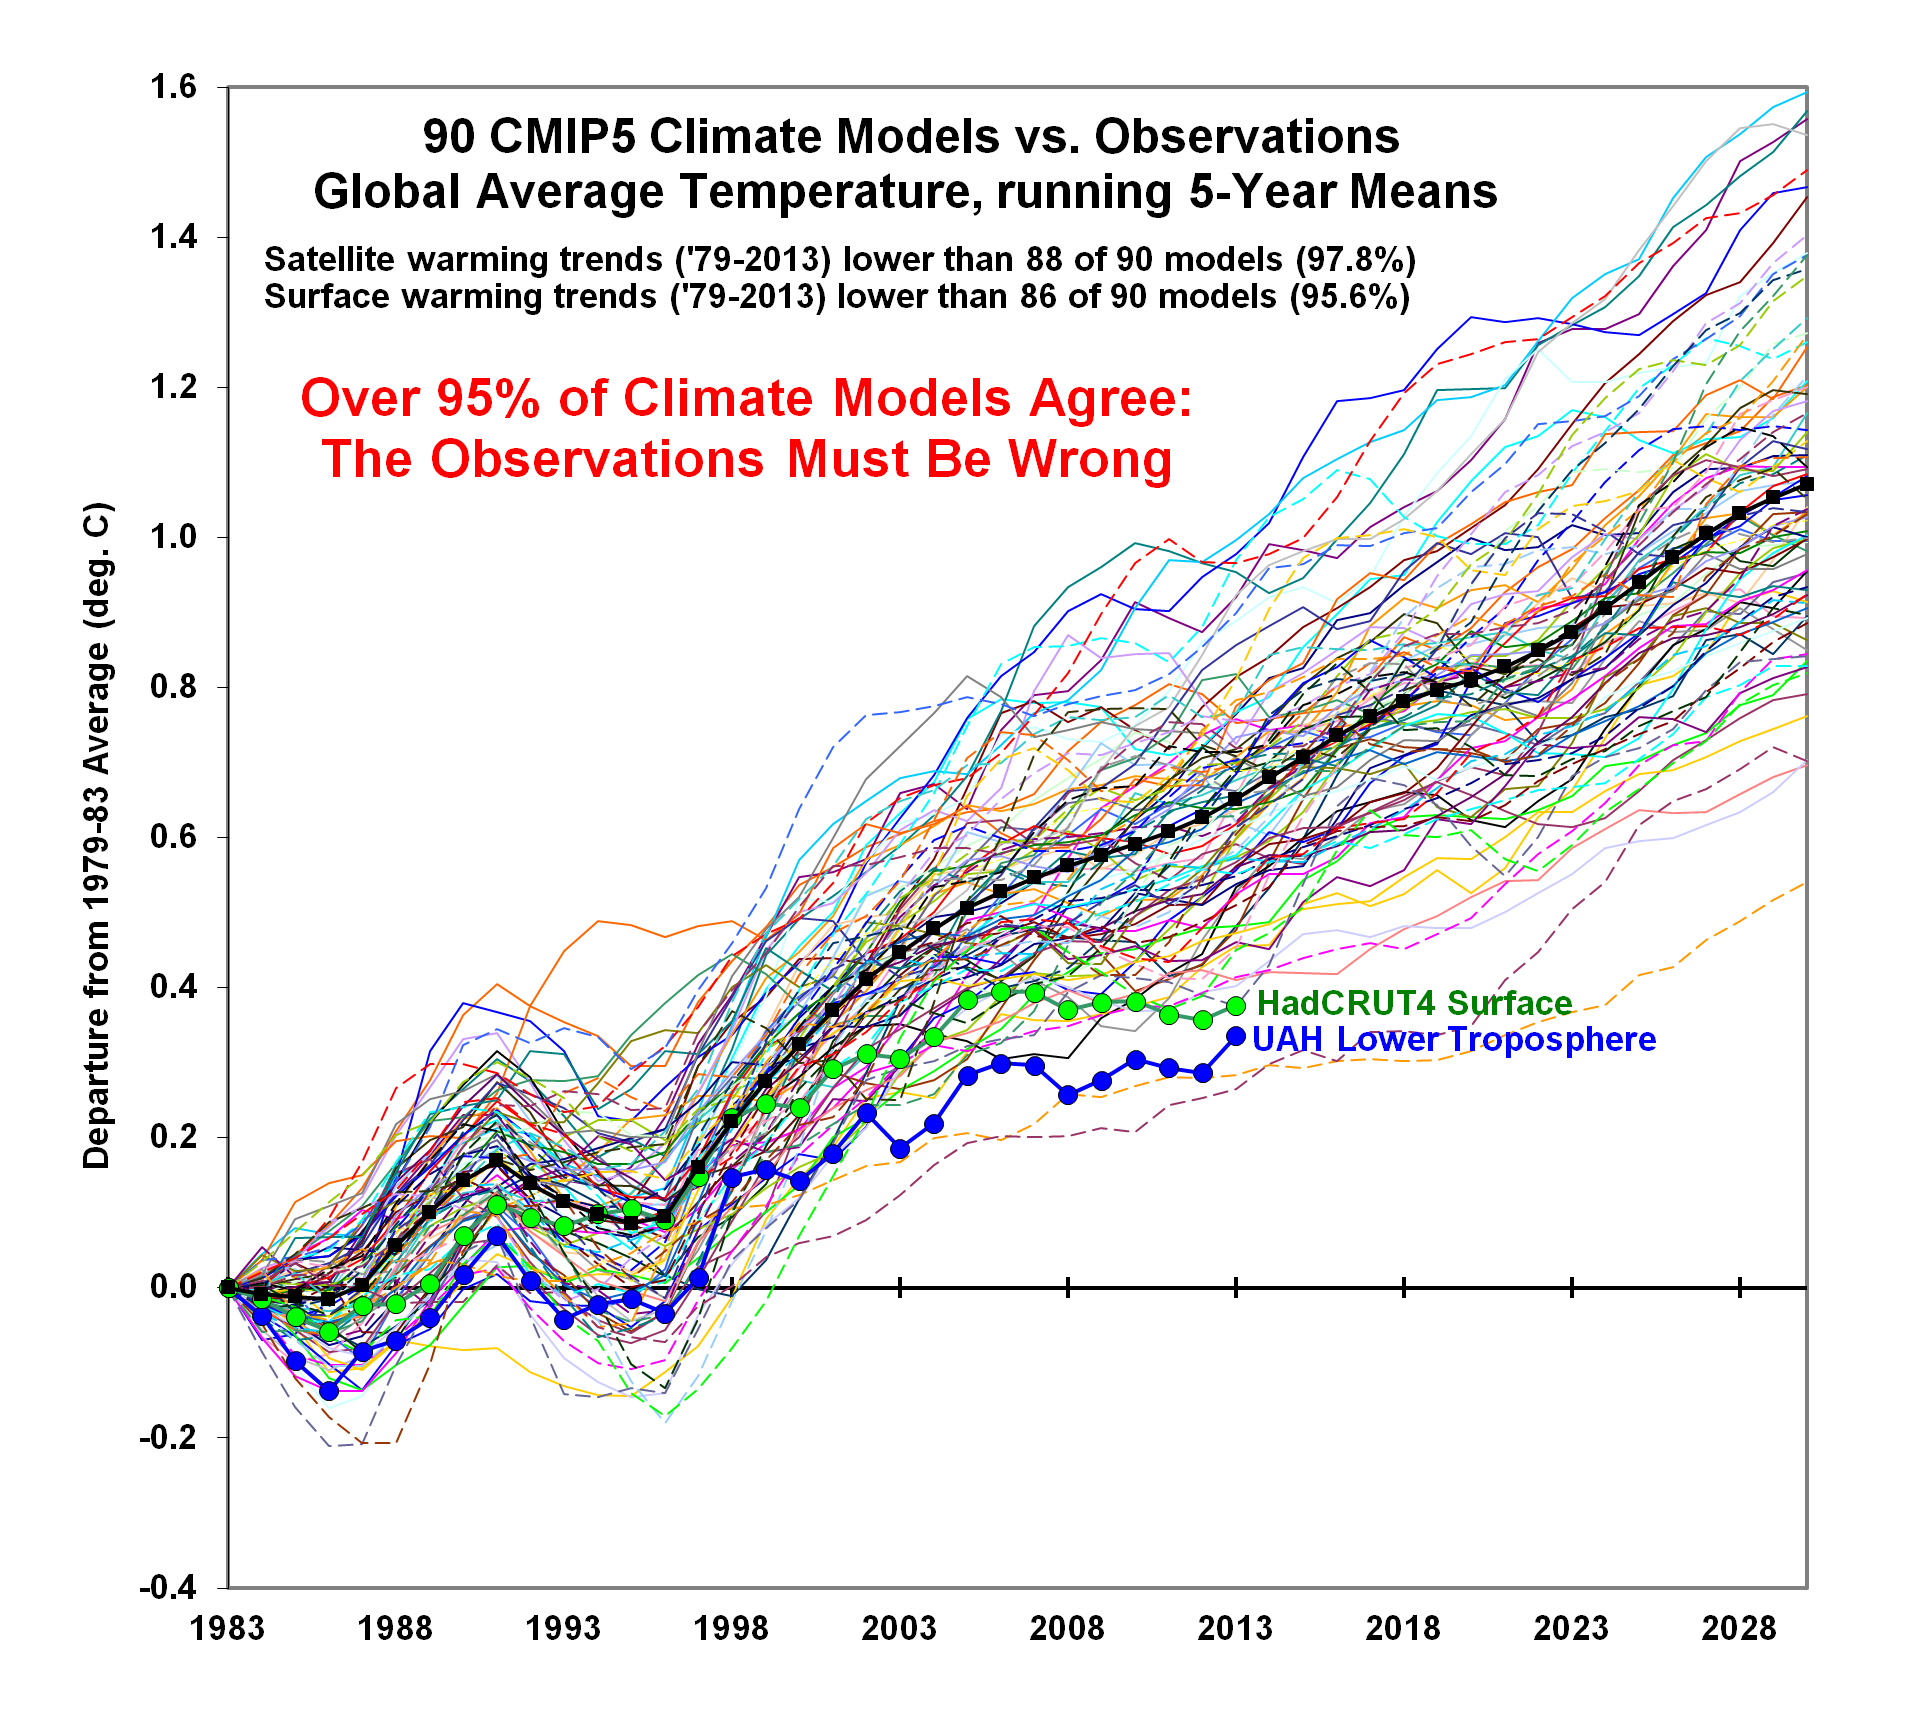
Yes, it is a complicated process, but observation tells us that CO2 is not the main cause, nor a mayor cause of climate change. Otherwise with the continued increase in CO2 temperatures should have continued increasing in the atmosphere, but they have slowed down.
originally posted by: mbkennel
..
Increased greenhouse effect. More outgoing radiation is absorbed and re-emitted in an ingoing direction than before.
In a nutshell: the atmosphere is shining more in infrared than before.
...
Not true when the sun's overall activity (such as infrared, and ultraviolet) have decreased. Only visible light, and soft x-rays from our sun has been increasing . Soft xrays are produced during thermal bremsstrahlung radiation as the sun emits solar flares, and this energy has been increasing more than expected. The sun is probably reacting to the changes the entire solar system is undergoing as we move into the new region of the local bubble.
originally posted by: mbkennel
That's not how the physics works. Radiation which would otherwise go to space hits the atmosphere and comes back down. That process takes microseconds. The heat capacity of CO2 is of course negligible, is is the infrared properties that are causing the issue. This physics was understood 100 years ago in the basics and in quantitative detail by the 1960's.
Wrong, there are still processes the Earth and the entire solar system are undergoing which are not entirely understood.
We know the solar wind is capable of blowing away portions of Earth's atmosphere.
Published:
Dec 8, 1998
Solar Wind blows some of Earth's atmosphere into space
Dec. 8, 1998: Residents of the far north who saw a massive display of the aurora borealis in late September were also staring through an invisible fountain of gas being accelerated into space by a powerful bubble of solar wind, which pumped about 200 gigawatts of electrical power into the Earth.
...
science.nasa.gov...
Astrophysicists don't fully understand why while the sun's overall activity has been decreasing from 2004-2007, visible light and soft x-rays the sun is emitting have been increasing warming the Earth's Troposphere more than we thought possible.
Then there is the fact that Earth's magnetic field has also been weakening which does affect Earth's climate and it's geological changes which are getting stronger. (Just like in most other planets and moons with an atmosphere in the solar system have also been undergoing climate changes in the form of warming, just like Earth.)
Sun's Surprise: Even As It Relaxes, It May Heat Earth's Climate
By Denise Chow, SPACE.com Staff Writer | October 6, 2010 01:01pm ET
...
Breaking down the radiation
The study, led by Joanna Haigh, a professor of atmospheric physics at the Imperial College London,?analyzed the types of radiation that reach Earth from the sun, and the various effects they have on our planet's atmosphere.
Haigh and her colleagues used satellite measurements taken from 2004 to 2007, the declining phase of the latest 11-year solar weather cycle.
As the sun becomes less active, it typically releases less energy in the form of radiation. Previously, this was understood as a decrease in the total amount of radiation that reaches the top of the Earth's atmosphere.
In examining solar emissions during this declining phase, however, the researchers found that a large decrease in ultraviolet radiation was roughly compensated for, by an increase in visible radiation.
"Visible radiation is the only kind that, in any substantial quality, gets to the Earth's surface and heats the lower atmosphere," Haigh told SPACE.com. "We found that as the sun's activity declined from 2004 to 2007, more of this radiation was entering into the lower atmosphere."
Ultraviolet radiation is largely absorbed in the stratosphere, where it combines with ozone molecules to form what is known as stratospheric ozone. As stratospheric ozone depletes, more UV radiation is able to pass through to the Earth's surface.
Visible radiation, on the other hand, more readily penetrates into the Earth's lower atmosphere. So, if more visible radiation reaches the Earth's surface, the heating of our planet's lower atmosphere results in a warming of the climate.
"In just over three years of observation, we conclude that the visible radiation was going to be warming the planet as the solar activity declined," Haigh said.
This may seem counterintuitive, and the researchers are careful to note that their findings cannot be generalized without more extensive study of these processes. Furthermore, they said, their observations were made over a relatively short period of time during a potentially anomalous solar cycle.
Their research is detailed in the Oct. 7 issue of the journal Nature.
...
www.space.com...
originally posted by: mbkennel
Funny that it's colder deeper and warmer up top then.
Of course it is still colder deeper in our oceans... But geothermal heat still heats the deep ocean by about 0.4-0.5 degrees C and in other areas up to 1.5 degrees C. The increase in geothermal energy still adds to the overall heating the oceans are undergoing, and this activity, as well as global seismicity, has been increasing.
edit on 17-12-2016 by ElectricUniverse because: add and correct comment.
a reply to: ElectricUniverse
So All that CO2 coming out of the Climate Change Fanatics Mouths is not Contributing to the Earth's Climate Warming Up ? Who would of Thunk ?
So All that CO2 coming out of the Climate Change Fanatics Mouths is not Contributing to the Earth's Climate Warming Up ? Who would of Thunk ?
originally posted by: D8Tee
a reply to: mbkennel
Not remotely possible. Numbers don't work.
The carbon from one year's of emissions is 500 to 1000 years of plant growth from back in the Cretaceous or whatever
Can you show me your numbers as to how you arrived at this?
It was from memory. The number from a scientific source is >400.
pdfs.semanticscholar.org...
The fossil fuels burned in 1997 were created from organic matter containing 44 × 1018 g C, which is >400 times the net primary productivity (NPP) of the planet’s current biota.
new topics
-
God's Righteousness is Greater than Our Wrath
Religion, Faith, And Theology: 45 minutes ago -
Electrical tricks for saving money
Education and Media: 3 hours ago -
VP's Secret Service agent brawls with other agents at Andrews
Mainstream News: 5 hours ago -
Sunak spinning the sickness figures
Other Current Events: 5 hours ago -
Nearly 70% Of Americans Want Talks To End War In Ukraine
Political Issues: 6 hours ago -
Late Night with the Devil - a really good unusual modern horror film.
Movies: 7 hours ago -
Cats Used as Live Bait to Train Ferocious Pitbulls in Illegal NYC Dogfighting
Social Issues and Civil Unrest: 9 hours ago -
The Good News According to Jesus - Episode 1
Religion, Faith, And Theology: 11 hours ago
top topics
-
Florida man's trip overseas ends in shock over $143,000 T-Mobile phone bill
Social Issues and Civil Unrest: 16 hours ago, 8 flags -
Cats Used as Live Bait to Train Ferocious Pitbulls in Illegal NYC Dogfighting
Social Issues and Civil Unrest: 9 hours ago, 8 flags -
VP's Secret Service agent brawls with other agents at Andrews
Mainstream News: 5 hours ago, 8 flags -
Bobiverse
Fantasy & Science Fiction: 16 hours ago, 3 flags -
HORRIBLE !! Russian Soldier Drinking Own Urine To Survive In Battle
World War Three: 13 hours ago, 3 flags -
Electrical tricks for saving money
Education and Media: 3 hours ago, 3 flags -
Nearly 70% Of Americans Want Talks To End War In Ukraine
Political Issues: 6 hours ago, 3 flags -
Sunak spinning the sickness figures
Other Current Events: 5 hours ago, 3 flags -
Late Night with the Devil - a really good unusual modern horror film.
Movies: 7 hours ago, 2 flags -
The Good News According to Jesus - Episode 1
Religion, Faith, And Theology: 11 hours ago, 1 flags
active topics
-
VP's Secret Service agent brawls with other agents at Andrews
Mainstream News • 34 • : WeMustCare -
New whistleblower Jason Sands speaks on Twitter Spaces last night.
Aliens and UFOs • 53 • : pianopraze -
Sunak spinning the sickness figures
Other Current Events • 5 • : glen200376 -
SETI chief says US has no evidence for alien technology. 'And we never have'
Aliens and UFOs • 44 • : MikeDeGrasseTyson -
HORRIBLE !! Russian Soldier Drinking Own Urine To Survive In Battle
World War Three • 31 • : budzprime69 -
How ageing is" immune deficiency"
Medical Issues & Conspiracies • 33 • : rickymouse -
The Reality of the Laser
Military Projects • 46 • : Zaphod58 -
God's Righteousness is Greater than Our Wrath
Religion, Faith, And Theology • 0 • : randomuser2034 -
President BIDEN Vows to Make Americans Pay More Federal Taxes in 2025 - Political Suicide.
2024 Elections • 136 • : ImagoDei -
Electrical tricks for saving money
Education and Media • 3 • : Mike72