It looks like you're using an Ad Blocker.
Please white-list or disable AboveTopSecret.com in your ad-blocking tool.
Thank you.
Some features of ATS will be disabled while you continue to use an ad-blocker.

The North Pole is an insane 36 degrees warmer than normal as winter descends
page: 6share:
a reply to: alphabetaone
When people say climate is changing, my first question is: does this change represent something abnormal or is it just a longer cycle that can be seen by just one generation
This is the historical temperature data for 1950 in Alaska
weatherspark.com...
This is the current temperature for Fairbanks Alaska:
www.timeanddate.com...
I noticed that the original poster article reported only the temperature anomaly and not the actual temperature This is a sure sign that you are reading propaganda
The temperature in Fairbanks Alaska in 1950 was 8 degrees C. Today it is -20 degrees celcius
I know that this is not Arctic temperatures, however, I wanted to show how wide the range of "normal" really is. We have an almost 28 degree range over a period of 66 years in Fairbanks Alaska.
Nobody was screaming and wringing their hands over "global warming" in the 1950s and if they did, please remember that the pundits were wringing their hands over a coming "ice age" by the 1970s.
I would like to see temperature outside the normal range before I agree with anthropogenic causes of climate change.
Tired of Control Freaks
Man, I'm in Texas. THIS morning was the first time it's been chilly enough for jackets and now (3:30p) it's 90 degrees. It is the end of November
and the temperature has stayed above 100 degrees until this point.
Global warming sucks.
Global warming sucks.
originally posted by: ladyvalkyrie
Man, I'm in Texas. THIS morning was the first time it's been chilly enough for jackets and now (3:30p) it's 90 degrees. It is the end of November and the temperature has stayed above 100 degrees until this point.
Global warming sucks.
Really - wow.
100 degrees?
And up to 90 today. I've spent a fair amount of time in TX and I don't remember it ever being that hot towards the end of November. Thanks for sharing that.
a reply to: TiredofControlFreaks
Regarding what you posted about Alaska...
That doesn't seem to square with a member here that lives in AK and posted in this thread:
www.abovetopsecret.com...
Seems to me that a member on the ground there might have pretty good info.
Regarding what you posted about Alaska...
That doesn't seem to square with a member here that lives in AK and posted in this thread:
www.abovetopsecret.com...
Seems to me that a member on the ground there might have pretty good info.
This is likely going to be a long reply, so strap in:
It honestly depends on who you mean by "people". Does 'people' represent Climate scientists and their community or does 'people' mean your average non-scientific Joe who just wants honest data and answers. Frankly, if an entire generation can point conclusively to some anamoly, then it's something that should be weighed appropriately.
Your first link shows Anchorage and the second shows Fairbanks. However, seeing as how two things are true, the first being I have no idea where "weatherspark" get's their climatic data from nor how accurate it is and secondly I have never been one to leave it to chance where I can do the work myself.
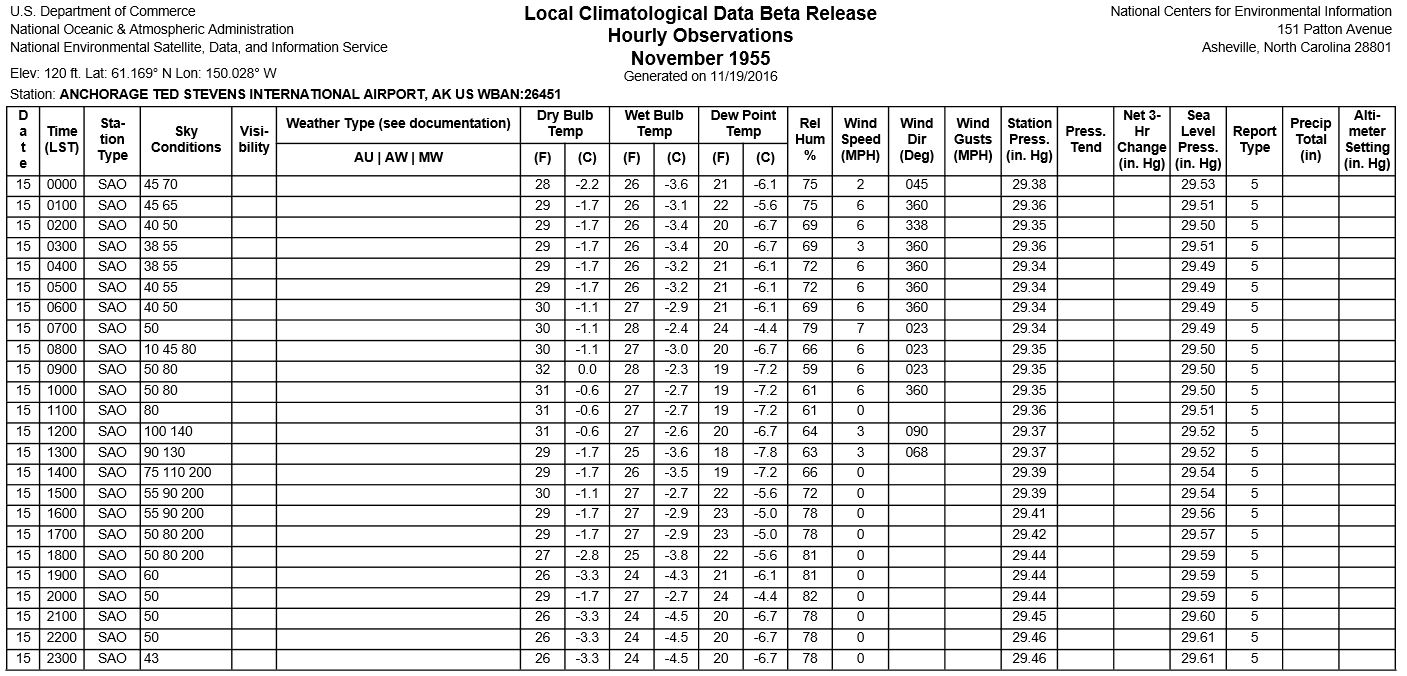
I do however know the accuracy of the National Climatic Data Centers data for historical weather data, and as such have taken it upon myself to create a spreadsheet and charted all temperature variances on a single day in November (that being November 15th - middle of the month) from weather records from the NCDC dating back to 1955. The reason I trust their data is because they have a day by day observed reading analysis that looks like so:
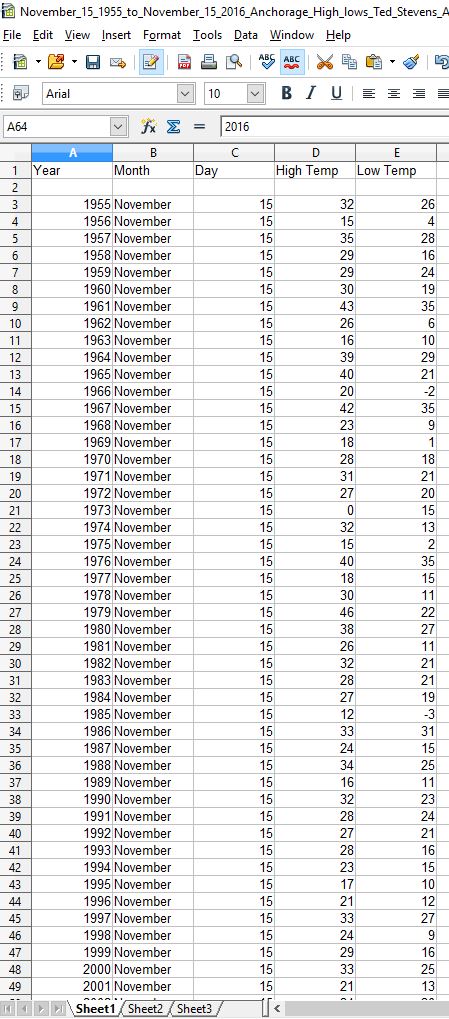
After having collated the data for Anchorage (since that was the data shown in your initial link) from 1955 to 2016 of the single day of each year from the Ted Stevens Airport Station, I set about applying it to the spreadsheet. I chose November 15th as a decent middleground representative to this time of year.
The spreadsheet data looks thusly (though not a complete image of the data):
And the Chart showing the rollercoaster that is Anchorage for the same day each year since 1955 looks like this:
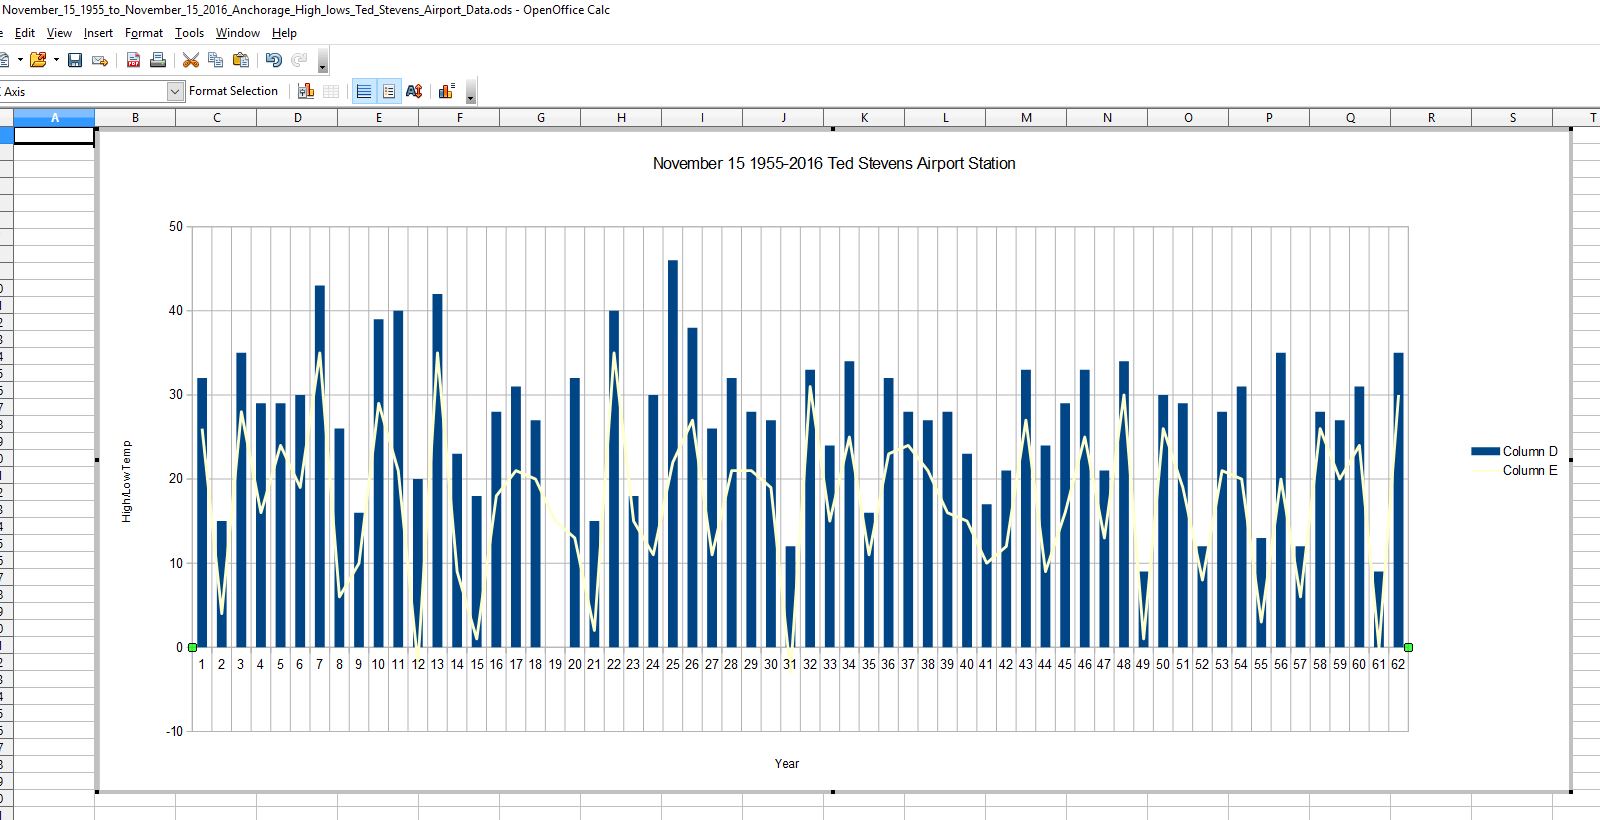
The Horizontal line represents the Low temperature for that day, while the vertical bar represents the high temperature for that day in degrees F.
Now, bear in mind this data shows really nothing other than, that in 62 years the temperature can swing wildly for the same exact date.
So you ask abnormal? I ask what is normal anyway?
Not necessarily...as I've said before in this thread, departures from normal have their value.
I (or anyone really) could apply the same datasets to Fairbanks (or what might be better is Circle) Alaska to get a better picture of any short-term anamolies that may exist - I consider anything shorter than 500 years as short - by simply going to the NCDC Historical Weather records themselves.
Quite true, in the 1970's the big thing was a new ice age was coming; now its warming. With respect to temperature "sky is falling" rhetoric, they've just run out of available options.
originally posted by: TiredofControlFreaks
a reply to: alphabetaone
When people say climate is changing, my first question is: does this change represent something abnormal or is it just a longer cycle that can be seen by just one generation
It honestly depends on who you mean by "people". Does 'people' represent Climate scientists and their community or does 'people' mean your average non-scientific Joe who just wants honest data and answers. Frankly, if an entire generation can point conclusively to some anamoly, then it's something that should be weighed appropriately.
This is the historical temperature data for 1950 in Alaska
weatherspark.com...
This is the current temperature for Fairbanks Alaska:
www.timeanddate.com...
Your first link shows Anchorage and the second shows Fairbanks. However, seeing as how two things are true, the first being I have no idea where "weatherspark" get's their climatic data from nor how accurate it is and secondly I have never been one to leave it to chance where I can do the work myself.
I do however know the accuracy of the National Climatic Data Centers data for historical weather data, and as such have taken it upon myself to create a spreadsheet and charted all temperature variances on a single day in November (that being November 15th - middle of the month) from weather records from the NCDC dating back to 1955. The reason I trust their data is because they have a day by day observed reading analysis that looks like so:
After having collated the data for Anchorage (since that was the data shown in your initial link) from 1955 to 2016 of the single day of each year from the Ted Stevens Airport Station, I set about applying it to the spreadsheet. I chose November 15th as a decent middleground representative to this time of year.
The spreadsheet data looks thusly (though not a complete image of the data):
And the Chart showing the rollercoaster that is Anchorage for the same day each year since 1955 looks like this:
The Horizontal line represents the Low temperature for that day, while the vertical bar represents the high temperature for that day in degrees F.
Now, bear in mind this data shows really nothing other than, that in 62 years the temperature can swing wildly for the same exact date.
So you ask abnormal? I ask what is normal anyway?
I noticed that the original poster article reported only the temperature anomaly and not the actual temperature This is a sure sign that you are reading propaganda
Not necessarily...as I've said before in this thread, departures from normal have their value.
The temperature in Fairbanks Alaska in 1950 was 8 degrees C. Today it is -20 degrees celcius
I know that this is not Arctic temperatures, however, I wanted to show how wide the range of "normal" really is. We have an almost 28 degree range over a period of 66 years in Fairbanks Alaska.
I (or anyone really) could apply the same datasets to Fairbanks (or what might be better is Circle) Alaska to get a better picture of any short-term anamolies that may exist - I consider anything shorter than 500 years as short - by simply going to the NCDC Historical Weather records themselves.
Nobody was screaming and wringing their hands over "global warming" in the 1950s and if they did, please remember that the pundits were wringing their hands over a coming "ice age" by the 1970s.
Quite true, in the 1970's the big thing was a new ice age was coming; now its warming. With respect to temperature "sky is falling" rhetoric, they've just run out of available options.
a reply to: alphabetaone
Thank you for correcting my data alphabetaone! And for making my point.
We need to look at historical temps to see if the current temp is truly abnormal or simply an outlier. An unusual event but well with the realm of the 'norm".
Tired of Control Freaks
Thank you for correcting my data alphabetaone! And for making my point.
We need to look at historical temps to see if the current temp is truly abnormal or simply an outlier. An unusual event but well with the realm of the 'norm".
Tired of Control Freaks
I think the point that struck me is that this is occurring during the ARCTIC NIGHT. IN other words, there is no "day" there. No sun. In a place that
has not been receiving any sun for the past few weeks, that is pretty damned worrying. The arctic is retaining enough heat to push out a cold air
mass, on top of it.
But hey. Trannies in Bathrooms and Gay Marriage and crap. Yeah.
But hey. Trannies in Bathrooms and Gay Marriage and crap. Yeah.
a reply to: TiredofControlFreaks
I wasn't really correcting you, simply bringing clarity and adding to what you had already said, or were questioning.
I wasn't really correcting you, simply bringing clarity and adding to what you had already said, or were questioning.
originally posted by: Krazysh0t
a reply to: Riffrafter
Can't keep saying that Climate Change is a hoax. Reality is starting to catch up with the deniers.
Again with that old lie?... No one denies climate change, however "manmade/anthropogenic climate change is a hoax".
Then there is this.
NASA-Funded Mission Studies the Sun in Soft X-Rays
...
The soft X-ray detector flew first on June 23, 2012, and again on October 21, 2013.
During both flights, there were only a few complex active regions on the sun's surface – indeed, very few during the 2012 flight. Yet, in both flights the detector saw 1000 times more soft X-rays than had been seen by another experiment in 2009. Even a slight extra amount of solar activity in the form of these active regions, led to substantially more output in the soft X-ray wavelengths.
Wavelengths of light correlate to particular temperatures of material on the sun, and this abundance of soft X-rays points to clouds of hot – 5 to 10 million degrees – gases above the active regions that wasn't present during the 2009 measurements when there were no active regions on the sun. That kind of information makes it clear that different heating mechanisms occur on the quiet sun and active regions, opening the door to determining the differences. One theory for the source of this mysterious heating is that numerous tiny explosions called nanoflares are constantly erupting on the sun. Nanoflares are too small to be seen by our telescopes, but powerfully energetic nonetheless. The soft X-rays might well be a result of nanoflares, thus giving us a way of investigating them.
The new soft X-ray data differed from previous data studies in another respect as well. By parsing out the amounts of each individual wavelength of light gathered, the team could identify what elements were present in the corona. Typically, the abundance of some of these atoms in the corona is greater than at the sun's surface. But not so in these recent observations. The mix of material in the corona was more similar to the mix seen at the solar surface, suggesting that some material from the surface was somehow rising up higher into the atmosphere.
"The difference we see in the abundances of the elements compared to previous studies suggest there may be a link between the heating mechanism and the coronal composition," said Caspi.
Untangling the elements present on the sun's surface and in its atmosphere during different events on the sun could offer another set of tools for interpreting what heats the corona.
Discovering that the soft X-ray emission was brighter than supposed has effects for understanding space weather events near Earth as well. Different wavelengths of light from the sun penetrate to different layers of Earth's atmosphere, causing different effects.
"The solar soft X-rays are deposited lower in Earth's atmosphere than the sun's extreme ultraviolet radiation," says Tom Woods, a co-author on the paper and the principal investigator for this experiment at the University of Colorado in Boulder. "The soft X-rays cause almost instantaneous changes in the ionosphere that can disturb radio communications and the accuracy of GPS navigation systems."
Such changes in the ionosphere happen during large explosions on the sun called solar flares. As humans attempt to better understand – and predict – the sun's effects on the space through which our communication signals travel, it's crucial that we have accurate models to simulate what the sun is sending our way and when.
...
www.nasa.gov...
The sun, and the entire environment of the solar system is changing.
Not that long ago we also saw this.
X-rays that don't come from any known source
NASA-funded sounding rocket solves one cosmic mystery, reveals another
Date:
September 26, 2016
Source:
NASA
Summary:
Space is filled with types of light we can't see -- from infrared signals released by hot stars and galaxies, to the cosmic microwave background. Some of this invisible light that fills space takes the form of X-rays, the source of which has been hotly contended over the past few decades. A new study confirms some ideas about where these X-rays come from, shedding light on our solar neighborhood's early history. But it also reveals a new mystery -- an entire group of X-rays that don't come from any known source.
...
However, DXL also measured some high-energy X-rays that couldn't possibly come from the solar wind or the Local Hot Bubble.
"At higher energies, these sources contribute less than a quarter of the X-ray emission," said Youaraj Uprety, lead author on the study and an astrophysicist at University of Miami at the time the research was conducted. "So there's an unknown source of X-rays in this energy range."
...
www.sciencedaily.com...
The known sources of x-rays are contributing only to a quarter of the seen high energy x-rays the solar system is receiving, so there seems to be an outside source that is increasing these x-ray high energy particles. Whatever this source is is sending our way 3/4 of the high energetic x-rays we are receiving. This in turn would of course cause changes on the entire solar system, including Earth's climate.
edit on 20-11-2016 by ElectricUniverse because: add and correct comment.
BTW, the most likely culprit of this increase in high energetic x-rays the entire solar system is receiving, which will continue to cause chaos
including to our climate, is the different region of the local bubble we will completely enter within 100 years.
Solar system caught in an interstellar tempest
[atsimg]http://files.abovetopsecret.com/images/member/63ffeeb144dd.jpg[/atsimg]
This was predicted since at least the 1970s, and those predictions stated such an encounter would drastically change Earth's climate. In 1996 University of Chicago astrophysicist Priscilla Frisch also made predictions that such an encounter would "have substantial implications for our solar system’s interplanetary environment", but her research indicated we would not encounter this cloud for 50,000 years. However, now we know differently, and we know our solar system will be well within this cloud in about 100 years.
The thing is, we have been encountering small cloudlets of this region of the Local bubble which has caused many changes to the solar system environment, including to our climate.
edit on 20-11-2016 by ElectricUniverse because: add links.
edit on 20-11-2016 by ElectricUniverse because: correct comment.
a reply to: ElectricUniverse
Once again you are full of crap. Fail on your part!
The warming we are experiencing is a result of the excess CO2 we are dumping the atmosphere.
Once again you are full of crap. Fail on your part!
The warming we are experiencing is a result of the excess CO2 we are dumping the atmosphere.
originally posted by: worldstarcountry
well, if all the ice already melted, and we all still don't have a beach in our backyard, maybe it was all hype???
FYI.....melting sea ice doesn't raise sea level because it's already in the sea. It's melting glaciers and other ice that currently sits on land that contributes to rising sea level.
a reply to: ElectricUniverse
So you believe the sun and solar flares, CME's, etc affect our weather?
Absolutely!
Anyone who doesn't believe that the sun affects our climate has their head in the sand. The sun is the single biggest factor affecting our climate. Always was, and always will be.
With that said, I also believe the human race has been negatively impacting our climate. If you step away and take 2 seconds to think about, it's a no-brainer.
We all have to get out of our political positions and look at this issue critically and honestly.
On a final note - I think we can come to better understanding of this, but I don't think there's a damn thing we can do about it at this point except try not to make things worse.
edit on 11/20/2016 by Riffrafter because: (no reason given)
a reply to: Riffrafter
Well now I am wondering what the temperature in the Arctic really is
www.scientificamerican.com...
So now the warmists have corrected Arctic temperatures by substituting an "adjusted" satellite temperture record to correct a "pause" in the temperature record that they never officially recognised.
What I get from this article is that the Arctic is warming more than the rest of the world, which makes the warming a regional artifact and not a global one!
Tired of Control Freaks
Well now I am wondering what the temperature in the Arctic really is
www.scientificamerican.com...
The new study, accepted for publication in the Quarterly Journal of the Royal Meteorological Society, suggests one of the reasons for the apparent slowdown in warming might lie in the fact that the Arctic, which has been warming much, much faster than the rest of the world, is under-represented in the HadCRUT4 temperature series. In order to figure this out, the researchers found a clever way to take satellite observations, which measure temperature all over the Earth, including the poles, and put them into the global surface temperature data set in places where it lacked good coverage. "The satellite data gives us a sort of geographical distribution of temperatures. It's got very good coverage, just a tiny little hole at each pole," Cowtan said.
So now the warmists have corrected Arctic temperatures by substituting an "adjusted" satellite temperture record to correct a "pause" in the temperature record that they never officially recognised.
What I get from this article is that the Arctic is warming more than the rest of the world, which makes the warming a regional artifact and not a global one!
Tired of Control Freaks
originally posted by: TiredofControlFreaks
What I get from this article is that the Arctic is warming more than the rest of the world, which makes the warming a regional artifact and not a global one!
Tired of Control Freaks
In fairness to the science behind the endeavor, that shouldn't necessarily be the take away from that. In fact, just the opposite. If the Arctic is shown to be warming much much more quickly than the rest of the planet, it actually portends that the rest of the planet will inarguably become much warmer over time as one is reliant on the other to maintain a temperate global climate.
I cant help but to get the feeling that people (and even some scientists to a degree) are looking for a magical 'smoking gun' that they can quantify and put to rest via "OK! Now we have causation that is tangible" meanwhile conveniently ignoring that the entirety of myriad systems work in concert. It is completely irresponsible of us, as the greatest reasoning organisms on this planet, to relinquish ourselves to the narrow-minded vision of single causation.
My opinion, as it has been for many years, is the lacking study (for obvious reasons) of undersea volcanism, where is should play a much larger part. However, to understand it's influence, we also have to understand their above ground strato and caldera based volcanoes as well. Until very recently we hadn't even the notion of lesser understood influences upon both systems, but we're getting there. Take for instance a 10 year study by Maya Tolstoy of Columbia University's Lamont-Doherty Earth Observatory. In it she describes how what was once thought of as a steady state (ridges open, exude lava pillows, event ends in a steady cycle) can be anything but. If interested read more here.
"People have ignored seafloor volcanoes on the idea that their influence is small -- but that's because they are assumed to be in a steady state, which they're not," said the study's author, marine geophysicist Maya Tolstoy of Columbia University's Lamont-Doherty Earth Observatory. "They respond to both very large forces, and to very small ones, and that tells us that we need to look at them much more closely." A related study by a separate team this week in the journal Science bolsters Tolstoy's case by showing similar long-term patterns of submarine volcanism in an Antarctic region Tolstoy did not study.
Volcanically active mid-ocean ridges crisscross earth's seafloors like stitching on a baseball, stretching some 37,000 miles. They are the growing edges of giant tectonic plates; as lavas push out, they form new areas of seafloor, which comprise some 80 percent of the planet's crust.
What can be gleaned from the study is that often seafloor volcanism can be explosive yet be cause by subtle changes in Earth's position to the Sun and gravitational forces imparted the Oceans as well as total amount of Earth's ice cover in general. The two systems - above ground volcanoes and undersea volcanoes - work in concert during warming and ice age cycles to offset one another.
Of special note in the study would be the metric tonnes and release estimates of CO2, the conventional wisdom is that it would take maybe 1 to 2 thousand years to expel the CO2 released from the collective eruptions, however as this is an ongoing process and as our records of the activity are sorely lacking, who's to say what the past activity has been like? Perhaps 2000 years ago the activity was so intense that only now is the CO2 from their eruptions being released at a rate which would be considered higher than normal...and the blame of course, being put on man's activity.
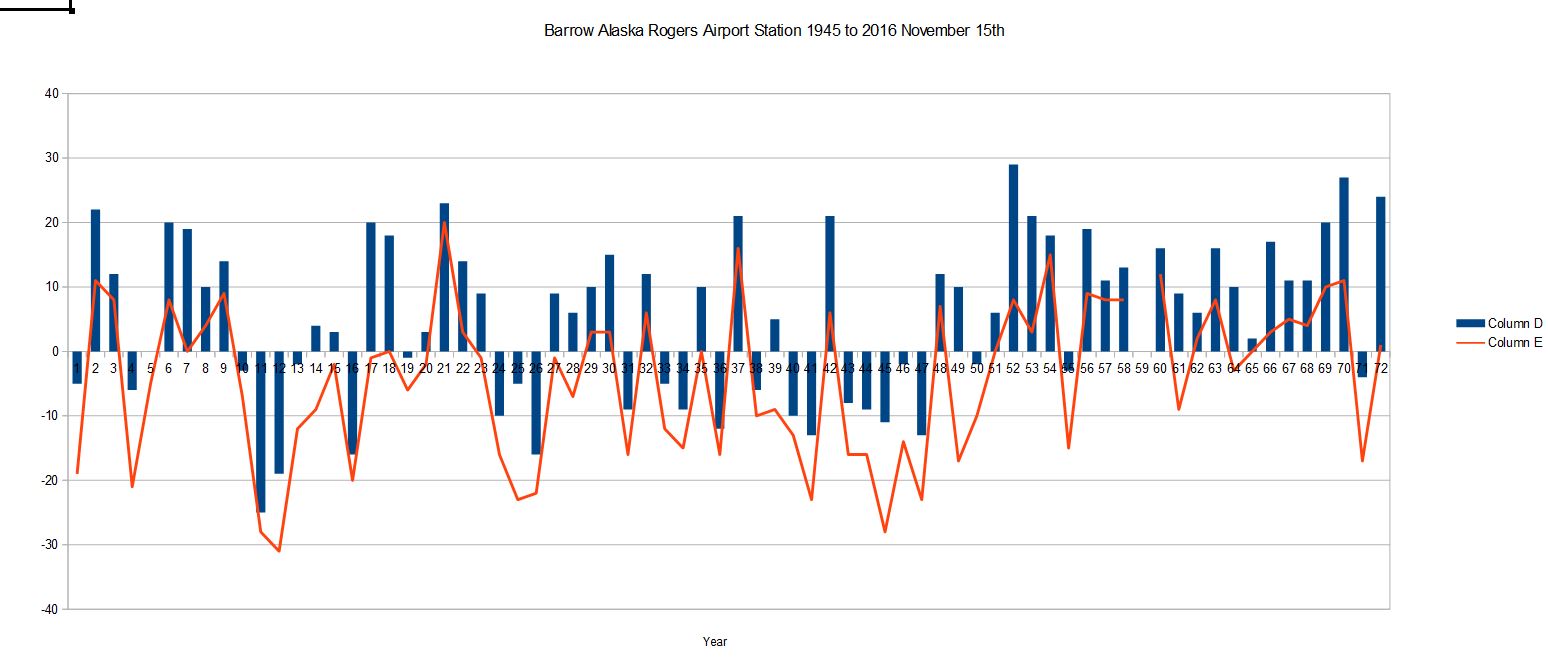
As a point of reference, since my last wall of text post, I decided that Anchorage was not a fair example of temperature fluctuation with respect to the threads title, that being the arctic. So, I took it upon myself once again to collate numbers from the NCDC but this time from Barrow Alaska's Rogers Airport Post W Station...for the same date as before, November 15th ranging from 1945 to 2016. Barrow is likely one of the coldest places on Earth.
It shows equally as wild temperature swings both to the positive and negative, the vertical bars being the High Temp for that day, the Horizontal line showing Low Temp for the day
edit on 20-11-2016 by alphabetaone because: (no reason given)
Forecast for next several days...like this fluid map. Yeah, it is warm in NA. Not so much in Siberia/China.
globalweatherlogistics.com...
globalweatherlogistics.com...
originally posted by: TKDRL
a reply to: jrod
Very insightful retort
What is your opinion on this? We dont need mindless tu quo que posts.
Do you have a clue about the CO2 trend? I freaking doubt it!
I hate it when i try to contribute good information to these threads, just to watch it get drowned out by spammers that knowingly post bad information over and over again. TiredofControlFreaks and ElectricUniverse are guilty of thism
edit on 20-11-2016 by jrod because: Distracted
a reply to: worldstarcountry
Water not in your backyard? That's the perfect level of forethought for a planet.
Water not in your backyard? That's the perfect level of forethought for a planet.
This also sounds like the calm before the storm. With every mini ice age, comes warm weather first.
But who can say when it's going to hit us.
But who can say when it's going to hit us.
new topics
-
A man of the people
Diseases and Pandemics: 24 minutes ago -
Ramblings on DNA, blood, and Spirit.
Philosophy and Metaphysics: 47 minutes ago -
4 plans of US elites to defeat Russia
New World Order: 2 hours ago -
Thousands Of Young Ukrainian Men Trying To Flee The Country To Avoid Conscription And The War
Other Current Events: 5 hours ago -
12 jurors selected in Trump criminal trial
US Political Madness: 8 hours ago -
Iran launches Retalliation Strike 4.18.24
World War Three: 8 hours ago -
Israeli Missile Strikes in Iran, Explosions in Syria + Iraq
World War Three: 9 hours ago
top topics
-
George Knapp AMA on DI
Area 51 and other Facilities: 14 hours ago, 25 flags -
Israeli Missile Strikes in Iran, Explosions in Syria + Iraq
World War Three: 9 hours ago, 16 flags -
Louisiana Lawmakers Seek to Limit Public Access to Government Records
Political Issues: 17 hours ago, 7 flags -
Iran launches Retalliation Strike 4.18.24
World War Three: 8 hours ago, 6 flags -
Not Aliens but a Nazi Occult Inspired and then Science Rendered Design.
Aliens and UFOs: 14 hours ago, 5 flags -
Thousands Of Young Ukrainian Men Trying To Flee The Country To Avoid Conscription And The War
Other Current Events: 5 hours ago, 4 flags -
12 jurors selected in Trump criminal trial
US Political Madness: 8 hours ago, 4 flags -
4 plans of US elites to defeat Russia
New World Order: 2 hours ago, 2 flags -
Ramblings on DNA, blood, and Spirit.
Philosophy and Metaphysics: 47 minutes ago, 1 flags -
A man of the people
Diseases and Pandemics: 24 minutes ago, 0 flags
active topics
-
4 plans of US elites to defeat Russia
New World Order • 8 • : Lazy88 -
Mandela Effect - It Happened to Me!
The Gray Area • 111 • : CCoburn -
So I saw about 30 UFOs in formation last night.
Aliens and UFOs • 31 • : Encia22 -
AARO/Dr Kirkpatrick-Caught Lying in UAP report.
Aliens and UFOs • 25 • : Jukiodone -
Russia Flooding
Fragile Earth • 17 • : Kurokage -
A man of the people
Diseases and Pandemics • 0 • : PrivateAngel -
The Acronym Game .. Pt.3
General Chit Chat • 7729 • : CCoburn -
It has begun... Iran begins attack on Israel, launches tons of drones towards the country
World War Three • 889 • : bally001 -
12 jurors selected in Trump criminal trial
US Political Madness • 23 • : gspatfound -
Ramblings on DNA, blood, and Spirit.
Philosophy and Metaphysics • 0 • : BrotherKinsMan