It looks like you're using an Ad Blocker.
Please white-list or disable AboveTopSecret.com in your ad-blocking tool.
Thank you.
Some features of ATS will be disabled while you continue to use an ad-blocker.

A timeline of Earth's average temperature from the Ice Age onward in one XKCD comic
page: 1share:
Do you like XKCD?
It's not on my top favorites, but I read it from time to time. One XKCD catchphrase my husband and I use on each other is "Someone is wrong on the Internet." which makes a perfect excuse for why we're hanging out on the computer instead of getting up and "adulting."
One of the recent interesting things was his timeline of Earth's average temperature starting at 20,000 BCE and continuing up to today. If you think climate change is nonsense you probably won't enjoy the bottom part of the comic, but it's interesting to see that as the temperature rises slightly, we become more productive and inventive. It's not surprising given that our distant ancestors are from sub-Saharan Africa, I suppose.
Dispatches From Turtle Island blog has an interesting followup to that.
...which really perfectly describes the comic.
Not something I was generally aware of, but it makes an interesting point to consider when we're looking at prehistory. The climate back then was NOT very stable and you can't set up farming if one April is warm and sunny and then two Aprils later you have a drought and six Aprils after that you've got a blanket of snow. The Turtle Island blog has a wicked chart full of spiky datapoints that show a climate undergoing extreme changes in short (50-100 year) time periods -- or, within 2-3 generations if you like to think of it that way.
This would impact what plants naturally grow where (and it's this kind of paleoclimate evidence that makes an interesting study.)
Oh... yeah... look for the Easter Egg (point at which Pokemons become extinct)!
It's not on my top favorites, but I read it from time to time. One XKCD catchphrase my husband and I use on each other is "Someone is wrong on the Internet." which makes a perfect excuse for why we're hanging out on the computer instead of getting up and "adulting."
One of the recent interesting things was his timeline of Earth's average temperature starting at 20,000 BCE and continuing up to today. If you think climate change is nonsense you probably won't enjoy the bottom part of the comic, but it's interesting to see that as the temperature rises slightly, we become more productive and inventive. It's not surprising given that our distant ancestors are from sub-Saharan Africa, I suppose.
Dispatches From Turtle Island blog has an interesting followup to that.
First, xkcd has repeatedly demonstrated that often there is just no good substitute for drawing something to scale, even if that means it won't fit on the confines of an ordinary sized comic, or an ordinary sized piece of paper or book.
...which really perfectly describes the comic.
Second, while the comic is largely spot on when it comes to historical dates, the smoothing in the temperature diagram (which the author, in fairness, acknowledges is present in the comic) comes at the cost of a pretty important feature of the data from the period of about 40,000 to 10,000 years ago, which is that the temperature was wildly unstable and oscillated dramatically over much of that time frame, which is one important reason that farming had trouble establishing itself. It is hard to establish agriculture when one generation one set of crops work, and two generations later, an entirely different climate prevails.
Not something I was generally aware of, but it makes an interesting point to consider when we're looking at prehistory. The climate back then was NOT very stable and you can't set up farming if one April is warm and sunny and then two Aprils later you have a drought and six Aprils after that you've got a blanket of snow. The Turtle Island blog has a wicked chart full of spiky datapoints that show a climate undergoing extreme changes in short (50-100 year) time periods -- or, within 2-3 generations if you like to think of it that way.
This would impact what plants naturally grow where (and it's this kind of paleoclimate evidence that makes an interesting study.)
Oh... yeah... look for the Easter Egg (point at which Pokemons become extinct)!
edit on 13-9-2016 by Byrd because: (no reason given)
I would expect things to warm up if you are coming out of an ice age... The time frame for the warm up is a serious question and where the peak will
be before the oscillation starts over again for another freeze that is an appropriate question IMO..?
edit on 727thk16 by 727Sky because:
..
originally posted by: 727Sky
I would expect things to warm up if you are coming out of an ice age... The time frame for the warm up is a serious question and where the peak will be before the oscillation starts over again for another freeze that is an appropriate question IMO..?
And then, who was recording the temperature back then. In Celsius, even.
originally posted by: Aldakoopa
originally posted by: 727Sky
I would expect things to warm up if you are coming out of an ice age... The time frame for the warm up is a serious question and where the peak will be before the oscillation starts over again for another freeze that is an appropriate question IMO..?
And then, who was recording the temperature back then. In Celsius, even.
The Earth itself records it. You simply have to learn to read the documents -- in this case, mud cores, soil horizons, tree rings, river beds, etc, etc.
a reply to: Byrd
Sigh.
Getting facts from "comics"....liberals....
Try real data and some perspective:
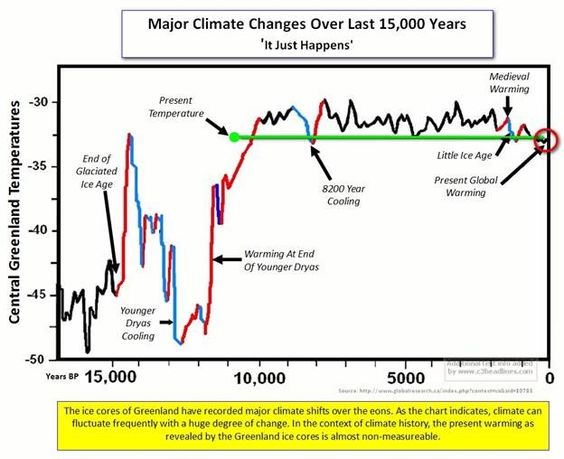
You can clearly see humans have had minimal impact. The lion's share of the rise ( that continues to this day) is what you can naturally expect coming out of an ice age.... and,no, prehistoric humans living in caves can no more affect temperature than they can influence volcanos...
Deny ignorance....
Sigh.
Getting facts from "comics"....liberals....
Try real data and some perspective:
You can clearly see humans have had minimal impact. The lion's share of the rise ( that continues to this day) is what you can naturally expect coming out of an ice age.... and,no, prehistoric humans living in caves can no more affect temperature than they can influence volcanos...
Deny ignorance....
originally posted by: BlueJacket
a reply to: 727Sky
I just find it hillarious to take a snippet out of the end of the iceage and try to correlate that model to trends over 4 billion years.
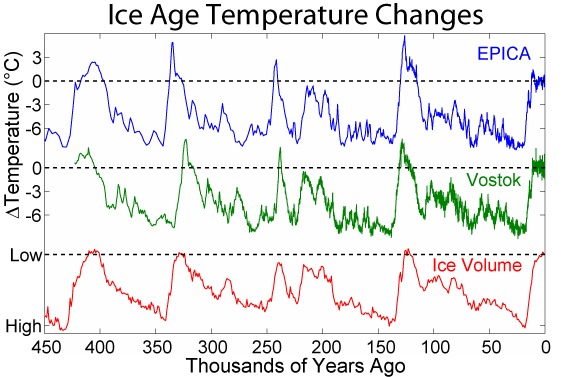
better ?
Better?
edit on 9/13/2016 by schuyler because: (no reason given)
a reply to: M5xaz
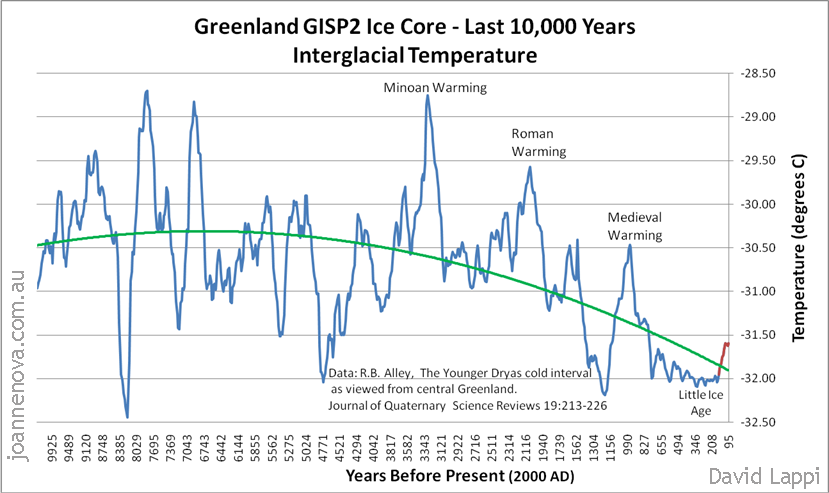
You know that the Greenland ice core data ends more than 150 years ago, right?
www.abovetopsecret.com...
Got anything more up to date?
You know that the Greenland ice core data ends more than 150 years ago, right?
www.abovetopsecret.com...
Got anything more up to date?
edit on 9/13/2016 by Phage because: (no reason given)
a reply to: BlueJacket
Who is trying to do that?
I just find it hillarious to take a snippet out of the end of the iceage and try to correlate that model to trends over 4 billion years.
Who is trying to do that?
a reply to: Phage
Human civilization should have no relevance when debating Earth climate models, to get a correct picture of the cycle of the planets climate (not our climate, it's Earths climate) you need to go far back.
In statistics any data sample that consists of 0.00023% of the entire data would be laughed at, but climate science, it's open season and perfectly valid.
Not that we'll ever be able to access core samples billions of years old but still, the data we have is so small, I can't believe any scientist would actually use it objectively to argue for or against
What happens if Earth has some weird 50,000 year cycle and we happen to be going through it now ? We simply don't have the data available to say what is cyclical and what is not, if science teaches us anything, it teaches us how very little we actually know about life and the universe.
a reply to: Discotech
Since human civilization can be profoundly affected by climate, I'm pretty sure there is relevance. As has been pointed out, we have a pretty good picture of Earth's major climate cycles. We also know about the physics involved. Tell me, what is causing the recent and dramatic warming trend? Did the Sun get hotter? Did Earth's orbit change?
Human civilization should have no relevance when debating Earth climate models, to get a correct picture of the cycle of the planets climate (not our climate, it's Earths climate) you need to go far back.
Since human civilization can be profoundly affected by climate, I'm pretty sure there is relevance. As has been pointed out, we have a pretty good picture of Earth's major climate cycles. We also know about the physics involved. Tell me, what is causing the recent and dramatic warming trend? Did the Sun get hotter? Did Earth's orbit change?
Some people think that means we don't know anything.
We simply don't have the data available to say what is cyclical and what is not, if science teaches us anything, it teaches us how very little we actually know about life and the universe.
edit on 9/13/2016 by Phage because: (no reason given)
a reply to: Phage
Oh for christs sake...the bloody earth is over 4 billion years old, taking the last 20k years at the end of the most recent ice age does not represent in any way how climate trends over the span of the planets existence...did you not view the comic?
Oh for christs sake...the bloody earth is over 4 billion years old, taking the last 20k years at the end of the most recent ice age does not represent in any way how climate trends over the span of the planets existence...did you not view the comic?
edit on 13-9-2016 by BlueJacket because: sp
originally posted by: M5xaz
a reply to: Byrd
Sigh.
Getting facts from "comics"....liberals....
Try real data and some perspective:
You can clearly see humans have had minimal impact. The lion's share of the rise ( that continues to this day) is what you can naturally expect coming out of an ice age.... and,no, prehistoric humans living in caves can no more affect temperature than they can influence volcanos...
Deny ignorance....
Yes, deny ignorance. Yours and everyone who gave you stars, anyway.
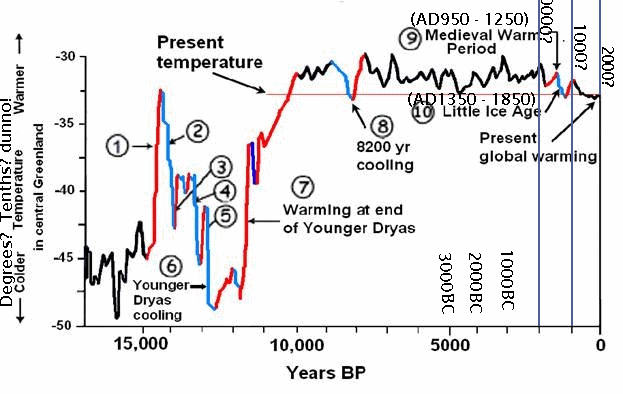
Notice the dates when these things happened in parenthesis, as compared with where they are labeled on your chart (and this one, which I suspect is the origin of that one).
Where did you get this garbage chart?
Let me drive this point home:
Your chart says the Medieval Warm Period ended ~1500 years ago. The MWP ended ~1250AD, which was 766 years ago. Never mind the rest of the messed up dates.
Additionally, notice the scale on the left: 2.5 degrees Celsius between ticks. 2015 was 0.90 degrees Celsius above 20th century average.
Your chart is a bull#, essentially a hoax with that labeling, and you are willfully or ignorantly perpetuating it.
edit on 19Tue, 13 Sep 2016
19:11:48 -0500America/ChicagovAmerica/Chicago9 by Greven because: (no reason given)
new topics
-
Las Vegas UFO Spotting Teen Traumatized by Demon Creature in Backyard
Aliens and UFOs: 3 hours ago -
2024 Pigeon Forge Rod Run - On the Strip (Video made for you)
Automotive Discussion: 4 hours ago -
Gaza Terrorists Attack US Humanitarian Pier During Construction
Middle East Issues: 4 hours ago -
The functionality of boldening and italics is clunky and no post char limit warning?
ATS Freshman's Forum: 5 hours ago -
Meadows, Giuliani Among 11 Indicted in Arizona in Latest 2020 Election Subversion Case
Mainstream News: 6 hours ago -
Massachusetts Drag Queen Leads Young Kids in Free Palestine Chant
Social Issues and Civil Unrest: 6 hours ago -
Weinstein's conviction overturned
Mainstream News: 7 hours ago -
Supreme Court Oral Arguments 4.25.2024 - Are PRESIDENTS IMMUNE From Later Being Prosecuted.
Above Politics: 9 hours ago -
Krystalnacht on today's most elite Universities?
Social Issues and Civil Unrest: 9 hours ago -
Chris Christie Wishes Death Upon Trump and Ramaswamy
Politicians & People: 10 hours ago
top topics
-
Krystalnacht on today's most elite Universities?
Social Issues and Civil Unrest: 9 hours ago, 9 flags -
Supreme Court Oral Arguments 4.25.2024 - Are PRESIDENTS IMMUNE From Later Being Prosecuted.
Above Politics: 9 hours ago, 8 flags -
Weinstein's conviction overturned
Mainstream News: 7 hours ago, 7 flags -
University of Texas Instantly Shuts Down Anti Israel Protests
Education and Media: 12 hours ago, 6 flags -
Massachusetts Drag Queen Leads Young Kids in Free Palestine Chant
Social Issues and Civil Unrest: 6 hours ago, 5 flags -
Gaza Terrorists Attack US Humanitarian Pier During Construction
Middle East Issues: 4 hours ago, 5 flags -
Meadows, Giuliani Among 11 Indicted in Arizona in Latest 2020 Election Subversion Case
Mainstream News: 6 hours ago, 5 flags -
Las Vegas UFO Spotting Teen Traumatized by Demon Creature in Backyard
Aliens and UFOs: 3 hours ago, 3 flags -
Chris Christie Wishes Death Upon Trump and Ramaswamy
Politicians & People: 10 hours ago, 2 flags -
2024 Pigeon Forge Rod Run - On the Strip (Video made for you)
Automotive Discussion: 4 hours ago, 2 flags
active topics
-
University of Texas Instantly Shuts Down Anti Israel Protests
Education and Media • 203 • : cherokeetroy -
Las Vegas UFO Spotting Teen Traumatized by Demon Creature in Backyard
Aliens and UFOs • 8 • : Macenroe82 -
British TV Presenter Refuses To Use Guest's Preferred Pronouns
Education and Media • 163 • : rigel4 -
SHORT STORY WRITERS CONTEST -- April 2024 -- TIME -- TIME2024
Short Stories • 23 • : DontTreadOnMe -
Meadows, Giuliani Among 11 Indicted in Arizona in Latest 2020 Election Subversion Case
Mainstream News • 13 • : xuenchen -
-@TH3WH17ERABB17- -Q- ---TIME TO SHOW THE WORLD--- -Part- --44--
Dissecting Disinformation • 684 • : daskakik -
Any one suspicious of fever promotions events, major investor Goldman Sachs card only.
The Gray Area • 10 • : Caver78 -
Chris Christie Wishes Death Upon Trump and Ramaswamy
Politicians & People • 21 • : WhitewaterSquirrel -
Supreme Court Oral Arguments 4.25.2024 - Are PRESIDENTS IMMUNE From Later Being Prosecuted.
Above Politics • 78 • : chr0naut -
The Acronym Game .. Pt.3
General Chit Chat • 7750 • : bally001