It looks like you're using an Ad Blocker.
Please white-list or disable AboveTopSecret.com in your ad-blocking tool.
Thank you.
Some features of ATS will be disabled while you continue to use an ad-blocker.

Climate Change Denial, Anyone?
page: 10share:
a reply to: ausername
You want to see a more interesting graph?
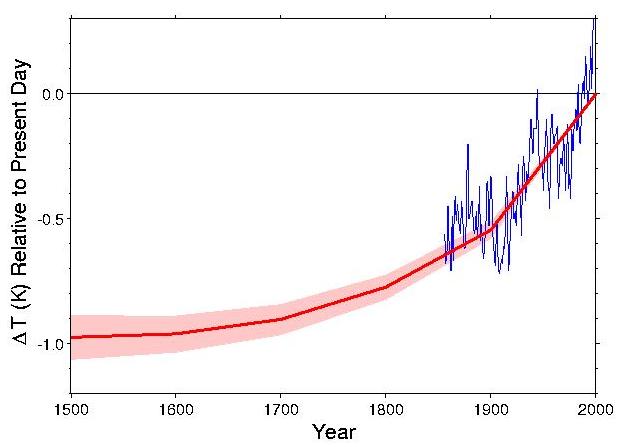
www.ncdc.noaa.gov...
See how temperatures were already increasing in the 1600s? And that temperature was taken from boreholes (underground) which means either the Earth's surface has been warming from it's core, or the warming started even before the 1600s. If the atmosphere had been warming the Earth's surface and underground, there would be a lag because it takes more energy to warm a solid, such as soil, and rock, than it takes to warm gases such as the Earth's atmosphere.
Want to see another interesting graph?
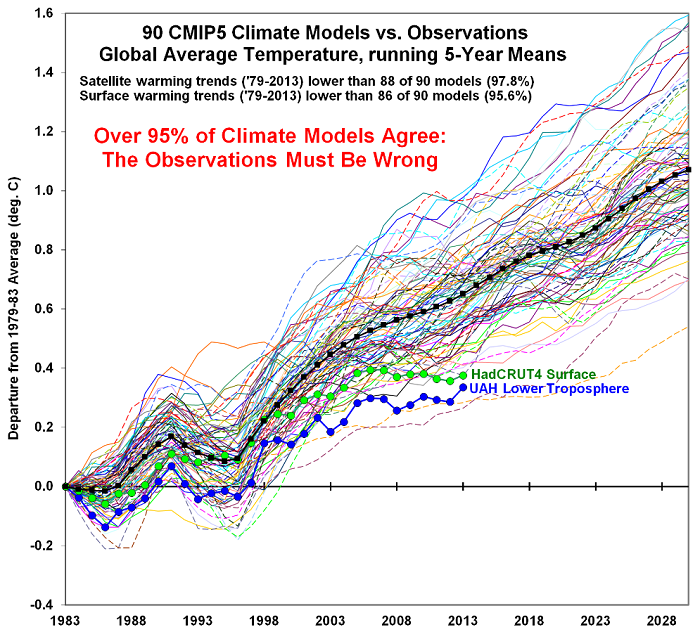
www.drroyspencer.com...
Global Climate models/aka computer models are wrong. Only 5% of them seem to correlate with observation, and that 5% could be by chance.
You want to see a more interesting graph?
www.ncdc.noaa.gov...
See how temperatures were already increasing in the 1600s? And that temperature was taken from boreholes (underground) which means either the Earth's surface has been warming from it's core, or the warming started even before the 1600s. If the atmosphere had been warming the Earth's surface and underground, there would be a lag because it takes more energy to warm a solid, such as soil, and rock, than it takes to warm gases such as the Earth's atmosphere.
Want to see another interesting graph?
www.drroyspencer.com...
Global Climate models/aka computer models are wrong. Only 5% of them seem to correlate with observation, and that 5% could be by chance.
edit on 10-5-2016 by ElectricUniverse because: add link.
edit on 10-5-2016 by ElectricUniverse because: add link.
originally posted by: ElectricUniverse
originally posted by: Greven
Measured CO2 has always led temperature rise.
Inferred CO2 (ice cores & other sources) has considerable wiggle room due to error.
Wrong...
Atmospheric Carbon Dioxide Lags Temperature: the Proof
Published on June 13, 2014
Written by Dr Pierre Latour PE
Man-made global warming promoters claim the high correlation between carbon dioxide (CO2) and atmospheric temperature (T) in the 420,000 year ice core record proves CO2 causes T to change. Herein is demonstrated how the evidence conflicts with that belief.
CO2 fraud
Basics. First, correlation alone only proves correlation, not cause and effect. Physics is required to describe and prove cause and effect. Second if increasing CO2 did cause T to increase, there must be some physical lag or delay in the response of T to CO2; average T of whole atmosphere, oceans and land masses cannot respond instantaneously to CO2, no matter how strong the cause.
In fact many researchers claim CO2 actually lags T, proving CO2 cannot cause T changes at all. Rather T causes CO2.
What could cause CO2 to lag warming? Its solubility in water? Yes, that explains the data well. Simply put, when oceans warm due to greater solar energy absorption, they outgas dissolved CO2 just like soda water does because CO2 is less soluble in warm water than cold. When oceans are chilled, they absorb CO2 gas and hold it because CO2 is more soluble. Tropical seas hold less CO2/m3 than polar seas do. en.wikipedia.org...
The lag is measured to be about 800 years and confirmed by theory.
Data analysis. After studying that mechanism in 2009 and Al Gore’s 420,000 years of T and CO2 data in his “Inconvenient Truth” movie and National Geographic June 2007 Big Thaw article and insert, their data confirm it was a lag, not a lead.
Houston’s University of St Thomas, Environmental Sciences Department also confirmed the 800 year lag at their April 21, 2009 Conference with Jill Hasling, Weather Research Center, Houston, as have many others.
The measurement is done by inputting T data to a lag model with an assumed lag time constant, τ, and comparing lagged T data output with raw CO2 data. This rigorously accounts for different frequencies. If a lag time can be found that provides a close match between lagged T and CO2, the lag time assumption would be verified by measurement.
The lag model is yi = f*xi + (1-f)yi-1, a discrete form of low-pass filter or electrical RC circuit. en.wikipedia.org...
xi is the series of T data for i = 1, 2, 3, …….. and yi is series of lagged or filtered T data.
Filter factor f = del t/(τ + del t) < 1, where del t is the sampling time interval between xi data points, probably about 10 years.
Computer programs easily find the value for f and τ that best fits the 420,000 year data sequence of lagged yi to CO2i. The result is τ = about 800 years. Of course it may vary by a 100 years or so. The point is the lag τ > 0.
Role of Science. This correlation becomes a proven cause and effect relation when physics explains and predicts what is observed. This value is predicted by ocean circulation rates and mass transfer rate of CO2 across oceans’ gas-liquid surface interface.
...
principia-scientific.org...
CO2 level increases almost always lag temperature increases. The only difference is when a massive event occurs, such as a large meteorite hitting Earth and releases large amounts of co2 from the oceans, or from the soil. Or during very large volcanic eruptions.
You've gotta be screwing with me... right? You aren't really so misinformed as to believe that stuff... please give me hope for humanity...
This is not a scientific website - it is a private company masquerading as such. I'm not even joking here. Hell, read this one - a response to criticism by Dr. Roy Spencer of this company.
How about this, you back up their claims, like this:
Man-made global warming promoters claim the high correlation between carbon dioxide (CO2) and atmospheric temperature (T) in the 420,000 year ice core record proves CO2 causes T to change
WHO claims that? It's long been a (valid) critique by climate skeptics that CO2 in ice cores are not well correlated with time. This is a strawman.
The lag model is yi = f*xi + (1-f)yi-1, a discrete form of low-pass filter or electrical RC circuit.
The lag model for CO2 following temperature is an electrical circuit. Uh...huh...
The theoretical time lag is Tlag = mCp/r*A*f*Tw.
This says big oceans, large m, with high heat capacity, Cp, have big lag. Thin oceans with large A have small lag. If mass transfer rate r is large, lag is small. If Tw is high, outgassing rate is large and lag is small.
Gotta watch out for them there big oceans. Thin ones are okay though. How can you possibly take it seriously?
Further, half of the text in that 'document' is laughable. Wikipedia citations. Random stuff like this:
First, correlation alone only proves correlation, not cause and effect. Physics is required to describe and prove cause and effect.
The mind boggles.
Do you do ANY research into sources before posting them? Do you even read this stuff before posting it as evidence to back your claims?!?
These people are nuts or paid shills. Please do better.
originally posted by: ElectricUniverse
a reply to: ausername
You want to see a more interesting graph?
www.ncdc.noaa.gov...
See how temperatures were already increasing in the 1600s? And that temperature was taken from boreholes (underground) which means either the Earth's surface has been warming from it's core, or the warming started even before the 1600s. If the atmosphere had been warming the Earth's surface and underground, there would be a lag because it takes more energy to warm a solid, such as soil, and rock, than it takes to warm gases such as the Earth's atmosphere.
Want to see another interesting graph?
www.drroyspencer.com...
Global Climate models/aka computer models are wrong. Only 5% of them seem to correlate with observation, and that 5% could be by chance.
Interesting, but you are now citing evidence that it has markedly increased in temperature in the last two hundred years. Interesting. Do you now surrender the point that climate has been warming (and definitely not cooling)?
And here's the same response I rebut that old image with.
Maybe inaccurate (no better than half a degree Celsius in accuracy per Dr. Roy Spencer) and unreliable (orbital decay screwing with records) satellites just ain't measuring temperatures that can be directly measured on the surface instead of inferred from microwave signals?
a reply to: ElectricUniverse
Oh, wait, haha, wait a second. I can't believe I never noticed that before.
That chart says MID-TROPOSPHERIC TEMPERATURE.
Do you know what altitude the mid troposphere is at?
Oh, wait, haha, wait a second. I can't believe I never noticed that before.
That chart says MID-TROPOSPHERIC TEMPERATURE.
Do you know what altitude the mid troposphere is at?
edit on 19Tue, 10 May 2016 19:34:58 -0500America/ChicagovAmerica/Chicago5 by Greven
because: (no reason given)
I know you skeptics love Dr. Roy Spencer when it suits you, but maybe you should listen to him more?
Here's this guy you listen to about other things saying the greenhouse effect exists - with FLIR images of it.
Seriously, give it a rest. None of us would be alive if the greenhouse effect didn't exist. The Earth would be just another cold body in space.
We can literally look up into the sky with technology developed today to see the greenhouse effect in action. It's there, it factors into weather forecasts, and prominent people that skeptics cite acknowledge that it exists.
Please stop twisting others with your inane and almost religious fervor that science is not real (in this category anyway - or maybe vaccinations too, guess it depends on the person) and that reality is what you imagine it to be (it ain't).
Can we please, pretty please, cease such insanity?
The motto of ATS is "deny ignorance." - STOP BEING IGNORANT
a reply to: intergalactic fire
I said it lags by 800 years - you replied that it lagged by 800 years because of the ocean.
I question why temperature did not rise for almost 30 years during 145-1979, you reply that it lags. So which is it. Since 1979 to 2016, it apparently did not lag. What happened the oceans dry up and blow away? Why only a 30 year lag instead of 800 years?
Are you even making sense now?
Tired of Control Freaks
a reply to: mc_squared
Can't argue with his last sentiments. Humanity totally deserves to get wiped off the planet, especially the willfully ignorant retards. Too bad that the rest of the planet might go with us.
Can't argue with his last sentiments. Humanity totally deserves to get wiped off the planet, especially the willfully ignorant retards. Too bad that the rest of the planet might go with us.
originally posted by: Greven
You've gotta be screwing with me... right? You aren't really so misinformed as to believe that stuff... please give me hope for humanity...
Naa, at least he is not making claims such as "the lifetime of CO2 in the atmosphere is in the hundreds to thousands of years" as you have made in the past. Dr. Latour is explaining it within the context of electrical and chemical engineering.
originally posted by: Greven
This is not a scientific website - it is a private company masquerading as such. I'm not even joking here. Hell, read this one - a response to criticism by Dr. Roy Spencer of this company.
heh... They seem to have differences in opinions. In case you didn't know scientists do not agree on everything... That does not disprove anything at all...
originally posted by: Greven
How about this, you back up their claims, like this:
Man-made global warming promoters claim the high correlation between carbon dioxide (CO2) and atmospheric temperature (T) in the 420,000 year ice core record proves CO2 causes T to change
WHO claims that? It's long been a (valid) critique by climate skeptics that CO2 in ice cores are not well correlated with time. This is a strawman.
LOL...really, now you are going to sit there and claim that the AGW(Anthropogenic Global Warming) crowd hasn't used ice core data/graphs that show temperature and CO2 increasing almost parallel and then claimed that it is CO2 causing temperature to increase?...
OH boy... I'll give you a hint... "Al Gore's inconvenient truth"... Among other lies being disseminated by the AGW crowd...
originally posted by: Greven
The lag model for CO2 following temperature is an electrical circuit. Uh...huh...
Again, he is explaining it within the context of electrical and chemical engineering... Yes, processes that occur on Earth can be explained in this manner...
originally posted by: Greven
Gotta watch out for them there big oceans. Thin ones are okay though. How can you possibly take it seriously?
Perhaps it wasn't the best way he could explain it, but guess what? Larger ocean masses do have a larger lag because they have a bigger volume, which needs more energy, and more time to be affected than smaller ocean masses...
originally posted by: Greven
Further, half of the text in that 'document' is laughable. Wikipedia citations. Random stuff like this:
First, correlation alone only proves correlation, not cause and effect. Physics is required to describe and prove cause and effect.
The mind boggles.
Do you do ANY research into sources before posting them? Do you even read this stuff before posting it as evidence to back your claims?!?
Which is true...correlation doesn't always prove causation, and in the case of CO2 and temperature, the correlation has been falsely changed by the AGW crowd. It isn't temperature that leads in most past climate changes, even in the current one it was temperature changes that lead before CO2 levels began to increase...
originally posted by: Greven
These people are nuts or paid shills. Please do better.
Riiight... Or, you simply have no idea what in the world you are talking about, which is why you have made false claims in the past such as that claim that "the lifetime of atmospheric CO2 is in the hundreds to thousands of years"...
edit on 10-5-2016 by ElectricUniverse because: correct comment.
originally posted by: Greven
a reply to: ElectricUniverse
Oh, wait, haha, wait a second. I can't believe I never noticed that before.
That chart says MID-TROPOSPHERIC TEMPERATURE.
Do you know what altitude the mid troposphere is at?
Please, go ahead, try to enlighten us as to what exactly you are trying to claim now...
I have been reading this thread, and does anyone see the irony in it?
We are arguing exactly the way politicians and big business argue about this subject.
Meanwhile the CO2 just keeps building.
Nothing resolved. But we sure know how to belittle each other's opinions on the subject.
We are arguing exactly the way politicians and big business argue about this subject.
Meanwhile the CO2 just keeps building.
Nothing resolved. But we sure know how to belittle each other's opinions on the subject.
originally posted by: Greven
Interesting, but you are now citing evidence that it has markedly increased in temperature in the last two hundred years. Interesting. Do you now surrender the point that climate has been warming (and definitely not cooling)?
...
You joined the website in 2014. Do you have any idea how long I have been posting about climate change? In fact, when it all started to be more, and more of a topic in the forums even I believed that it was possible that mankind was accelerating climate change, but instead of just believing what I was told I actually informed myself, read scientific articles, and read the evidence provided by both sides. Then I realized we were being lied to.
The Earth is going through some radical changes, but neither anthropogenic CO2, nor CO2 in general are the cause. The Earth's magnetic field has been weakening since at least the 1840s, by weakening more energy is entering the Earth which affects the dynamics of Earth.
Earth's Magnetic Field Is Fading
John Roach
for National Geographic News
September 9, 2004
Earth's magnetic field is fading. Today it is about 10 percent weaker than it was when German mathematician Carl Friedrich Gauss started keeping tabs on it in 1845, scientists say.
If the trend continues, the field may collapse altogether and then reverse. Compasses would point south instead of north.
...
news.nationalgeographic.com...
In 2014 the weakening of Earth's magnetic field increased exponentially.
Earth's Magnetic Field Is Weakening 10 Times Faster Now
By Kelly Dickerson, Staff Writer | July 8, 2014 11:29am ET
Earth's magnetic field, which protects the planet from huge blasts of deadly solar radiation, has been weakening over the past six months, according to data collected by a European Space Agency (ESA) satellite array called Swarm.
The biggest weak spots in the magnetic field — which extends 370,000 miles (600,000 kilometers) above the planet's surface — have sprung up over the Western Hemisphere, while the field has strengthened over areas like the southern Indian Ocean, according to the magnetometers onboard the Swarm satellites — three separate satellites floating in tandem.
The scientists who conducted the study are still unsure why the magnetic field is weakening, but one likely reason is that Earth's magnetic poles are getting ready to flip, said Rune Floberghagen, the ESA's Swarm mission manager. In fact, the data suggest magnetic north is moving toward Siberia.
...
Scientists already know that magnetic north shifts. Once every few hundred thousand years the magnetic poles flip so that a compass would point south instead of north. While changes in magnetic field strength are part of this normal flipping cycle, data from Swarm have shown the field is starting to weaken faster than in the past. Previously, researchers estimated the field was weakening about 5 percent per century, but the new data revealed the field is actually weakening at 5 percent per decade, or 10 times faster than thought. As such, rather than the full flip occurring in about 2,000 years, as was predicted, the new data suggest it could happen sooner.
www.livescience.com...
Then there is the fact that Earthquakes have been increasing worldwide.
...
The average rate of big earthquakes — those larger than magnitude 7 — has been 10 per year since 1979, the study reports. That rate rose to 12.5 per year starting in 1992, and then jumped to 16.7 per year starting in 2010 — a 65 percent increase compared to the rate since 1979. This increase accelerated in the first three months of 2014 to more than double the average since 1979, the researchers report.
...
www.livescience.com...
...
1. Introduction
Obvious increases in the global rate of large (M ≥ 7.0) earthquakes happened after 1992, 2010, and especially during the first quarter of 2014 (Table 1 and Figure 1). Given these high rates, along with suggestions that damaging earthquakes may be causatively linked at global distance [e.g., Gomberg and Bodin, 1994; Pollitz et al., 1998; Tzanis and Makropoulos, 2002; Bufe and Perkins, 2005; Gonzalez-Huizar et al., 2012; Pollitz et al., 2012, 2014], we investigate whether there is a significant departure from a random process underlying these rate changes. Recent studies have demonstrated that M ≥ 7.0 earthquakes (and also tsunamis) that occurred since 1900 follow a Poisson process [e.g., Michael, 2011; Geist and Parsons, 2011; Daub et al., 2012; Shearer and Stark, 2012; Parsons and Geist, 2012; Ben-Naim et al., 2013]. Here we focus on the period since 2010, which has M ≥ 7.0 rates increased by 65% and M ≥ 5.0 rates up 32% compared with the 1979 – present average. The first quarter of 2014 experienced more than double the average M ≥ 7.0 rate, enough to intrigue the news media [e.g., www.nbcnews.com...]. We extend our analysis to M ≥ 5.0 levels, as many of these lower magnitude events convey significant hazard, and global catalogs have not generally been tested down to these thresholds.
2. Methods and Data
We work with the Advanced National Seismic System (ANSS) catalog of M≥ 5.0 global earthquakes for the period between 1979 and 2014.3 with a primary focus on the recent interval between 2010 and 2014.3 that shows the highest earthquake rates (Table 1 and Figure 1). A variety of tests suggest that the catalog is complete down to magnitudes between M=4.6 and M=5.2, depending on the method used to assess it (see supporting information). We examine a range of lower magnitude thresholds above M =5.0 to account for this uncertainty.
...
profile.usgs.gov...
Then there is also the fact that we found out that magmatic/volcanic activity has been increasing, and more so under our oceans, and we found volcanoes have been melting ice sheets in the Antarctic.
Underwater volcanoes, not climate change, reason behind melting of West Antarctic Ice Sheet
10 June 2014, 10:43 pm EDT By James Maynard Tech Times
Melting of a major glacier system in western Antarctica may be caused by underwater volcanoes, and not by global climate change, according to new research.
Thwaites Glacier, a massive outlet for ice that empties into Pine Island Bay, is flowing at a rate of one-and-a-quarter miles per year. The bay opens up into the Amundsen Sea.
The Thwaites Glacier has been the subject of scrutiny by climatologists in the last few years, as new information about the severity of the melting becomes available. Traditional models had assumed heating from subterranean sources was fairly even around the region. New data provides details about areas where little was previously known.
University of Texas researchers studied how water moves underground in the region. They found liquid water was present in a greater number of sources than previously believed, and it is warmer than estimated in previous studies.
...
www.techtimes.com...
edit on 11-5-2016 by ElectricUniverse because: correct comment.
On land there are 150 volcanoes, under our oceans it is estimated that there are over 3 million volcanoes.
www.newscientist.com...
Second, underwater volcanos in average are much bigger than their land cousins.
For example, the largest volcano found recently is underwater.
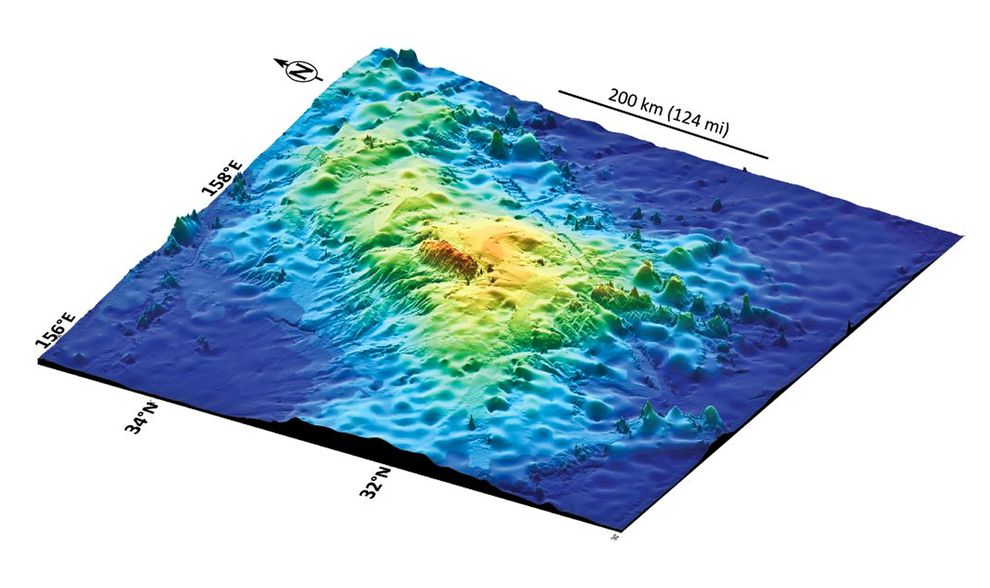
Doesn't look big right?...
news.nationalgeographic.com...
Daily news
9 July 2007
Thousand of new volcanoes revealed beneath the waves
By Catherine Brahic
The true extent to which the ocean bed is dotted with volcanoes has been revealed by researchers who have counted 201,055 underwater cones. This is over 10 times more than have been found before.
The team estimates that in total there could be about 3 million submarine volcanoes, 39,000 of which rise more than 1000 metres over the sea bed.
“The distribution of underwater volcanoes tells us something about what is happening in the centre of the Earth,” says John Hillier of the University of Cambridge in the UK. That is because they give information about the flows of hot rock in the mantle beneath. “But the problem is that we cannot see through the water to count them,” he says.
Satellites can detect volcanoes that are more than 1500 m high because the mass of the submerged mountains causes gravity to pull the water in around them. This creates domes on the ocean’s surface that can be several metres high and can be detected from space.
...
www.newscientist.com...
Second, underwater volcanos in average are much bigger than their land cousins.
For example, the largest volcano found recently is underwater.
Doesn't look big right?...
By Brian Clark Howard
National Geographic
Published September 5, 2013
A volcano the size of New Mexico or the British Isles has been identified under the Pacific Ocean, about 1,000 miles (1,600 kilometers) east of Japan, making it the biggest volcano on Earth and one of the biggest in the solar system.
Called Tamu Massif, the giant shield volcano had been thought to be a composite of smaller structures, but now scientists say they must rethink long-held beliefs about marine geology.
“This finding goes against what we thought, because we found that it’s one huge volcano,” said William Sager, a geology professor at the University of Houston in Texas. Sager is lead author in a study about the find that was published this week in the peer-reviewed journal Nature Geoscience.
“It is in the same league as Olympus Mons on Mars, which had been considered to be the largest volcano in the solar system,” Sager told National Geographic.
Tamu Massif is a rounded dome that measures about 280 by 400 miles (450 by 650 kilometers), or more than 100,000 square miles. Its top lies about 6,500 feet (about 2,000 meters) below the ocean surface, while the base extends down to about 4 miles (6.4 kilometers) deep. Tamu Massif dwarfs the largest active volcano on Earth, Mauna Loa in Hawaii, which measures about 2,000 square miles (5,200 square kilometers).
...
news.nationalgeographic.com...
edit on 11-5-2016 by ElectricUniverse because: add link and correct comment.
edit on 11-5-2016 by ElectricUniverse because:
correct comment.
Climate Change, and the other extreme changes the Earth is going through will continue occurring, but mankin is the not the cause of these changes.
a reply to: ElectricUniverse

Please define exponentially. You know that the Earth's magnetic field is stronger than has it has been in the past 50,000 years?
In 2014 the weakening of Earth's magnetic field increased exponentially.
www.researchgate.net... ities_from_Galapagos_lavas
Last, although the geomagnetic field intensity is known to be dropping at a rapid rate of ∼10% for nearly the past two centuries (25) with suggestions that a collapse of the field and a magnetic polarity reversal may be on the horizon (26), the present-day geomagnetic field may simply be decreasing from an anomalously high historical value compared with the average paleointensity over the past few million years.
That is called cherry picking data. Selecting a single four year period. But did you read your source?
Then there is the fact that Earthquakes have been increasing worldwide.
profile.usgs.gov...
A strong increase in the number of global earthquakes is noted since 2010 that appears to have accelerated during the first quarter of 2014. However, there is no evidence that this increase represents a departure from temporally independent earthquake occurrence, as many of these earthquakes are local aftershocks of prior events.
Your link does not say that "magmatic/volcanic activity" has been increasing.
Then there is also the fact that we found out that magmatic/volcanic activity has been increasing, and more so under our oceans, and we found volcanoes have been melting ice sheets in the Antarctic.
Right, mankind is not the cause of the declining magnetic field or the non increase in volcanic and earthquake activity. But we are probably the primary cause for the current warming trend (and the resulting change in climates).
Climate Change, and the other extreme changes the Earth is going through will continue occurring, but mankin is the not the cause of these changes.
edit on 5/11/2016 by Phage because: (no reason given)
originally posted by: Phage
Please define exponentially. You know that the Earth's magnetic field is stronger than has it has been in the past 50,000 years?
As in the weakening in the 90s was 10%, and at around 2014 the weakening became 10 times more pronounce than it was in the 90s.
It's right there in the links Phage.
originally posted by: Phage
That is called cherry picking data. Selecting a single four year period. But did you read your source?
...
Cherry picking?... Really Phage?... So you didn't cherry pick when you seem to claim that this increase in earthquakes worldwide you are claiming has only been happening for 4 years when the research shows how earthquakes have been increasing worldwide starting in the 1990s, and has been exponentially increasing?...
You don't know what an exponential increase means Phage? Need help with that?
ex·po·nen·tial
ˌekspəˈnen(t)SH(ə)l/
adjectiveMathematics
adjective: exponential
of or expressed by a mathematical exponent.
"an exponential curve"
(of an increase) becoming more and more rapid.
www.google.com...=define+exponential
originally posted by: Phage
Your link does not say that "magmatic/volcanic activity" has been increasing.
An increase in worldwide earthquakes, and dramatic changes occurring to Earth's magnetic field point to the fact that Earth's core is changing dramatically. Such increases in earthquakes worldwide would also point to an increase in volcanic activity.
originally posted by: Phage
Right, mankind is not the cause of the declining magnetic field or the non increase in volcanic and earthquake activity. But we are probably the primary cause for the current warming trend (and the resulting change in climates).
In the 1970s scientists from France were already predicting that there could probably be dramatic changes to Earth's climate because the solar system has been moving towards a new region of the interstellar cloud. Back then, it was thought that these changes could happen anywhere within 10,000-50,000 years.
Not that long ago scientists stated that within the next 100 years Earth will be within this new region of the interstellar cloud.
Ribbon at Edge of Our Solar System: Will the Sun Enter a Million-Degree Cloud of Interstellar Gas?
ScienceDaily (May 24, 2010) — Is the Sun going to enter a million-degree galactic cloud of interstellar gas soon?
Scientists from the Space Research Centre of the Polish Academy of Sciences, Los Alamos National Laboratory, Southwest Research Institute, and Boston University suggest that the ribbon of enhanced emissions of energetic neutral atoms, discovered last year by the NASA Small Explorer satellite IBEX, could be explained by a geometric effect coming up because of the approach of the Sun to the boundary between the Local Cloud of interstellar gas and another cloud of a very hot gas called the Local Bubble. If this hypothesis is correct, IBEX is catching matter from a hot neighboring interstellar cloud, which the Sun might enter in a hundred years.
...
www.sciencedaily.com...
Title:
Is the solar system entering a nearby interstellar cloud
Authors:
Vidal-Madjar, A.; Laurent, C.; Bruston, P.; Audouze, J.
Affiliation:
AA(CNRS, Laboratoire de Physique Stellaire et Planetaire, Verrieres-le-Buisson, Essonne, France), AB(CNRS, Laboratoire de Physique Stellaire et Planetaire, Verrieres-le-Buisson, Essonne, France), AC(CNRS, Laboratoire de Physique Stellaire et Planetaire, Verrieres-le-Buisson, Essonne, France), AD(Meudon Observatoire, Hauts-de-Seine; Paris XI, Universite, Orsay, Essonne, France)
Publication:
Astrophysical Journal, Part 1, vol. 223, July 15, 1978, p. 589-600. (ApJ Homepage)
Publication Date:
07/1978
Category:
Astrophysics
Origin:
STI
NASA/STI Keywords:
ASTRONOMICAL MODELS, DEUTERIUM, HYDROGEN ATOMS, INTERSTELLAR GAS, SOLAR SYSTEM, ABUNDANCE, EARLY STARS, GAS DENSITY, INTERSTELLAR EXTINCTION
DOI:
10.1086/156294
Bibliographic Code:
1978ApJ...223..589V
Abstract
...
Observational arguments in favor of such a cloud are presented, and implications of the presence of a nearby cloud are discussed, including possible changes in terrestrial climate. It is suggested that the postulated interstellar cloud should encounter the solar system at some unspecified time in the 'near' future and might have a drastic influence on terrestrial climate in the next 10,000 years.
adsabs.harvard.edu...
In the past I have shown evidence that our Solar System has been encountering regions of this cloud. Small regions of this cloud that would affect the dynamics within the Solar System and would affect planets like Earth.
ESA sees stardust storms heading for Solar System
PRESS RELEASE
Date Released: Monday, August 18, 2003
Source: Artemis Society
Until ten years ago, most astronomers did not believe stardust could enter our Solar System. Then ESA's Ulysses spaceprobe discovered minute stardust particles leaking through the Sun's magnetic shield, into the realm of Earth and the other planets. Now, the same spaceprobe has shown that a flood of dusty particles is heading our way.
...
What is surprising in this new Ulysses discovery is that the amount of stardust has continued to increase even after the solar activity calmed down and the magnetic field resumed its ordered shape in 2001.
Scientists believe that this is due to the way in which the polarity changed during solar maximum. Instead of reversing completely, flipping north to south, the Sun's magnetic poles have only rotated at halfway and are now more or less lying sideways along the Sun's equator. This weaker configuration of the magnetic shield is letting in two to three times more stardust than at the end of the 1990s. Moreover, this influx could increase by as much as ten times until the end of the current solar cycle in 2012.
www.spaceref.com...
Ulysses sees Galactic Dust on the rise
01 Aug 2003
Since early 1992 Ulysses has been monitoring the stream of stardust flowing through our Solar System. The stardust is embedded in the local galactic cloud through which the Sun is moving at a speed of 26 kilometres every second. As a result of this relative motion, a single dust grain takes twenty years to traverse the Solar System. Observations by the DUST experiment on board Ulysses have shown that the stream of stardust is highly affected by the Sun's magnetic field.
...
Unlike Earth, however, the Sun reverses its magnetic polarity every 11 years. The reversal always occurs during solar maximum. That's when the magnetic field is highly disordered, allowing more interstellar dust to enter the Solar System. It is interesting to note that in the reversed configuration after the recent solar maximum (North negative, South positive), the interstellar dust is even channelled more efficiently towards the inner Solar System. So we can expect even more interstellar dust from 2005 onwards, once the changes become fully effective.
sci.esa.int...
edit on 11-5-2016 by ElectricUniverse because: correct comment.
edit on 11-5-2016 by ElectricUniverse because: add
link.
a reply to: ElectricUniverse
Please demonstrate an exponential increase in earthquake activity since the 1990s. Not that it would seem to have much to do with warming though.
Yes, the Ulysses mission was very informative. But you know that the reversal being talked in that article about is a cycle, right? 11 years, right?
The article says that more interstellar material was entering the Solar System back then. I though that was supposed to mean more clouds and thus a cooling effect on Earth. Is that what we've been seeing?
The article you linked said 4 years. It also said there was nothing unusual about it.
So you didn't cherry pick when you seem to claim that this increase in earthquakes worldwide you are claiming has only been happening for 4 years when the research shows how earthquakes have been increasing worldwide starting in the 1990s, and has been exponentially increasing?...
Please demonstrate an exponential increase in earthquake activity since the 1990s. Not that it would seem to have much to do with warming though.
I know what exponential means. I was wondering how you could claim an exponential increase based on 2 data points. Exponential, as your definition points out means "more and more rapid." Two data points tells you there was an increase. Got a third data point? That would help.
You don't know what an exponential increase means Phage? Need help with that?
So, what does that have to do with now?
Not that long ago scientists stated that within the next 100 years Earth will be within this new region of the interstellar cloud.
Yes, the Ulysses mission was very informative. But you know that the reversal being talked in that article about is a cycle, right? 11 years, right?
The article says that more interstellar material was entering the Solar System back then. I though that was supposed to mean more clouds and thus a cooling effect on Earth. Is that what we've been seeing?
edit on 5/11/2016 by Phage because: (no reason given)
a reply to: Phage
Already posted those links Phage. Read the information provided, which you have read before btw.
www.livescience.com...
profile.usgs.gov...
Already posted those links Phage. Read the information provided, which you have read before btw.
...
The average rate of big earthquakes — those larger than magnitude 7 — has been 10 per year since 1979, the study reports. That rate rose to 12.5 per year starting in 1992, and then jumped to 16.7 per year starting in 2010 — a 65 percent increase compared to the rate since 1979. This increase accelerated in the first three months of 2014 to more than double the average since 1979, the researchers report.
...
www.livescience.com...
...
1. Introduction
Obvious increases in the global rate of large (M ≥ 7.0) earthquakes happened after 1992, 2010, and especially during the first quarter of 2014 (Table 1 and Figure 1). Given these high rates, along with suggestions that damaging earthquakes may be causatively linked at global distance [e.g., Gomberg and Bodin, 1994; Pollitz et al., 1998; Tzanis and Makropoulos, 2002; Bufe and Perkins, 2005; Gonzalez-Huizar et al., 2012; Pollitz et al., 2012, 2014], we investigate whether there is a significant departure from a random process underlying these rate changes. Recent studies have demonstrated that M ≥ 7.0 earthquakes (and also tsunamis) that occurred since 1900 follow a Poisson process [e.g., Michael, 2011; Geist and Parsons, 2011; Daub et al., 2012; Shearer and Stark, 2012; Parsons and Geist, 2012; Ben-Naim et al., 2013]. Here we focus on the period since 2010, which has M ≥ 7.0 rates increased by 65% and M ≥ 5.0 rates up 32% compared with the 1979 – present average. The first quarter of 2014 experienced more than double the average M ≥ 7.0 rate, enough to intrigue the news media [e.g., www.nbcnews.com...]. We extend our analysis to M ≥ 5.0 levels, as many of these lower magnitude events convey significant hazard, and global catalogs have not generally been tested down to these thresholds.
2. Methods and Data
We work with the Advanced National Seismic System (ANSS) catalog of M≥ 5.0 global earthquakes for the period between 1979 and 2014.3 with a primary focus on the recent interval between 2010 and 2014.3 that shows the highest earthquake rates (Table 1 and Figure 1). A variety of tests suggest that the catalog is complete down to magnitudes between M=4.6 and M=5.2, depending on the method used to assess it (see supporting information). We examine a range of lower magnitude thresholds above M =5.0 to account for this uncertainty.
...
profile.usgs.gov...
edit on 11-5-2016 by ElectricUniverse because: correct
comment.
a reply to: ElectricUniverse
Yes, I did.
Would you like me to post this again:
Did you notice that the study used only the ANSS catalog? There is a more comprehensive catalog, called the Centential which covers the period through from 1900 to 2008. I've extended that, using the ANSS catalog. I think I've showed you the output before. This is through 2014.
earthquake.usgs.gov...
I don't see an exponential increase in earthquakes. Do you? Can you provide that data?
Nor, btw, do I see what it has to do with global warming.
Already posted those links Phage. Read the information provided, which you have read before btw.
Yes, I did.
Would you like me to post this again:
A strong increase in the number of global earthquakes is noted since 2010 that appears to have accelerated during the first quarter of 2014. However, there is no evidence that this increase represents a departure from temporally independent earthquake occurrence, as many of these earthquakes are local aftershocks of prior events.
Did you notice that the study used only the ANSS catalog? There is a more comprehensive catalog, called the Centential which covers the period through from 1900 to 2008. I've extended that, using the ANSS catalog. I think I've showed you the output before. This is through 2014.
earthquake.usgs.gov...
I don't see an exponential increase in earthquakes. Do you? Can you provide that data?
Nor, btw, do I see what it has to do with global warming.
edit on 5/11/2016 by Phage because: (no reason given)
originally posted by: Phage
...
The article says that more interstellar material was entering the Solar System back then. I though that was supposed to mean more clouds and thus a cooling effect on Earth. Is that what we've been seeing?
We have been seen dramatic changes happening to our Sun.
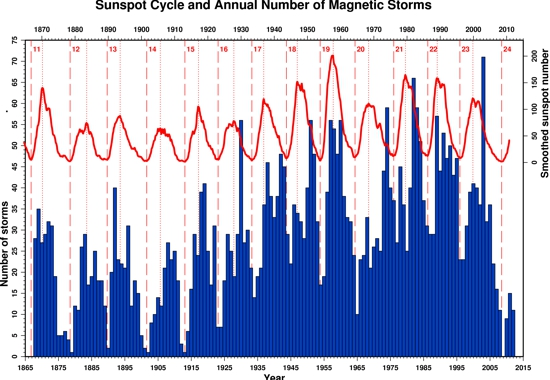
Because of the difference in units of presentation, the values of AA* and Ap* are not the same so that different major magnetic storm onset and end threshold values are used for the two series. However their comparison for the years of overlapping coverage show that relative frequency of occurrence of major storms per year are similar. Another reason for differences is that an index derived from magnetic perturbation values at only two observatories easily experiences larger extreme values if either input site is well situated to the overhead ionospheric and.or field aligned current systems producing the magnetic storm effects. Although not documented here, it is interesting to note that the overall level of magnetic disturbance from year to year has increased substantially from a low around 1900 Also, the level of mean yearly aa is now much higher so that a year of minimum magnetic disturbances now is typically more disturbed than years at maximum disturbance levels before 1900.
www.ngdc.noaa.gov...
BTW, yes the AA index is taken from two observatories. You have tried to use this as a claim that this disproves the Sun's activity is changing, when it only proves that the changes occurring to Earth are affecting some regions of Earth more than others. In case you didn't figure it out, the Earth has been warming more in some regions than on others.
The regions warming are also far away from big cities which are the origin of anthropogenic CO2.
a reply to: Phage
The two researchers, that work for the USGS, provide that information... Yet again you keep on trying to do nothing but derail evidence that you disagree with.
profile.usgs.gov...
The increase in global earthquakes, the changes happening to Earth's magnetic shield all point to dramatic changes Earth is undergoing, and those changes can, and do affect climate change...
The two researchers, that work for the USGS, provide that information... Yet again you keep on trying to do nothing but derail evidence that you disagree with.
The 2010–2014.3 global earthquake rate increase
Tom Parsons 1 and Eric L. Geist 1
1
U. S. Geological Survey, Menlo Park, California, USA
...
profile.usgs.gov...
The increase in global earthquakes, the changes happening to Earth's magnetic shield all point to dramatic changes Earth is undergoing, and those changes can, and do affect climate change...
edit on 11-5-2016 by ElectricUniverse because: add and correct comment.
new topics
-
A man of the people
Diseases and Pandemics: 44 minutes ago -
Ramblings on DNA, blood, and Spirit.
Philosophy and Metaphysics: 1 hours ago -
4 plans of US elites to defeat Russia
New World Order: 2 hours ago -
Thousands Of Young Ukrainian Men Trying To Flee The Country To Avoid Conscription And The War
Other Current Events: 6 hours ago -
12 jurors selected in Trump criminal trial
US Political Madness: 8 hours ago -
Iran launches Retalliation Strike 4.18.24
World War Three: 8 hours ago -
Israeli Missile Strikes in Iran, Explosions in Syria + Iraq
World War Three: 9 hours ago
top topics
-
George Knapp AMA on DI
Area 51 and other Facilities: 15 hours ago, 25 flags -
Israeli Missile Strikes in Iran, Explosions in Syria + Iraq
World War Three: 9 hours ago, 16 flags -
Louisiana Lawmakers Seek to Limit Public Access to Government Records
Political Issues: 17 hours ago, 7 flags -
Iran launches Retalliation Strike 4.18.24
World War Three: 8 hours ago, 6 flags -
Not Aliens but a Nazi Occult Inspired and then Science Rendered Design.
Aliens and UFOs: 15 hours ago, 5 flags -
Thousands Of Young Ukrainian Men Trying To Flee The Country To Avoid Conscription And The War
Other Current Events: 6 hours ago, 4 flags -
12 jurors selected in Trump criminal trial
US Political Madness: 8 hours ago, 4 flags -
4 plans of US elites to defeat Russia
New World Order: 2 hours ago, 2 flags -
Ramblings on DNA, blood, and Spirit.
Philosophy and Metaphysics: 1 hours ago, 1 flags -
A man of the people
Diseases and Pandemics: 44 minutes ago, 0 flags
active topics
-
Mood Music Part VI
Music • 3059 • : TheWoker -
4 plans of US elites to defeat Russia
New World Order • 10 • : andy06shake -
Elites disapearing
Political Conspiracies • 32 • : SchrodingersRat -
A man of the people
Diseases and Pandemics • 1 • : chr0naut -
Thousands Of Young Ukrainian Men Trying To Flee The Country To Avoid Conscription And The War
Other Current Events • 3 • : Consvoli -
British TV Presenter Refuses To Use Guest's Preferred Pronouns
Education and Media • 67 • : Consvoli -
The Fight for Election Integrity Continues -- Audits, Criminal Investigations, Legislative Reform
2024 Elections • 4138 • : IndieA -
Fossils in Greece Suggest Human Ancestors Evolved in Europe, Not Africa
Origins and Creationism • 63 • : Consvoli -
Mandela Effect - It Happened to Me!
The Gray Area • 112 • : CCoburn -
So I saw about 30 UFOs in formation last night.
Aliens and UFOs • 31 • : Encia22