It looks like you're using an Ad Blocker.
Please white-list or disable AboveTopSecret.com in your ad-blocking tool.
Thank you.
Some features of ATS will be disabled while you continue to use an ad-blocker.

Manmade Climate Change: The pollution of science by politics and the road to world government
page: 5share:
originally posted by: Krazysh0t
originally posted by: theboarman
a reply to: Krazysh0t
nice diversion tactic, show me where i compared humans to dinosaurs? i simply said the earth had 5 times more co2 then today and it didnt get to hot for the dinosaurs , if your science on co2 was true they would have died out from heatstroke or they wouldnt exist at all.
why dont you try and disprove the op with all that science you talked about you had in that other thread?
Why should I bother? You clearly don't know how evolution works if you think you can make the statement you made earlier.
Dinosaurs evolved to be able to live in higher concentrations of CO2 and humans evolved to live in lower concentrations so concentrations that help dinosaurs thrive cannot be used to say that humans would be fine too.
Why bother when you can't prove a thing? I agree with you this time, why bother is because you haven't got the proof so it is better to strawman. I used to think you could think clearly.
originally posted by: Phage
a reply to: theboarman
im sure it couldnt have been to hot because they were some of the biggest things on this planet
How "hot" it was then is not really the issue.
The issue is how an increasing global temperature average will affect climates, and thereby human civilization.
The more important question hanging like a chad is, what is the Earths ideal temperature Phage?
a reply to: halfmask
The problem with this Professor's lecture is it has been established that Science doesn't have all the dynamics that takes place on Earth that would affect the natural march to equilibrium that all systems do. This is not being taking into account as it doesn't fit the narrative. Of course I base my statement on what I was taught in my Physical Chemistry class that I did take at a graduate level many years ago when the truth in Science appeared more important to Professors of most all areas of study than it appears to be today.
The problem with this Professor's lecture is it has been established that Science doesn't have all the dynamics that takes place on Earth that would affect the natural march to equilibrium that all systems do. This is not being taking into account as it doesn't fit the narrative. Of course I base my statement on what I was taught in my Physical Chemistry class that I did take at a graduate level many years ago when the truth in Science appeared more important to Professors of most all areas of study than it appears to be today.
edit on 27-2-2016 by Justoneman because: (no reason
given)
originally posted by: network dude
a reply to: snchrnct
one of the hardest things to grasp about this whole debacle is that we are chastised for using fossil fuels, yet have no alternative method to fall back on. Yes, I get that somewhere, electric cars exist, and solar panels have been installed, but to date, we still have coal fired power plants, gasoline powered cars, buses, trucks and motorcycles. So until I see an alternative THAT WORKS AND IS COST EFFECTIVE, I think we will continue to go in the same direction. No matter how much we snuggle up to Al Gore.
And as far as the cost effective comment goes, I am all for hydrogen for fuel. It's a wonderful alternative. The only problem with it, is they use the same or more "fossil fuel" to make hydrogen as it would take to just drive in a gas car. So the environmental impact is the same, with just more cost. Fix that, and we may have a solution to the polar bears loosing all their homes.
Yes, that's the whole ball of wax.
What to replace fossil fuel with.
They don't like nuke power, solar is not cost effective and not close to being powerful enough to run a city.
Plus people are using fossil fuel to charge batteries in cars.
besides, there are a million other products that use it. Like plastic.
I'm not a believer in AGW at all. Pollution is a local problem.
I was just in the Philippines and i couldn't believe the night sky.
Haven't seen so many stars since i lived in the Rockies.
Human civilization runs on energy, more and more as populations get larger and it's big money.
Electric cars have a flaw and it's the battery.
A pretty dirty piece of hardware from start to finish.
So until someone comes up with 1000 horsepower in a matchbox, we are stuck.
S&F OP.
edit on 2 27 2016 by burgerbuddy because: kudos to the op
a reply to: snchrnct
In your first post, OP, you have basically no facts supporting your position.
Your single point is saying CO2 is plant food, linking to Wikipedia, and saying it's necessary for life. Sorry, it isn't the only thing necessary for plants. They need minerals and nutrients as well.
a reply to: snchrnct
In your second post, OP, is full of disinformation and lies. Your first attempt is to attack the messenger. This does not attack global warming, but you aim to cast doubt upon it via such an attack. For fun, let's look at what you get wrong.
Your first target is popular punching bag Al Gore, and you aim to paint him a hypocrite.
You claim there are errors in his film. I haven't seen it, so I can't say more than you are cherry picking your source:
Al Gore's house seems located at 1504 East Mountain Drive, Montecito CA which, while close to the coast (~1 3/4 miles away), is around 500 feet above sea level.
Your second target is the IPCC. Let's look at that WUWT chart of 'unreliable' models with ground-based thermometers:
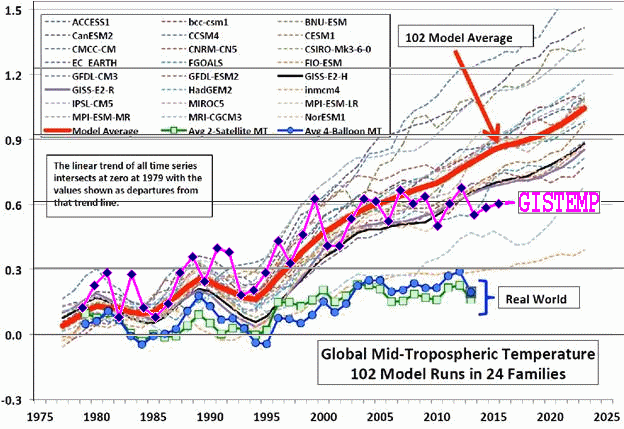
Or see the missing satellite spike in 1998 (per Phage)
Your 400% link doesn't appear to work. Your next target is Phil Jones, who admittedly mishandled requests. However, subsequent inquiry cleared the researchers of wrongdoing. A number of other inquiries also cleared them of wrongdoing, save for their mishandling of FOIA requests. You can easily look these up, if you care at all about facts.
If you want to talk about data tampering, maybe you should look at Dr. Roy Spencer's continually changing historical satellite temperatures (because they keep changing the algorithm). I guess if even Dr,. Spencer's satellite readings are in flux, then nobody can be trusted! No - readings are typically adjusted for good reason. Saying that this is tampering is both asinine and ignorant. These sources you link here are all useless.
The 55% (and glaciers in the Himalayas) claims were actual errors by the IPCC, and fairly quickly caught and addressed. Neither cast doubt on AWG, though. The MWP claim is funny, because if you go to the reference, you see the author with a graph showing that the MWP maxed out at about 0.4°C, when it's been warmer than that every year since 1997.
The only pause is that which appears only in certain data sets and ranges. We're already in an ice age, it's defined as a period where there are polar, continental, and alpine glaciers. What you're thinking is a glacial period, which is when ice sheets cover large chunks of the continents. Also, the prediction of such happening in the near future is wrong.
The Maunder Minimum is Dead. You are bizarrely mixing up two different things: glaciers and sea ice. Antarctic sea ice melts seasonally and maximum extent has been trending upwards. The NASA study is a bit contentious, given that it's the only one that alleges growth of continental ice. Oh, and that was rapidly declining up until when the study data ended in 2008. CO2 does not freeze on Earth naturally, so it can move a bit if trying to analyze ice cores - and historically (before records is pre-historically), temperature lags CO2.
a reply to: snchrnct
In your third post, OP, you have basically no facts supporting a critique on AGW. Your assault is on the alleged consensus. I frankly don't care either way.
a reply to: snchrnct
In your fourth post, OP, you have basically no facts supporting a critique of AGW. AGW is not a 'scare' but a fact. Maybe you should look at the fossil fuel industry instead of the 'green' industry: the fossil fuel industry enjoys subsidies of $10M/minute per the IMF, or $5.3T annually. AGW directly hurts their bottom line.
AGW is not a conspiracy. AGW is real and has been happening for a long time. Some of us are trying to keep it from destroying life as we know it. Others are sticking their heads in the sand... to cheers and adulation.
In your first post, OP, you have basically no facts supporting your position.
Your single point is saying CO2 is plant food, linking to Wikipedia, and saying it's necessary for life. Sorry, it isn't the only thing necessary for plants. They need minerals and nutrients as well.
a reply to: snchrnct
In your second post, OP, is full of disinformation and lies. Your first attempt is to attack the messenger. This does not attack global warming, but you aim to cast doubt upon it via such an attack. For fun, let's look at what you get wrong.
Your first target is popular punching bag Al Gore, and you aim to paint him a hypocrite.
You claim there are errors in his film. I haven't seen it, so I can't say more than you are cherry picking your source:
Mr Justice Barton yesterday said that while the film was "broadly accurate" in its presentation of climate change, he identified nine significant errors in the film, some of which, he said, had arisen in "the context of alarmism and exaggeration" to support the former US vice-president's views on climate change.
Al Gore's house seems located at 1504 East Mountain Drive, Montecito CA which, while close to the coast (~1 3/4 miles away), is around 500 feet above sea level.
Your second target is the IPCC. Let's look at that WUWT chart of 'unreliable' models with ground-based thermometers:
Or see the missing satellite spike in 1998 (per Phage)
originally posted by: Phage
Still a problem. What happened to the 1998 el nino event? It doesn't seem to have happened in the "real world" data shown in that graph.
Your 400% link doesn't appear to work. Your next target is Phil Jones, who admittedly mishandled requests. However, subsequent inquiry cleared the researchers of wrongdoing. A number of other inquiries also cleared them of wrongdoing, save for their mishandling of FOIA requests. You can easily look these up, if you care at all about facts.
If you want to talk about data tampering, maybe you should look at Dr. Roy Spencer's continually changing historical satellite temperatures (because they keep changing the algorithm). I guess if even Dr,. Spencer's satellite readings are in flux, then nobody can be trusted! No - readings are typically adjusted for good reason. Saying that this is tampering is both asinine and ignorant. These sources you link here are all useless.
The 55% (and glaciers in the Himalayas) claims were actual errors by the IPCC, and fairly quickly caught and addressed. Neither cast doubt on AWG, though. The MWP claim is funny, because if you go to the reference, you see the author with a graph showing that the MWP maxed out at about 0.4°C, when it's been warmer than that every year since 1997.
The only pause is that which appears only in certain data sets and ranges. We're already in an ice age, it's defined as a period where there are polar, continental, and alpine glaciers. What you're thinking is a glacial period, which is when ice sheets cover large chunks of the continents. Also, the prediction of such happening in the near future is wrong.
The Maunder Minimum is Dead. You are bizarrely mixing up two different things: glaciers and sea ice. Antarctic sea ice melts seasonally and maximum extent has been trending upwards. The NASA study is a bit contentious, given that it's the only one that alleges growth of continental ice. Oh, and that was rapidly declining up until when the study data ended in 2008. CO2 does not freeze on Earth naturally, so it can move a bit if trying to analyze ice cores - and historically (before records is pre-historically), temperature lags CO2.
a reply to: snchrnct
In your third post, OP, you have basically no facts supporting a critique on AGW. Your assault is on the alleged consensus. I frankly don't care either way.
a reply to: snchrnct
In your fourth post, OP, you have basically no facts supporting a critique of AGW. AGW is not a 'scare' but a fact. Maybe you should look at the fossil fuel industry instead of the 'green' industry: the fossil fuel industry enjoys subsidies of $10M/minute per the IMF, or $5.3T annually. AGW directly hurts their bottom line.
AGW is not a conspiracy. AGW is real and has been happening for a long time. Some of us are trying to keep it from destroying life as we know it. Others are sticking their heads in the sand... to cheers and adulation.
If you care at all about facts, they're most certainly out there. Try looking
for reality instead of looking for what you want to see.
a reply to: snchrnct
Very Good Thread here! Great Even!
This from You here, about AL AL, says a lot, and is VERY Telling in and of itself!!: "...he just bought a new $8 million oceanfront mansion." Along the WaterFront even?! WTF Man?!
Wow. Just WOW!!
Xallent job in putting this all together snchrnct!! Very well done! Very well done indeed!!
Syx...
ETA: Oh, to add. My Dad just the other day when We were talking about the skyrocketing rates of Cancer FINALLY said, "Yah there is definitely something odd going on there..."
BUT as far as Global warming, is still on the side of , "Well, We are the ones to blame for the sudden increase in that..."
It only took Me about a year of talking to Him about that to get Him to see the light...
Soon, probably pretty soon, He will see through the Smoke and Mirors on The Global Warming Farce too!
Syx...
edit on 27-2-2016 by SyxPak because: (no reason given)
originally posted by: Justoneman
originally posted by: Phage
a reply to: theboarman
im sure it couldnt have been to hot because they were some of the biggest things on this planet
How "hot" it was then is not really the issue.
The issue is how an increasing global temperature average will affect climates, and thereby human civilization.
The more important question hanging like a chad is, what is the Earths ideal temperature Phage?
Strawman? Or just a silly question?
That would depend on your point of view I suppose. From the point of view of human civilization, it is what it has been for the the past several years or so since those are the conditions under which that civilization developed and population greatly expanded. A change greater than 2º in the global average will have various effects which will impact that civilization. The faster the rate at which that change occurs, the less time there will be to mitigate the impacts.
edit on 2/27/2016 by Phage because: (no reason given)
originally posted by: Justoneman
a reply to: halfmask
The problem with this Professor's lecture is it has been established that Science doesn't have all the dynamics that takes place on Earth that would affect the natural march to equilibrium that all systems do. This is not being taking into account as it doesn't fit the narrative. Of course I base my statement on what I was taught in my Physical Chemistry class that I did take at a graduate level many years ago when the truth in Science appeared more important to Professors of most all areas of study than it appears to be today.
Actually the long term model was pretty dead on. The dynamics missing where mainly earth crust issues and issues on how much C02 was originally contained in the earth that is now released due to us digging it up (basically since that C02 has been contained for a power of millions of years in a form we can't measure, we don't know how much more will be released over time with our current human activity).
After all the core mechanics were identified, and as we went through more and more secondary mechanics, it became clear really quickly that the secondary mechanics had less and less of an impact. The issue was the rate of change due to feedback effects, which made it hard to predict temperature changes in small time intervals.
There was no narrative in that class. The prof tore apart both political sides of the debate and refused to make a statement whether or not global warning was an issue or not.
We had about 40 - 50 pages of calculations done by the end of the course building up our model and matching it to the Ice Core data (goes back 600 000 years), the geological data (going back millions of years) and the 130 years of modern data, and pieced together data going back x hundreds of years. The long term model predicting ices ages were pretty dead on (in comparison to thee actual historical trend in the ice core data) and it indicates that we should be cooling and heading to a new ice-age. But the last 300 - 500 years of temp data shows clearly that we are going in the opposite direction to the historical cycle, and going in the opposite direction at a rate much faster than normal. The apparent cause of this is from two clear factors, we have destroyed so many C02 sinks and now have way more free C02 then normal in the system, this affects the equilibrium point of the system in the black body radiation calculations (these dominate all the known mechanics), this excess C02 has offset most of the known major feedback effect mechanisms that favor cooling, and thus the models shows that a clear abnormal trend of warming is to be expected. We can see its going to be warming, and can estimate the total temperature shift over time, but we have a hard time in finding the exact rate and time scale for when we are talking about sub 100-200 year resolution. We lack the complete details on the secondary feedback mechanics and how they all interact. This effects our ability to get a smaller time resolution but does not effect the calculations for the longer term trends. All the major mechanics that dominate the overall trend are pretty well known, even though we don't have a complete picture, the secondary stuff we are missing clearly does not override the dominating mechanics.
edit on 27-2-2016 by halfmask because: (no reason given)
a reply to: snchrnct
I think that all people who deny climate change and rising seawater should be required to move right next to the ocean.
Areas of Antarctica glaciers are now melting at an alarming rate and speeding up. The sea level rise from the two small sections of those Antarctica glaciers alone contain a 3 meter level rise worth of sea water. Greenland is also definitely going to 100% melt. That's already too late. The Inuit who have lived in Northern Canada by the snow ice and ocean for hundreds of years can tell you it's fact. They actually canoed their way down to meet up with parliament to ask wtf are you guys doing to the planet.
Please tell your global warming denying friends to all invest in some seaside property. You'll find great deals in the near future.
Here's a video so you can actually see scientists telling you while you watch the water melt.
originally posted by: Phage
originally posted by: Justoneman
originally posted by: Phage
a reply to: theboarman
im sure it couldnt have been to hot because they were some of the biggest things on this planet
How "hot" it was then is not really the issue.
The issue is how an increasing global temperature average will affect climates, and thereby human civilization.
The more important question hanging like a chad is, what is the Earths ideal temperature Phage?
Strawman? Or just a silly question?
That would depend on your point of view I suppose. From the point of view of human civilization, it is what it has been for the the past several years or so since those are the conditions under which that civilization developed and population greatly expanded. A change greater than 2º in the global average will have various effects which will impact that civilization. The faster the rate at which that change occurs, the less time there will be to mitigate the impacts.
No strawman action there. Simple really, do we know what an ideal temperature is? I suppose we can debate what is supported in the science community concerning the beliefs about historical climate that gives rise to my dissent. With the assumptions being made about the man made affects. It appears that relative to the periods of deep cyclical changes there is no getting through. Our atmosphere is in a constant attempt at equilibrium in a partially closed system #1. And there are taxation without representation issues. I have been smelling rats for a long time and here I get the privilege of debating the deniers of natural climate change.
edit on 28-2-2016 by Justoneman because: (no reason given)
originally posted by: Phage
originally posted by: Justoneman
originally posted by: Phage
a reply to: theboarman
im sure it couldnt have been to hot because they were some of the biggest things on this planet
How "hot" it was then is not really the issue.
The issue is how an increasing global temperature average will affect climates, and thereby human civilization.
The more important question hanging like a chad is, what is the Earths ideal temperature Phage?
Strawman? Or just a silly question?
That would depend on your point of view I suppose. From the point of view of human civilization, it is what it has been for the the past several years[*] or so since those are the conditions under which that civilization developed and population greatly expanded.
*Do you mean the current climate conditions that we've adapted to in the last 200 years using technology and innovation, or the conditions of the Medieval Warming Period's climate where western civilization flourished, or the Little Ice Age that hypothetically brought on plagues that killed the majority of Europe, or the Central African climate and then Ice Age that supposedly brought humans out of Africa... which one? I'm sure there are others.
A change greater than 2º in the global average will have various effects which will impact that civilization. The faster the rate at which that change occurs, the less time there will be to mitigate the impacts.
Gosh. I certainly hope we have a robust energy sector with thriving technology to deal with that...
edit on 28-2-2016 by Teikiatsu because:
(no reason given)
a reply to: halfmask
By now, there are confirmed long term issues with the models. Those who appear asleep to the reality are missing somethings that are major in why the Earth has the final say. Then go attempt to get away with "it is settled". For one, we are in a partially closed atmospheric system. Another is indeed that pesky Earth's crust and accompanying Volcanic activity.
Also include the fact that there are just some things man cannot possibly know about our future. One big one is, no one can know exactly what is going to arrive in the debris from space we collect as we naturally move through the universes. Nor can anyone reliably predict how many anything, cosmic rays etc, that are going to hit the earth from space in any given period of time. We have some short term data with conflicting information .
Can we all can agree that conflicting information alone is making this very difficult? Besides ice certainly kills crops, while warm temperatures and CO2 are vastly better for life sustaining food crops and the trees.
If they could prove there was a civilization at this level in the cyclical data records influencing the deep temperature cycle, we would have a connection to man you could sink your teeth into.
originally posted by: Teikiatsu
originally posted by: Phage
originally posted by: Justoneman
originally posted by: Phage
a reply to: theboarman
im sure it couldnt have been to hot because they were some of the biggest things on this planet
How "hot" it was then is not really the issue.
The issue is how an increasing global temperature average will affect climates, and thereby human civilization.
The more important question hanging like a chad is, what is the Earths ideal temperature Phage?
Strawman? Or just a silly question?
That would depend on your point of view I suppose. From the point of view of human civilization, it is what it has been for the the past several years[*] or so since those are the conditions under which that civilization developed and population greatly expanded.
*Do you mean the current climate conditions that we've adapted to in the last 200 years using technology and innovation, or the conditions of the Medieval Warming Period's climate where western civilization flourished, or the Little Ice Age that hypothetically brought on plagues that killed the majority of Europe, or the Central African climate and then Ice Age that supposedly brought humans out of Africa... which one? I'm sure there are others.
A change greater than 2º in the global average will have various effects which will impact that civilization. The faster the rate at which that change occurs, the less time there will be to mitigate the impacts.
Gosh. I certainly hope we have a robust energy sector with thriving technology to deal with that...
It's Medieval Warm Period, not Warming. The MWP was cooler than today.
originally posted by: Justoneman
a reply to: halfmask
By now, there are confirmed long term issues with the models. Those who appear asleep to the reality are missing somethings that are major in why the Earth has the final say. Then go attempt to get away with "it is settled". For one, we are in a partially closed atmospheric system. Another is indeed that pesky Earth's crust and accompanying Volcanic activity.
Also include the fact that there are just some things man cannot possibly know about our future. One big one is, no one can know exactly what is going to arrive in the debris from space we collect as we naturally move through the universes. Nor can anyone reliably predict how many anything, cosmic rays etc, that are going to hit the earth from space in any given period of time. We have some short term data with conflicting information .
Can we all can agree that conflicting information alone is making this very difficult? Besides ice certainly kills crops, while warm temperatures and CO2 are vastly better for life sustaining food crops and the trees.
If they could prove there was a civilization at this level in the cyclical data records influencing the deep temperature cycle, we would have a connection to man you could sink your teeth into.
What do you mean by "there are confirmed long term issues with the models"? How can you confirm a long term issue if we are not in the distance future with the future data to compare the model to? That blanket statement was kind of empty.
The long term model in our class was compared to the historical ice age data, to identify the mechanics behind the ice-age cycles. These mechanics today are pretty well known as the cycles from the ice core data match the models.
Volcanoes are accounted for in the models, and their C02 out put is insignificant compared to the C02 we are digging up and pumping out with our human activity (volcanoes annually average 200 million tons, while we humans put out annually 25 billion tons or more). The main unknown earth crust issues are to do with heating caused by radio-active decay within the crust.
We do have an average on the amount of material added from space. This does not affect the black body calculations in any meaning full way as they are based on surface temperature and surface area and chemical composition of the atmosphere. More mass would eventually lead to a larger surface area, but not on any meaning full time scale. Water and C02 are the biggest gasses affecting the black body radiation. Meteors bring in minerals and ice while be insignificant or even add more to warming as more water in the atmosphere would cause more warming. Remember as I have said that black body-radiation dominates the warming mechanics. Small unaccounted for mechanics add insignificant effects over long term trends, they only make it more difficult to predict exact temperatures on small time scales.
Cosmic rays are insignificant compared to the sun and more then expected would just add to more heating.
What short term data with conflicting information are you talking about? I am not aware of any short term conflicting data and also what do you consider short term? 1 year, 10 years, 100 years? A shorter term data conflict in a 10 year term is almost meaningless to the data for the large scale trends.
Yes C02 is better for plants, but we have been cutting down forest, and replacing it with with food crops that don't act as good long term C02 sinks. Replacing forest with agricultural surface area and urban surface area just adds more to heating as it decreases the amount of radiation reflected.
The dominating mechanic in earths surface temperature is the black body radiation from the earth compared to the intake of the sun. The core things that affect the radiation released from the earth is dependent on the type of surface area on the earth and the chemical composition in the atmosphere. We are breaking the natural system that has been in place for millions of years, by destroying the C02 sinks and changing the earths surface area types. Both of these changes result in heating. Heating is inevitable with what we are doing, the only issue is we don't understand is by how much feedback effects will amplify it. Without feedback effects my class predicted a 6 degrees C increase, with feedback effects it will be more. Feedback effects will also increase the speed at which we reach the new higher equilibrium temperature. The feedback effects that support cooling are clearly being out done by what is going on as we currently should be cooling but we are not,this is according to the long term data. There is no scientific doubt about this, there is no conflicting data that my class found of any note.
edit on 28-2-2016 by halfmask because: (no reason given)
edit on 28-2-2016 by halfmask because: (no reason given)
originally posted by: Greven
It's Medieval Warm Period, not Warming. The MWP was cooler than today.
It was not...
Evidence for the existence of the medieval warm period in China
Chinese Academy of Meteorological Sciences, Baishiqiaolu No. 46, 100081 Beijing, China
Abstract The collected documentary records of the cultivation of citrus trees and Boehmeria nivea (a perennial herb) have been used to produce distribution maps of these plants for the eighth, twelfth and thirteenth centuries A.D. The northern boundary of citrus and Boehmeria nivea cultivation in the thirteenth century lay to the north of the modern distribution. During the last 1000 years, the thirteenth-century boundary was the northernmost. This indicates that this was the warmest time in that period. On the basis of knowledge of the climatic conditions required for planting these species, it can be estimated that the annual mean temperature in south Henan Province in the thirteenth century was 0.9–1.0°C higher than at present. A new set of data for the latest snowfall date in Hangzhou from A.D. 1131 to 1264 indicates that this cannot be considered a cold period, as previously believed.
www.springerlink.com...
...
[atsimg]http://files.abovetopsecret.com/images/member/a357061c7174.jpg[/atsimg]
...
II.2.3 The Medieval Warm Period
After the DACP was another warm period that continued until c. 1350 A.D., and it was wet and warm again like the RWP. Although some scientists argue that actually there was no significant warm climate during the MWP in East Asia, it seems evident that at least the 12th century was warmer than any other periods - even warmer than today-discussed on this paper. (8)
...
www.zum.de...
The claim that it wasn't a global event is also false.
Glacial geological evidence for the medieval warm period
Abstract It is hypothesised that the Medieval Warm Period was preceded and followed by periods of moraine deposition associated with glacier expansion. Improvements in the methodology of radiocarbon calibration make it possible to convert radiocarbon ages to calendar dates with greater precision than was previously possible. Dating of organic material closely associated with moraines in many montane regions has reached the point where it is possible to survey available information concerning the timing of the medieval warm period. The results suggest that it was a global event occurring between about 900 and 1250 A.D., possibly interrupted by a minor readvance of ice between about 1050 and 1150 A.D.
www.springerlink.com...
The claim that climate and the weather these days are at a extreme never before seen by humans, occurring so fast is also false.
doi:10.1016/j.quaint.2007.06.001
Copyright © 2007 Elsevier Ltd and INQUA All rights reserved.
Extreme Nile floods and famines in Medieval Egypt (AD 930–1500) and their climatic implications
References and further reading may be available for this article. To view references and further reading you must purchase this article.
Fekri A. Hassana,
aInstitute of Archaeology, University College London, 31-34 Gordon Square, WC1H 0PY, London, UK
Available online 7 June 2007.
Abstract
Nile gauge records of variations in Nile floods from the 9th century to the 15th century AD reveal pronounced episodes of low Nile and high Nile flood discharge. Historical data reveal that this period was also characterized by the worst known famines on record. Exploratory comparisons of variations in Nile flood discharge with high-resolution data on sea surface temperature of the North Atlantic climate from three case studies suggest that rainfall at the source of the Nile was influenced by the North Atlantic Oscillation. However, there are apparently flip-flop reversals from periods when variations in Nile flood discharge are positively related to North Atlantic warming to periods where the opposite takes place. The key transitions occur atAD 900, 1010, 1070, 1180, 1350 and 1400. The putative flip-flop junctures, which require further confirmation, appear to be quite rapid and some seem to have had dramatic effects on Nile flood discharge, especially if they recurred at short intervals, characteristic of the period from the 9th to the 14th century, coincident with the so-called Medieval Warm Period. The transition from one state to the other was characterized by incidents of low, high or a succession of both low and high extreme floods. The cluster of extreme floods was detrimental causing famines and economic disasters that are unmatched over the last 2000 years.
www.sciencedirect.com
On-line Publication Documentation System for Stockholm University
Full DescriptionUpdate record
Publication type: Article in journal (Reviewed scientific)
Author: Grudd, H (Department of Physical Geography and Quaternary Geology)
Title: Torneträsk tree-ring width and density ad 500–2004: a test of climatic sensitivity and a new 1500-year reconstruction of north Fennoscandian summers
In: Climate Dynamics
Publisher: Springer, Berlin / Heidelberg
Volume: 31
Pages: 843-857
Year: 2008
Available: 2009-01-30
ISSN: 1432-0894
Department: Department of Physical Geography and Quaternary Geology
Language: English [en]
Subject: Physical geography, Climatology
Abstract: This paper presents updated tree-ring width (TRW) and maximum density (MXD) from Torneträsk in northern Sweden, now covering the period ad 500–2004.
...
The new data show generally higher temperature estimates than previous reconstructions based on Torneträsk tree-ring data[/size. The late-twentieth century, however, is not exceptionally warm in the new record: On decadal-to-centennial timescales, periods around ad 750, 1000, 1400, and 1750 were equally warm, or warmer. The 200-year long warm period centered on ad 1000 was significantly warmer than the late-twentieth century (p < 0.05) and is supported by other local and regional paleoclimate data. The new tree-ring evidence from Torneträsk suggests that this “Medieval Warm Period” in northern Fennoscandia was much warmer than previously recognized.
www.diva-portal.org...
(continued below)
edit on 29-2-2016 by ElectricUniverse because: correct comment.
P. D. Tyson, W. Karlén, K. Holmgren and G. A. Heiss (in press) The Little Ice Age and Medieval Warming in South Africa. South African Journal of Science.
-----
The Little Ice Age and Medieval Warming in South Africa
P. D. Tyson1, W. Karlén2, K. Holmgren2 and G. A. Heiss3.
1Climatology Research Group, University of the Witwatersrand
2Department of Physical Geography, Stockholm University
3Geomar, Wischhofstr. 1-3, 24148 Kiel, Germany; present address: German Advisory Council on Global Change (WBGU), P.O. Box 120161, 27515 Bremerhaven, Germany, E-mail: [email protected]
Abstract
The Little Ice Age, from around 1300 to 1800, and medieval warming, from before 1000 to around 1300 in South Africa, are shown to be distinctive features of the regional climate of the last millennium. The proxy climate record has been constituted from oxygen and carbon isotope and colour density data obtained from a well-dated stalagmite derived from Cold Air Cave in the Makapansgat Valley.
The climate of the interior of South Africa was around 1oC cooler in the Little Ice Age and may have been over 3°C higher than at present during the extremes of the medieval warm period. It was variable throughout the millennium, but considerably more so during the warming of the eleventh to thirteenth centuries. Extreme events in the record show distinct teleconnections with similar events in other parts of the world, in both the northern and southern hemispheres. The lowest temperature events recorded during the Little Ice Age in South Africa are shown to be coeval with the Maunder and Sporer Minima in solar irradiance. The medieval warming is shown to have been coincided with the cosmogenic 10Be and 14C isotopic maxima recorded in tree rings elsewhere in the world during the Medieval Maximum in solar radiation.
www-user.uni-bremen.de...
Title:
Late Holocene Environmental and Hydrologic Conditions in Northwestern Florida Derived from Seasonally Resolved Profiles of δ18O and Sr/Ca of Fossil Bivalves.
Authors:
Elliot, M.; de Menocal, P. B.; Linsley, B. K.; Howe, S. S.; Guilderson, T.; Quitmyer, I. R.
Affiliation:
AA(Edinburgh University, Dept. Geology and Geophysics, West Mains Road, Edinburgh, EH9 3JW United Kingdom ; [email protected]), AB(Lamont Doherty Earth Observatory, Route 9W, Palisades, NY 10964 ; [email protected]), AC(University at Albany, 1400 Washington Ave, Albany, NY 12222 ; [email protected]), AD(Laurence Livermore National Laboratory, 7000 East Ave, Livermore, CA 94550 ; [email protected]), AE(Laurence Livermore National Laboratory, 7000 East Ave, Livermore, CA 94550 ; ), AF(Florida Museum of Natural History, Dickinson Hall, Gainesville, FL 32611 ; )
Publication:
American Geophysical Union, Fall Meeting 2002, abstract #PP72A-0429
Publication Date:
12/2002
Origin:
AGU
AGU Keywords:
3344 Paleoclimatology, 4215 Climate and interannual variability (3309), 4227 Diurnal, seasonal, and annual cycles, 4870 Stable isotopes, 4875 Trace elements
Bibliographic Code:
2002AGUFMPP72A0429E
Abstract
We reconstruct environmental conditions of coastal Northwestern Florida from combined measurements of δ18O and Sr/Ca of fossil marine bivalves deposited in an archeological site during the late Holocene period. We first investigated the environmental controls of seasonally resolved records of δ18O and Sr/Ca of modern Mercenaria mercenaria and Mercenaria campesiensis collected live from five coastal sites along the east coast of North America. Seasonal profiles were obtained by sub-sampling the incremental growth layers of aragonite and were compared with in situ historical records of temperature and salinity. We show that these bivalves precipitate their shell in isotopic equilibrium with the water in which they grew and that the δ18O records are not affected by variations in growth rate. Winter growth appears to be interrupted or strongly reduced below water temperatures ranging from 7 to 18° C, depending on latitude. The annual average δ18O decreases with latitude, reflecting both the parallel trend of freshwater δ18O with latitude over the North American continent and the reduced winter growth rate. The Sr/Ca records of the 5 modern bivalves also exhibit seasonal variations can be correlated to water temperature. However, contrary to corals, the Sr/Ca ratio is considerably lower than the average sea water Sr/Ca composition and is positively correlated to the water temperature. We dated and measured the δ18O and Sr/Ca of 30 fossil M. campesiensis from an archeological site close to Cedar Key, in the Gulf of Mexico. Accelerator Mass Spectrometry 14C dates obtained for each shell show ages which cluster between 1100 to 1400 and 2300 to 2600 14C years BP corresponding approximately to two historical warm periods known as the Medieval Warm Period (~ 1300-900AD) and the Roman Warm Period (~ 250AD-200BC). The average annual and summer Sr/Ca of 4 fossil shells are higher than that of modern bivalves from the same location suggesting that annual coastal water temperatures were 3 to 4° C warmer than today. The bulk δ18O values show a marked trend towards more positive values. 24 fossil shells have bulk δ18O values 0.2permil to 0.7permil more positive than modern bivalves from the same location. These results suggest that the coastal waters off northwest Florida were warmer and less saline compared to today and attest of considerable differences of the regional climate and hydrological balance during the Medieval Warm Period and Roman Warm Period.
adsabs.harvard.edu...
So again, it isn't hotter today than it was during the MWP(Medieval Warm Period), and much less during the RWM(Roman Warm Period). That's also not mentioning other warm periods.
edit on 29-2-2016 by ElectricUniverse because: correct comment.
About the claim that solar activity could not account for most of the warming occurring during the 20th and part of the 21st century...
The Role of Solar Activity on Holocene Glacier Length Variability in the swiss Alps
www.sciencemag.org...
www.earthinstitute.columbia.edu...
Hormes, A., Beer, J. and Schlüchter, C., 2006. A geochronological approach to understanding the role of solar activity on Holocene glacier length variability in the Swiss Alps. Geogr. Ann., 88 A (4): 281–294.
Abstract — We present a radiocarbon data set of 71 samples of wood and peat material that melted out or sheared out from underneath eight present day mid-latitude glaciers in the Central Swiss Alps. Results indicated that in the past several glaciers have been repeatedly less extensive than they were in the 1990s. The periods when glaciers had a smaller volume and shorter length persisted between 320 and 2500 years. This data set provides greater insight into glacier variability than previously possible, especially for the early and middle Holocene. The radiocarbon-dated periods defined with less extensive glaciers coincide with periods of reduced radioproduction, pointing to a connection between solar activity and glacier melting processes. Measured long-term series of glacier length variations show significant correlation with the total solar irradiance. Incoming solar irradiance and changing albedo can account for a direct forcing of the glacier mass balances. Long-term investigations of atmospheric processes that are in interaction with changing solar activity are needed in order to understand the feedback mechanisms with glacier mass balances.
The Role of Solar Activity on Holocene Glacier Length Variability in the swiss Alps
Science 26 September 1997:
Vol. 277. no. 5334, pp. 1963 - 1965
DOI: 10.1126/science.277.5334.1963
Prev | Table of Contents | Next
Reports
Total Solar Irradiance Trend During Solar Cycles 21 and 22
Richard C. Willson
Results from Active Cavity Radiometer Irradiance Monitor (ACRIM) experiments show an upward trend in total solar irradiance of 0.036 percent per decade between the minima of solar cycles 21 and 22. The trend follows the increasing solar activity of recent decades and, if sustained, could raise global temperatures. Trends of total solar irradiance near this rate have been implicated as causal factors in climate change on century to millennial time scales.
www.sciencemag.org...
Earth Institute News Archive
posted 03/20/03
Researcher Finds Solar Trend That Can Warm Climate
Ends debate over whether sun can play a role in climate change
Since the late 1970s, the amount of solar radiation the sun emits during times of quiet sunspot activity has increased by nearly .05 percent per decade, according to the study. “This trend is important because, if sustained over many decades, it could cause significant climate change,” said Willson, a researcher affiliated with NASA Goddard Institute for Space Studies and the Earth Institute at Columbia University, and lead author of the study recently published in Geophysical Research Letters.
“Historical records of solar activity indicate that solar radiation has been increasing since the late 19th century,” says Willson. “If a trend comparable the one found in this study persisted during the 20th century it would have provided a significant component of the global warming that the Intergovernmental Panel on Climate Change report claims to have occurred over the last 100 years.”
Willson found errors in previous satellite data that had obscured the trend. The new analysis, Willson says, should put an end to a debate in the field over whether solar irradiance variability can play a significant role in climate change.
The solar cycle occurs approximately every 11 years when the sun undergoes a period of increased magnetic and sunspot activity called the "solar maximum," followed by a quiet period called the "solar minimum." A trend in the average solar radiation level over many solar magnetic cycles would contribute to climate change in a major way. Satellite observations of total solar irradiance have now obtained a long enough record (over 24 years) to begin looking for this effect.
...
In order to investigate the possibility of a solar trend, Willson needed to put together a long-term dataset of the Sun’s total output. Six overlapping satellite experiments have monitored TSI since late 1978.The first record came from the National Oceanic and Atmospheric Administration’s (NOAA) Nimbus7 Earth Radiation Budget (ERB) experiment (1978-1993). Other records came from NASA’s Active Cavity Radiometer Irradiance Monitors: ACRIM1 on the Solar Maximum Mission (1980-1989), ACRIM2 on the Upper Atmosphere Research Satellite (1991-2001) and ACRIM3 on the ACRIMSAT satellite (2000 to present). Also, NASA launched its own Earth Radiation Budget Experiment on its Earth Radiation Budget Satellite (ERBS) in 1984. And, the European Space Agency’s (ESA) SOHO/VIRGO experiment also provided an independent data set during 1996-1998.
In this study, Willson, who is also Principal Investigator of the ACRIM experiments, compiled a TSI record of over 24 years by carefully piecing together the overlapping records. In order to construct a long-term dataset, Willson needed to bridge a two-year gap (1989-1991) between ACRIM1 and ACRIM2. Both the Nimbus7/ERB and ERBS measurements overlapped the ACRIM ‘gap.’ Using Nimbus7/ERB results produced a 0.05 percent per decade upward trend between solar minima, while ERBS results produced no trend. Until this study, the cause of this difference, and hence the validity of the TSI trend, was uncertain. Now, Willson has identified specific errors in the ERBS data responsible for the difference. The accurate long-term dataset therefore shows a significant positive trend (.05 percent per decade) in TSI between the solar minima of solar cycles 21 to 23 (1978 to present).
www.earthinstitute.columbia.edu...
edit on 29-2-2016 by ElectricUniverse because: correct comment.
Then we also have to take into account the fact that the Earth is going through other changes which are not linked to atmospheric CO2, but rather an
increase in activity in the Earth's core which has caused an increase in volcanic and magmatic activity, more so underwater. The fact that the
Earth's magnetic north has moved very fast recently, and the Earth's magnetic field has changed dramatically, etc. All of which do affect climate
change.
Earth's Magnetic Field Is Weakening 10 Times Faster Now
North Magnetic Pole Is Shifting Rapidly Toward Russia
Then there is the underwater volcanoes that are heating and melting glaciers...
Hidden Volcanoes Melt Antarctic Glaciers from Below
And...
www.cdc.noaa.gov...
www.esrl.noaa.gov...
news.independent.co.uk...
But of course, it is easier(for some strange reason) to simply blame it all on mankind...
Earth's Magnetic Field Is Weakening 10 Times Faster Now
North Magnetic Pole Is Shifting Rapidly Toward Russia
Then there is the underwater volcanoes that are heating and melting glaciers...
Hidden Volcanoes Melt Antarctic Glaciers from Below
And...
Oceanic Influences on Recent Continental Warming
GILBERT P. COMPO
PRASHANT D. SARDESHMUKH
Climate Diagnostics Center,
Cooperative Institute for Research in Environmental Sciences,
University of Colorado, and
Physical Sciences Division, Earth System Research Laboratory,
National Oceanic and Atmospheric Administration
325 Broadway R/PSD1
Boulder CO 80305-3328
[email protected]
(303) 497-6115
(303) 497-6449
Citation:
Compo, G.P., and P.D. Sardeshmukh, 2008: Oceanic influences on recent continental warming. Climate
Dynamics, doi: 10.1007/s00382-008-0448-9.
This article is published by Springer-Verlag. This author-created version is distributed courtesy of Springer-Verlag.
The original publication is available from www.springerlink.com at
www.springerlink.com...
Abstract
Evidence is presented that the recent worldwide land warming has occurred largely in response to a worldwide warming of the oceans rather than as a direct response to increasing greenhouse gases (GHGs) over land.
Atmospheric model simulations of the last half-century with prescribed observed ocean temperature changes, but without prescribed GHG changes, account for most of the land warming. The oceanic influence has occurred through hydrodynamic-radiative teleconnections, primarily by moistening and warming the air over land and increasing the downward longwave radiation at the surface. The oceans may themselves have warmed from a combination of natural and anthropogenic influences.
www.cdc.noaa.gov...
www.esrl.noaa.gov...
A mysterious phenomenon is causing four major glaciers in the Antarctic to shrink in unison, causing a significant increase in sea levels, scientists have found.
The rise in atmospheric temperatures caused by global warming cannot account for the relatively rapid movement of the glaciers into the sea, but scientists suspect that warmer oceans may be playing a role.
"There is a possibility that heat from the ocean is somehow flowing in underneath these glaciers, but it is not related to global warming," said glaciologist Duncan Wingham of University College London. "Something has changed that is causing these glaciers to shrink.
"At this rate the glaciers will all be afloat in 150 years or so."
...
However, it would take about 200 years for extra heat from the ocean to reach the underside of the glaciers, which makes it difficult to believe that the present shrinkage is due to global warming, Dr Wingham said.
news.independent.co.uk...
But of course, it is easier(for some strange reason) to simply blame it all on mankind...
edit on 29-2-2016 by ElectricUniverse because: add link and correct comment.
I did forget to present proof that Earthquake activity has in fact increased pointing to the several changes Earth is going through which have nothing
to do with "anthropogenic CO2"...
www.livescience.com...
There are some people who would claim this is not true, but those people happen to be wrong.
profile.usgs.gov...
quake.geo.berkeley.edu...
The Earth is going through changes and will continue to do so, with, or without mankind and it isn't mankind's fault.
...
The average rate of big earthquakes — those larger than magnitude 7 — has been 10 per year since 1979, the study reports. That rate rose to 12.5 per year starting in 1992, and then jumped to 16.7 per year starting in 2010 — a 65 percent increase compared to the rate since 1979. This increase accelerated in the first three months of 2014 to more than double the average since 1979, the researchers report.
...
www.livescience.com...
There are some people who would claim this is not true, but those people happen to be wrong.
...
1. Introduction
Obvious increases in the global rate of large (M ≥ 7.0) earthquakes happened after 1992, 2010, and especially during the first quarter of 2014 (Table 1 and Figure 1). Given these high rates, along with suggestions that damaging earthquakes may be causatively linked at global distance [e.g., Gomberg and Bodin, 1994; Pollitz et al., 1998; Tzanis and Makropoulos, 2002; Bufe and Perkins, 2005; Gonzalez-Huizar et al., 2012; Pollitz et al., 2012, 2014], we investigate whether there is a significant departure from a random process underlying these rate changes. Recent studies have demonstrated that M ≥ 7.0 earthquakes (and also tsunamis) that occurred since 1900 follow a Poisson process [e.g., Michael, 2011; Geist and Parsons, 2011; Daub et al., 2012; Shearer and Stark, 2012; Parsons and Geist, 2012; Ben-Naim et al., 2013]. Here we focus on the period since 2010, which has M ≥ 7.0 rates increased by 65% and M ≥ 5.0 rates up 32% compared with the 1979 – present average. The first quarter of 2014 experienced more than double the average M ≥ 7.0 rate, enough to intrigue the news media [e.g., www.nbcnews.com...]. We extend our analysis to M ≥ 5.0 levels, as many of these lower magnitude events convey significant hazard, and global catalogs have not generally been tested down to these thresholds.
2. Methods and Data
We work with the Advanced National Seismic System (ANSS) catalog of M≥ 5.0 global earthquakes for the period between 1979 and 2014.3 with a primary focus on the recent interval between 2010 and 2014.3 that shows the highest earthquake rates (Table 1 and Figure 1). A variety of tests suggest that the catalog is complete down to magnitudes between M=4.6 and M=5.2, depending on the method used to assess it (see supporting information). We examine a range of lower magnitude thresholds above M =5.0 to account for this uncertainty.
...
profile.usgs.gov...
quake.geo.berkeley.edu...
The Earth is going through changes and will continue to do so, with, or without mankind and it isn't mankind's fault.
edit on 29-2-2016 by ElectricUniverse because: correct comment.
new topics
-
Hurt my hip; should I go see a Doctor
General Chit Chat: 39 minutes ago -
Israel attacking Iran again.
Middle East Issues: 1 hours ago -
Michigan school district cancels lesson on gender identity and pronouns after backlash
Education and Media: 1 hours ago -
When an Angel gets his or her wings
Religion, Faith, And Theology: 2 hours ago -
Comparing the theology of Paul and Hebrews
Religion, Faith, And Theology: 3 hours ago -
Pentagon acknowledges secret UFO project, the Kona Blue program | Vargas Reports
Aliens and UFOs: 4 hours ago -
Boston Dynamics say Farewell to Atlas
Science & Technology: 4 hours ago -
I hate dreaming
Rant: 5 hours ago -
Man sets himself on fire outside Donald Trump trial
Mainstream News: 7 hours ago -
Biden says little kids flip him the bird all the time.
Politicians & People: 7 hours ago
top topics
-
The Democrats Take Control the House - Look what happened while you were sleeping
US Political Madness: 7 hours ago, 17 flags -
In an Historic First, In N Out Burger Permanently Closes a Location
Mainstream News: 9 hours ago, 16 flags -
A man of the people
Medical Issues & Conspiracies: 15 hours ago, 10 flags -
Biden says little kids flip him the bird all the time.
Politicians & People: 7 hours ago, 8 flags -
Man sets himself on fire outside Donald Trump trial
Mainstream News: 7 hours ago, 7 flags -
Pentagon acknowledges secret UFO project, the Kona Blue program | Vargas Reports
Aliens and UFOs: 4 hours ago, 6 flags -
Israel attacking Iran again.
Middle East Issues: 1 hours ago, 5 flags -
Michigan school district cancels lesson on gender identity and pronouns after backlash
Education and Media: 1 hours ago, 4 flags -
Boston Dynamics say Farewell to Atlas
Science & Technology: 4 hours ago, 4 flags -
4 plans of US elites to defeat Russia
New World Order: 17 hours ago, 4 flags
active topics
-
Hurt my hip; should I go see a Doctor
General Chit Chat • 5 • : Caver78 -
MULTIPLE SKYMASTER MESSAGES GOING OUT
World War Three • 50 • : cherokeetroy -
Pentagon acknowledges secret UFO project, the Kona Blue program | Vargas Reports
Aliens and UFOs • 7 • : Ophiuchus1 -
-@TH3WH17ERABB17- -Q- ---TIME TO SHOW THE WORLD--- -Part- --44--
Dissecting Disinformation • 549 • : cherokeetroy -
In an Historic First, In N Out Burger Permanently Closes a Location
Mainstream News • 9 • : VariedcodeSole -
When an Angel gets his or her wings
Religion, Faith, And Theology • 1 • : lilzazz -
Israel attacking Iran again.
Middle East Issues • 18 • : BeyondKnowledge3 -
A man of the people
Medical Issues & Conspiracies • 14 • : chr0naut -
British TV Presenter Refuses To Use Guest's Preferred Pronouns
Education and Media • 68 • : ToneD -
MH370 Again....
Disaster Conspiracies • 9 • : WakeUpBeer