It looks like you're using an Ad Blocker.
Please white-list or disable AboveTopSecret.com in your ad-blocking tool.
Thank you.
Some features of ATS will be disabled while you continue to use an ad-blocker.

Global Temperatures Skyrocketing (Again)
page: 6share:
a reply to: mc_squared
I have an honest question about your chart showing the oceans "ate" the heat.
Presumably this is not just a modern phenomenon but has always happened?
Now the southern hemisphere has more ocean and less land? Right?
The northern hemisphere has less ocean and more land? Right?
So obviously the temperature in the southern hemisphere should not be as warm as the northern hemisphere? Right?
But most climate models are based on the northern hemisphere because that is where most of the historical records exist.
Can I conclude from this that what we are talking about here is not global warming but northern hemisphere warming???
Here is a published paper from May 2014.
www.nature.com...
Sorry - I ain't paying money to read the original paper
But there is little disagreement that the temperatures of the two hemispheres simply do not often match up.
So how can anyone be talking about "global warming" and how can 1 temperature actually reflect the entire globe?
Tired of Control Freaks
originally posted by: pikestaff
Just done a trawl through my archives, two reports, one stating that piles of snow still there is Buffalo, NY, in June, and unmelted snow still there in Scotland (UK) in July, this year, so where is the heat?
Come to Vegas, I'll show you heat. Remember that just because it's cold where you are does not negate global warming trends. Temperature Data from this year shows that this is the hottest year on record. That's just truth right there. How do you get there, you average it out over the entire planet, not just one location.
a reply to: TiredofControlFreaks
That's not close to anything I said. I said if they put out a chart that shows cooling from 1880-1940 the chart would be wrong.
However, after having re-read my first post, I can see in a couple of places where frustration took over facts and for that I apologize. I should not have said anything about year to year or one decade to the next as that is not how global temperatures changes are measured anyway.
Measured correctly, my overall point is true in that we have had no cooling significant enough to bring us back to global mean temperature averages prior to 1880.
Oh so when its cooling, the scientists are incorrect?
That's not close to anything I said. I said if they put out a chart that shows cooling from 1880-1940 the chart would be wrong.
However, after having re-read my first post, I can see in a couple of places where frustration took over facts and for that I apologize. I should not have said anything about year to year or one decade to the next as that is not how global temperatures changes are measured anyway.
Measured correctly, my overall point is true in that we have had no cooling significant enough to bring us back to global mean temperature averages prior to 1880.
Batten down the hatches.
There is going to be nasty cyclone season in the southern hemisphere, typhoons/cyclones love warm waters and they will intensify as they follow the warm currents. Those small island nations in the southern hemisphere could be wiped off the face of the planet.
I've seen trees with trunks as thick as a small car snap, imagine what would happen to those who live in rudimentary huts. All arguments aside; if the global sea water temperature continues to rise then the storms will form quicker, get stronger and last longer.
edit on 20-11-2015 by
Thecakeisalie because: (no reason given)
edit on 20-11-2015 by Thecakeisalie because: (no reason given)
This has already been debunked, the scientists used crappy data. Satellite data which covers MUCH more area of the actual Earth showed OCT being only
the 25th warmest. Just showing they're pushing an agenda as opposed to real hard science again.
a reply to: EverydayInVA
Care to cite some sources that backs up your opinion? (wattsupwiththat, joNova, ect..are NOT valid sources)
It appears all you are doing is adding your ignorant opinion that contributes nothing of substance to this discussion. Random internet comments from layman mean nothing in terms of climate science.
edit on 20-11-2015 by jrod because: h8 cellphone keypad
Not much understanding of physics, I gather. Or how a one degree rise affects extreme temperatures. Might also need to do some reading on statistics,
especially standard deviations.
Once homework is done, then revisit your statement. You need to.
a reply to: TerminalVelocity
Once homework is done, then revisit your statement. You need to.
a reply to: TerminalVelocity
a reply to: jrod
realclimatescience.com...
www.climatedepot.com...
Scientists from MIT and Princeton work for you?
realclimatescience.com...
www.climatedepot.com...
Scientists from MIT and Princeton work for you?
originally posted by: TiredofControlFreaks
a reply to: mc_squared
I have an honest question about your chart showing the oceans "ate" the heat.
Presumably this is not just a modern phenomenon but has always happened?
Now the southern hemisphere has more ocean and less land? Right?
The northern hemisphere has less ocean and more land? Right?
True, for a few dozen million years.
So obviously the temperature in the southern hemisphere should not be as warm as the northern hemisphere? Right?
It's a bit more complicated than that, but the dynamics are different from north to south. It's pretty clear that over land the temperature variations are also larger than over ocean; land also gets more cold parts too.
But most climate models are based on the northern hemisphere because that is where most of the historical records exist.
Not quite 'based on the northern hemisphere', but yes historical records far back are deeper in the N hempishere.
Can I conclude from this that what we are talking about here is not global warming but northern hemisphere warming???
No. Today, we have global coverage from far more inputs, including satellites and long running ocean-going floats and monitoring systems which travel the waters of the planet.
The N hemisphere bias in historical data records has been known for many years by the climate community and there is extensive literature on de-biasing techniques.
It's still true today but substantially less so. What may be the case is that the calibration of models to known observations may be stronger where there is more data. That doesn't mean they predict higher on one side vs another, but that errors may be larger. Also they predict relative to baselines which do not include greenhouse gas increases.
Just as weather models are better informed over populated land masses than remote ocean regions. The errors---in both directions---may be greater over remote regions than over populated regions.
So how can anyone be talking about "global warming" and how can 1 temperature actually reflect the entire globe?
Because people who do this for a living have figured out how to do it right, and there are multiple sources of input data and some of them have near global coverage.
One temperature doesn't reflect the globe, but it's a baseline summary value, and when the world, over most parts is warming, the number does say something.
edit on 20-11-2015 by mbkennel because: (no reason given)
edit on 20-11-2015 by mbkennel because: (no reason
given)
a reply to: EverydayInVA
Lindzen is the one well known semi-crank climatologist. But he acknowledges the warming influence of greenhouse gases, but thinks the climate sensitivity is less than consensus estimates. In his peer-reviewed work. In public, he says plenty of unsupported bull#.
Will Happer is an atomic physicist and he's just wrong. The idea that since animals respire CO2 doesn't mean that it's not a problem is just plain idiotic; or he knows it's misleading propagandistic powertalk which sounds good to ordinary people but is scientific nonsense. Animals respiring CO2 is not the problem, that carbon came from food which took in CO2 during its growing process. It's combustion of former fossil carbon which had been sequestered for aeons which is the problem.
Remember, there are undoubtably many dozens of other climate and physics professors at MIT and Princeton who say the opposite. What about them?
Let's see, there's an entire institute associated with Princeton, Geophysical Fluid Dynamics Laboratory...
www.gfdl.noaa.gov...
and MIT: cgcs.mit.edu... globalchange.mit.edu...
edit on 20-11-2015 by mbkennel because: (no reason given)
edit on 20-11-2015 by mbkennel because: (no reason given)
originally posted by: TiredofControlFreaks
a reply to: Kali74
ok but why is 1880 so important???? Because that is where temperature records stop? Why would the planet care about that?
It's a balance point when climate records start to get good enough but before there has been so much CO2 artificially injected in the atmosphere that it's effect is substantial.
originally posted by: EverydayInVA
This has already been debunked, the scientists used crappy data. Satellite data which covers MUCH more area of the actual Earth showed OCT being only the 25th warmest. Just showing they're pushing an agenda as opposed to real hard science again.
Let me tell you about satellite data. If you look at it, you tend to see a chart like this:
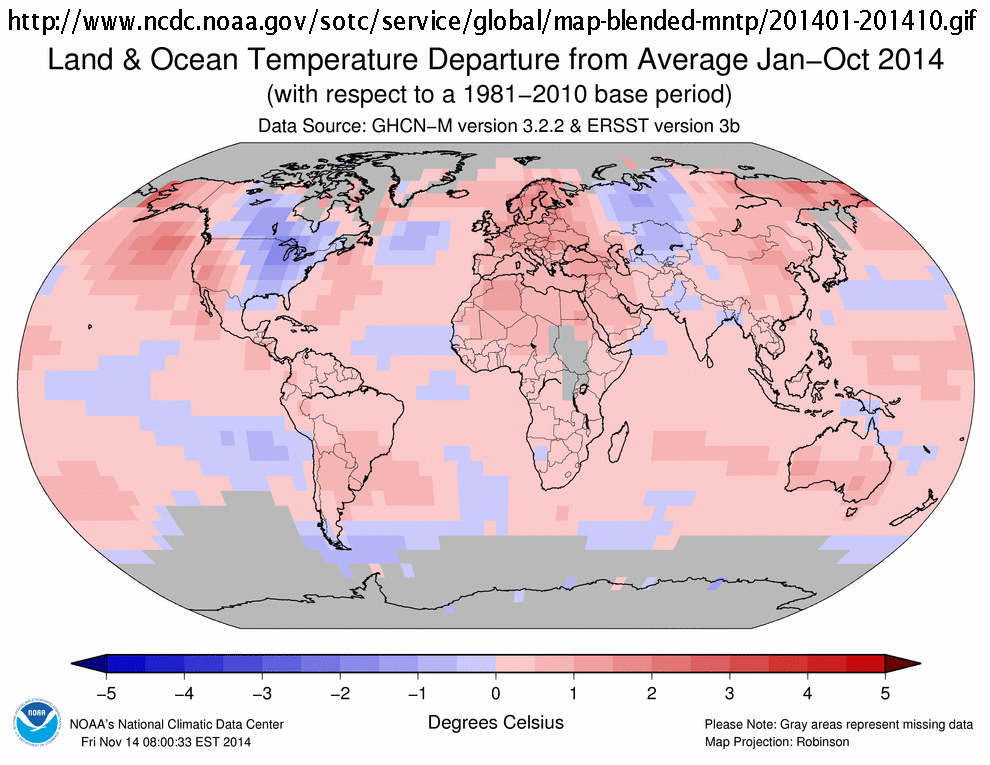
Note the grey areas - those are areas that are often unmeasured by satellites that measure global temperatures.
Why? Because these satellites are polar orbiters. Polar orbiters scan across the globe measuring a strip of the Earth from one pole to the other. As the Earth rotates, they scan a slightly different area.
However, due to inclination in the orbit for scanning most of the rest of the Earth, they aren't measuring the polar regions. Have a look at this page, near the bottom in the Low Earth Orbit section. You can see a nice image of a single day of recording by a particular satellite, which illustrates both the strip scans and the lack of arctic / antarctic regions.
Now, that particular satellite (TRMM, now retired) has a low inclination, so it samples the tropics better than most. Others sample higher latitudes, but at a cost of less frequent tropic sampling. Polar orbiting satellites will pass over the same area near the poles several times a day, yet (unless inclined like Cryosat to study those regions specifically) do not sample them. Meanwhile, they might pass over a point in the tropics as little as every three days.
Consider also that the Arctic is warming twice as fast as the global average - yet it is often excluded from satellite measurements.
Hopefully you begin to see how limited satellites actually are - they aren't a magic bullet. There's more - this is the company that provides RSS satellite data. You'll notice if you read about their sampling, you'll see little things like this:
Microwave Sounders. These are satellite-borne instruments that measure the radiance of Earth at microwave frequencies, which allows scientists to deduce the temperature of thick atmospheric layers.
Advantages
Global coverage at a high sampling rate
Disadvantages
Coarse vertical resolution
Microwave sounders have good coverage, but not great at separating out temperatures of different layers of the atmosphere - which they do via an algorithm based on their best estimates thus far. You'll also see this:
RSS upper air temperature products are based on measurements made by microwave sounders.
...
RSS air temperature products are assembled from measurements made by the MSU and AMSU instruments on polar orbiting satellites. We are working toward the use of measurements from the most recent microwave sounder, ATMS.
Or this:
All microwave sounding instruments were developed for day to day operational use in weather forecasting and thus are typically not calibrated to the precision needed for climate studies. A climate quality data set can be extracted from their measurements only by careful intercalibration of the data from the MSU, AMSU and ATMS instruments.
Oh, and sometimes you have fun things like decaying orbits:
Anyway, my UAH cohort and boss John Christy, who does the detailed matching between satellites, is pretty convinced that the RSS data is undergoing spurious cooling because RSS is still using the old NOAA-15 satellite which has a decaying orbit, to which they are then applying a diurnal cycle drift correction based upon a climate model, which does not quite match reality. We have not used NOAA-15 for trend information in years…we use the NASA Aqua AMSU, since that satellite carries extra fuel to maintain a precise orbit.
Satellites do not measure the temperature of the Earth like a thermometer. The data is massaged from instruments that aren't meant to do what they do, which are built on platforms that don't measure the entirety of the globe.
Satellite data is crappy data. Its primary advantage is near-global coverage, not accuracy in measurements compared to terrestrial stations and radiosondes.
a reply to: TiredofControlFreaks
Why wouldn't it be important? Because it's only 120 years? Yes that's as far back as consistent human record keeping of temperatures goes. Of course we do also have ice cores and sediment cores that give a pretty good picture of atmospheric temperatures and composition over the last 400,000 but that's just hogwash to deniers who either think it's still not a long enough period to make any kind of evaluations or that scientific means aren't actually capable of pulling data out of 400K ice cores because only God or magic could do that.
The planet doesn't GAF about anything, super hot periods or super cold periods. It doesn't care if there's animal and plant life, no life or microscopic life. It will still be a rocky planet whether it's a snowball or Venus. The humans might care though.
originally posted by: Phage
a reply to: the2ofusr1
The premise of his contest has nothing to do with science. He has published a thousand datasets of 135 data points each.
So, he takes data, and works out a model to fit the data. That is backwards.
The series were generated via trendless statistical models fit for global temperatures.
He made stuff up. And that's his gimmick. He is asking someone to specify which of the datasets contain the made up data. It is all made up data.
Some series then had a trend added to them. Each individual trend averaged 1°C/century—which is greater than the trend claimed for global temperatures. Some trends were positive; others were negative.
He thinks that if no one can tell the difference, it means that AGW is nonsense. He has it backwards because he, like all AGW deniers, claims that the climate models are made to fit the data. Which is false.
The facts are that the models used by climatologists are models of physics. They are not made up statistical models. They do not have arbitrary temperature trends build into them. The fact is that the real world data supports the data produced by those models.
Actually creating models to fit the data is a part of regression analysis and useful in isolating the relationships between dependent and independent variables. It is a standard procedure of analysis for generating models going forward (see power series and maybe review your differential equations),
Regression analysis
en.wikipedia.org...
Your model has to fit the data going backwards and so by its very nature is designed to fit the data set. I don't understand what your beef is with that specific aspect? The method of disproving the data yes, but the idea that you don't try to design a model to fit data is strange to say the least.
Models are made to fit the data, period. Have you every reproduced the simple experiment for calculating G? Take measurements and then develop a model which fits the data. Its going forward that determines the validity of a model.
-FBB
a reply to: Kali74
Ok - I thought that is why the point of 1880 was important but I wanted to hear you say it.
You must admit that it is strange to take today's temperature and compare it to only the 2000s or even going back to 1970s. It just as strange to hear you say that there has been insufficient cooling to return the planet to the last centuries average. These are ALL arbitrary spaces of time with absolutely no meaning.
The question I want answered is this: Is today's current temperature outside the range of variability for this planet's temperature?
What is the "perfect" temperature and what makes it perfect?
Tired of Control Freaks
a reply to: TiredofControlFreaks
What natural causes result in global temperature variability?
The spaces of time are neither arbitrary or without meaning.
As clearly indicated by my last post... there is no perfect temperature range for Earth, nor does it matter for the planet to exist. For anything living, whether in the past and now extinct or current life on Earth, temperature ranges matter a lot.
Global temperature variability is a better term for what we're specifically discussing. Editing.
edit on 11/20/2015 by Kali74 because: (no
reason given)
a reply to: TiredofControlFreaks
Yes, but why? What caused it to be just as hot (which was regional not global) during modern human's existence on Earth? It's also been hotter, much hotter before human's time. Why? Global temperature variability. I asked you what are the natural causes of global temperature variability. Why do I have to answer your questions but you won't answer mine?
Yes, but why? What caused it to be just as hot (which was regional not global) during modern human's existence on Earth? It's also been hotter, much hotter before human's time. Why? Global temperature variability. I asked you what are the natural causes of global temperature variability. Why do I have to answer your questions but you won't answer mine?
edit on 11/20/2015 by Kali74 because: (no reason given)
new topics
-
Don't take advantage of people just because it seems easy it will backfire
Rant: 6 minutes ago -
VirginOfGrand says hello
Introductions: 58 minutes ago -
Should Biden Replace Harris With AOC On the 2024 Democrat Ticket?
2024 Elections: 1 hours ago -
University student disciplined after saying veganism is wrong and gender fluidity is stupid
Education and Media: 4 hours ago -
Geddy Lee in Conversation with Alex Lifeson - My Effin’ Life
People: 5 hours ago -
God lived as a Devil Dog.
Short Stories: 5 hours ago -
Police clash with St George’s Day protesters at central London rally
Social Issues and Civil Unrest: 6 hours ago -
TLDR post about ATS and why I love it and hope we all stay together somewhere
General Chit Chat: 7 hours ago -
Hate makes for strange bedfellows
US Political Madness: 9 hours ago
top topics
-
Hate makes for strange bedfellows
US Political Madness: 9 hours ago, 18 flags -
Who guards the guards
US Political Madness: 12 hours ago, 13 flags -
Police clash with St George’s Day protesters at central London rally
Social Issues and Civil Unrest: 6 hours ago, 8 flags -
TLDR post about ATS and why I love it and hope we all stay together somewhere
General Chit Chat: 7 hours ago, 6 flags -
University student disciplined after saying veganism is wrong and gender fluidity is stupid
Education and Media: 4 hours ago, 5 flags -
Should Biden Replace Harris With AOC On the 2024 Democrat Ticket?
2024 Elections: 1 hours ago, 4 flags -
Has Tesla manipulated data logs to cover up auto pilot crash?
Automotive Discussion: 14 hours ago, 2 flags -
Geddy Lee in Conversation with Alex Lifeson - My Effin’ Life
People: 5 hours ago, 2 flags -
God lived as a Devil Dog.
Short Stories: 5 hours ago, 2 flags -
VirginOfGrand says hello
Introductions: 58 minutes ago, 0 flags
active topics
-
Should Biden Replace Harris With AOC On the 2024 Democrat Ticket?
2024 Elections • 20 • : YourFaceAgain -
Why did Phizer team with nanobot maker
Medical Issues & Conspiracies • 18 • : annonentity -
Don't take advantage of people just because it seems easy it will backfire
Rant • 0 • : Shoshanna -
University student disciplined after saying veganism is wrong and gender fluidity is stupid
Education and Media • 16 • : Consvoli -
-@TH3WH17ERABB17- -Q- ---TIME TO SHOW THE WORLD--- -Part- --44--
Dissecting Disinformation • 631 • : cherokeetroy -
Geddy Lee in Conversation with Alex Lifeson - My Effin’ Life
People • 4 • : underpass61 -
Thousands Of Young Ukrainian Men Trying To Flee The Country To Avoid Conscription And The War
Other Current Events • 120 • : Xtrozero -
Terrifying Encounters With The Black Eyed Kids
Paranormal Studies • 68 • : Consvoli -
Gold and silver prices....woo hoo
History • 82 • : worldstarcountry -
Are you ready for the return of Jesus Christ? Have you been cleansed by His blood?
Religion, Faith, And Theology • 27 • : DiscipleOfChrist33