It looks like you're using an Ad Blocker.
Please white-list or disable AboveTopSecret.com in your ad-blocking tool.
Thank you.
Some features of ATS will be disabled while you continue to use an ad-blocker.

Permafrost warming in parts of Alaska is 'unbelievable'
page: 3share:
a reply to: TiredofControlFreaks
Hey, if you think you can do better, go right ahead.
Make some projections.
Hey, if you think you can do better, go right ahead.
Make some projections.
a reply to: Greven
No I absolutely refuse to try to predict the future! I am pretty adamant that no one - not even the "genuine" gypsy selling palm readings down the street from your house can predict the future.
Think about this very carefully. The IPPC projects made in the 1990s were wrong about what the temperature would be in 2015. That is a period of only 25 years. Yet you want to me to believe that they can predict the climate in 100 and 200 years.
How wrong do they have to be before they admit that they just don't know what they don't know!
So you think you have some kind of point here? That if someone else doesn't try to predict the future, we should just accept that the organization that couldn't predict 25 years can predict 100 years into the future? That is just dumb!
Tired of Control Freaks
a reply to: Greven
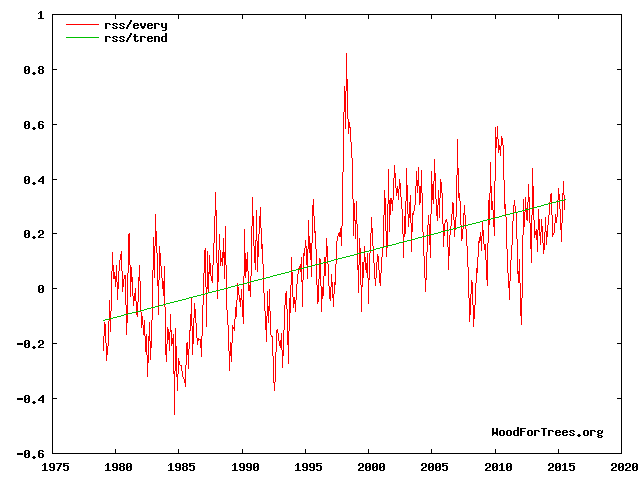
What the IPPC predictions failed to show was the by now almost 18 year "pause" in warming. That is, there has been no significant warming at all. Despite an increase in CO2, no warming for 18 years and 8 months! And no explanation for it. (actually there are at least 52 explanations, all different and many of them already debunked.
The fact is the "climatologist" who want to take centre stage for valuable resource dollars and attention, simply do not understand as much as they claim to. MOre and more forcings are being discovered every year.
Tired of Controls Freaks
originally posted by: AK907ICECOLD
a reply to: InnerPeace2012
It's rather cold, then warm.... But the temps go up and down. I have lived here for 30 years, nothing in weather patterns concerns me.
I'll be dead by then anyhow
Where you at on this Shred?
lol, I just want to go snowboarding this winter
ETA: In all seriousness, I'm not worried about it, but having lived here a good fifteen years, these past two have certainly been the warmest. As I recall things anyway.
If I dont ride this winter, my brain will implode, maybe i'll just go surfing outta Seward more often. Avoid brain implosion.
edit on
23-10-2015 by GoShredAK because: (no reason given)
a reply to: TiredofControlFreaks
Again, what were the temperature predictions for 2015?
Further, how do you arrive at the idea of there being a pause for 18 years and 8 months?
Per GISTEMP, annual average (new/tied records in subsequent years are italicized:
1979: +0.12 °C
1980: +0.22 °C
1981: +0.28 °C
1982: +0.08 °C
1983: +0.27 °C
1984: +0.12 °C
1985: +0.08 °C
1986: +0.14 °C
1987: +0.28 °C
1988: +0.35 °C
1989: +0.24 °C
1990: +0.39 °C
1991: +0.37 °C
1992: +0.18 °C
1993: +0.20 °C
1994: +0.28 °C
1995: +0.42 °C
1996: +0.32 °C
1997: +0.45 °C
1998: +0.61 °C
1999: +0.40 °C
2000: +0.40 °C
2001: +0.52 °C
2002: +0.61 °C
2003: +0.60 °C
2004: +0.51 °C
2005: +0.65 °C
2006: +0.59 °C
2007: +0.62 °C
2008: +0.49 °C
2009: +0.59 °C
2010: +0.66 °C
2011: +0.54 °C
2012: +0.57 °C
2013: +0.59 °C
New records wouldn't happen if it weren't getting warmer, now would they?
edit on 21Fri, 23 Oct 2015 21:07:37
-0500America/ChicagovAmerica/Chicago10 by Greven because: (no reason given)
I am curious of the localized water temp variations over time. I really suspect the waters have warmed.
edit on 23-10-2015 by smirkley because:
I hate posting on my phone lol... sp not my fault
a reply to: Greven
No significant increase is a mathematical term. Its doesn't mean that there has been no increase. It means that the increase is of no sigificant difference from the average.
BTW - do you know the story in Climategate where Manfred Mann sent an email to Hadley about using a "trick" to "hide the decline"?
Tired of Control Freaks
a reply to: TiredofControlFreaks
Yes, it is. Do you know what the significance is for the GISTEMP record?
2σ = ±0.57 °C
Go have a look as to how many years are above that.
No, I do not know that email... because Mann didn't send any such email. You're thinking of someone else - others have made this mistake on this very board.
e: since I don't want to bore you or anyone else with the continual request for a citation in that thread, here's where I gave up and pointed out how he was wrong.
edit on 22Fri,
23 Oct 2015 22:16:42 -0500America/ChicagovAmerica/Chicago10 by Greven because: (no reason given)
originally posted by: mbkennel
The computer models of IPPC have all been wrong to date but I am supposed to believe that they got it just for something like a century from now?
The models haven't been that wrong, and they've been better than anybody else's half-assed guess or unsupported assertion.
Really?
a reply to: TiredofControlFreaks
His 'trick' is this:
The 'climate gate' investigation went nowhere for good reasons. There wasn't anything nefarious about it.
His 'trick' is this:
The most common misconception regarding this email is to assume 'hide the decline' refers to declining temperatures.
...
The 'decline' actually refers to a decline in tree-ring growth in certian high-latitude regions since the 1960s. This is known as the 'divergence problem,' where some tree-ring proxies diverge from modern instrumental temperature records after 1960. This was discussed in the peer-reviewed literature as early as 1995, suggesting a change in sensitivity of tree growth to temperature in recent decades (Jacoby and D'Arrigo, 1995). When you look at Jones's email in the context of the science discussed, it is not the scheming of a climate conspiracy, but technical discussions of data-handling techniques readily available in the peer-reviewed literature.
The 'climate gate' investigation went nowhere for good reasons. There wasn't anything nefarious about it.
edit on 23Fri, 23 Oct 2015 23:31:54
-0500America/ChicagovAmerica/Chicago10 by Greven because: had to use tinyurl since the direct link is being eaten by the forums
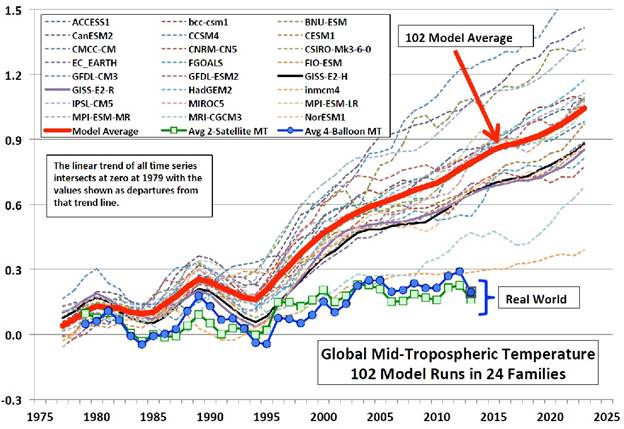
a reply to: Teikiatsu
So, what is your source for this graph?
I'm curious as to what their definition for 'real world' is, when above on this very page, there is a trend from (a low) of 1979: +0.12 °C to (a high) 2010: +0.66 °C
2010 appears to be far and away higher than the 'real world' labels on your graph (e: as illustrated below, 1979-2013 GISTEMP).
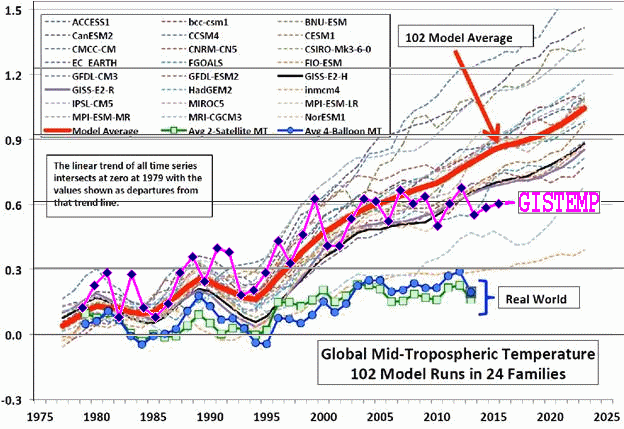
Wait, let me guess... those are UAH and RSS satellites, aren't they?
So, what is your source for this graph?
I'm curious as to what their definition for 'real world' is, when above on this very page, there is a trend from (a low) of 1979: +0.12 °C to (a high) 2010: +0.66 °C
2010 appears to be far and away higher than the 'real world' labels on your graph (e: as illustrated below, 1979-2013 GISTEMP).
Wait, let me guess... those are UAH and RSS satellites, aren't they?
edit on 23Fri, 23 Oct 2015 23:27:43 -0500America/ChicagovAmerica/Chicago10 by Greven because: (no reason given)
My guess is that someone was just on excel class and discovered how easy is to build graphs...
Data behind weather is no secret, you can access it freely... yet somehow it does not match that 'real world' pattern from
Teikiatsu's post...
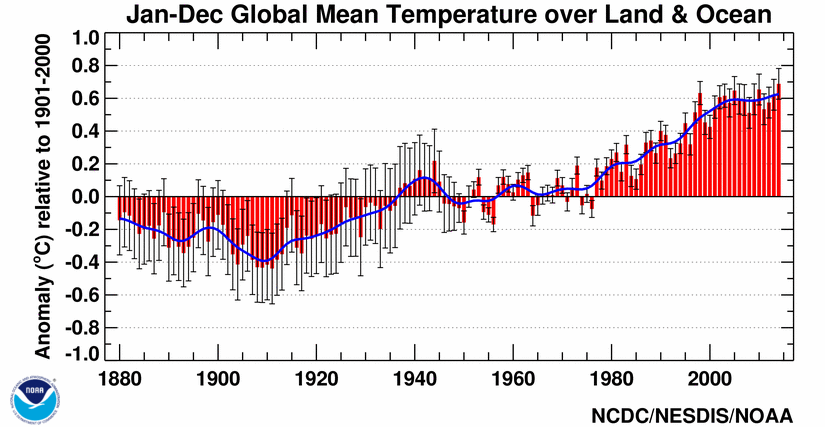
Source: www2.ucar.edu...
Data behind weather is no secret, you can access it freely... yet somehow it does not match that 'real world' pattern from
Teikiatsu's post...
Source: www2.ucar.edu...
edit on 24-10-2015 by SuperFrog because: (no
reason given)
a reply to: SuperFrog
Let us know when something of value and with indisputable proof of how everything works is provided.
Anyone with half a brain and no skewed thinking can see less than 30% of variables are known in mainstream science.
Never mind programmed into the flawed tired models.
Scientists have been rendered into reporters, they find only what they are told to look for, and trumpet and cheer for this stupidity, exactly like the religions you flame.
I enjoy seeing those of you try desperately to convince others that you actually know an iota of the causes for anything, it reminds me of those Jehovah's Witnesses knocking on the door.
a reply to: Greven
Still a problem. What happened to the 1998 el nino event? It doesn't seem to have happened in the "real world" data shown in that graph.
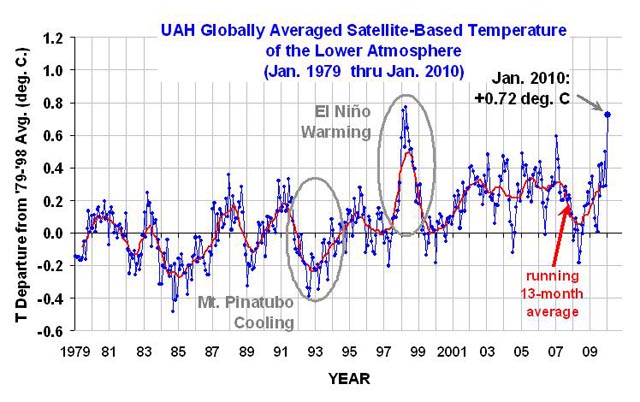
www.wunderground.com...
Wait, let me guess... those are UAH and RSS satellites, aren't they?
Still a problem. What happened to the 1998 el nino event? It doesn't seem to have happened in the "real world" data shown in that graph.
www.wunderground.com...
edit on 10/24/2015 by Phage because: (no reason given)
You guys can bust out all the facts and data you want, but there's always going to be people out there who simply can't interpret data, don't
understand trends, and can't form logical conclusions from their data analysis.
There's always going to be a difference between people who make up stories in their head and use that as their way of interpreting the world and those who learn through experiences from the environment surrounding them. The first group are what we call "stupid". They will always touch the burning hot oven rack twice just to double check that it is in fact burning hot. The second group avoids third degree burns. If we didn't have social welfare the first group would have been bred out of existence long ago.
There's always going to be a difference between people who make up stories in their head and use that as their way of interpreting the world and those who learn through experiences from the environment surrounding them. The first group are what we call "stupid". They will always touch the burning hot oven rack twice just to double check that it is in fact burning hot. The second group avoids third degree burns. If we didn't have social welfare the first group would have been bred out of existence long ago.
edit on 24-10-2015 by BrokedownChevy because: Typo
originally posted by: BrokedownChevy
You guys can bust out all the facts and data you want, but there's always going to be people out there who simply can't interpret data, don't understand trends, and can't form logical conclusions from their data analysis.
There's always going to be a difference between people who make up stories in their head and use that as their way of interpreting the world and those who learn through experiences from the environment surrounding them. The first group are what we call "stupid". They will always touch the burning hot oven rack twice just to double check that it is in fact burning hot. The second group avoids third degree burns. If we didn't have social welfare the first group would have been bred out of existence long ago.
There will always be groups of people that change data to fit their agenda. Where are any documents proving chain-of-custody verification for any numbers from sensor to chart? It's required in the nuclear industry for every nut, bolt and light bulb. Why not for something this so-called important?
new topics
-
The Baloney aka BS Detection Kit
Social Issues and Civil Unrest: 4 hours ago -
Suspected Iranian agent working for Pentagon while U.S. coordinated defense of Israel
US Political Madness: 4 hours ago -
How does my computer know
Education and Media: 7 hours ago -
USO 10 miles west of caladesi island, Clearwater beach Florida
Aliens and UFOs: 11 hours ago
top topics
-
USO 10 miles west of caladesi island, Clearwater beach Florida
Aliens and UFOs: 11 hours ago, 8 flags -
Suspected Iranian agent working for Pentagon while U.S. coordinated defense of Israel
US Political Madness: 4 hours ago, 5 flags -
How does my computer know
Education and Media: 7 hours ago, 2 flags -
The Baloney aka BS Detection Kit
Social Issues and Civil Unrest: 4 hours ago, 2 flags
active topics
-
The Baloney aka BS Detection Kit
Social Issues and Civil Unrest • 4 • : YourFaceAgain -
Spy Music
Music • 41 • : underpass61 -
Running Through Idiot Protestors Who Block The Road
Rant • 49 • : YourFaceAgain -
How does my computer know
Education and Media • 12 • : mysterioustranger -
Candidate TRUMP Now Has Crazy Judge JUAN MERCHAN After Him - The Stormy Daniels Hush-Money Case.
Political Conspiracies • 193 • : Vermilion -
Gold and silver prices....woo hoo
History • 73 • : mysterioustranger -
-@TH3WH17ERABB17- -Q- ---TIME TO SHOW THE WORLD--- -Part- --44--
Dissecting Disinformation • 475 • : fringeofthefringe -
White clots found in 20% of dead bodies after covid vaccine
Medical Issues & Conspiracies • 41 • : Kurokage -
Nakedeye Mother of Dragons Comet Is Here!
Space Exploration • 3 • : SchrodingersRat -
US and Israel Reportedly Conclude Most Hostages Still Held in Gaza Are Dead
War On Terrorism • 146 • : Ohanka