It looks like you're using an Ad Blocker.
Please white-list or disable AboveTopSecret.com in your ad-blocking tool.
Thank you.
Some features of ATS will be disabled while you continue to use an ad-blocker.

7 Climate Records Broken in 2014 Indicates Earth Is ‘Gravely Ill’
page: 1share:
The Earth is "gravely ill" according to the NOAA:
“Most of the dozens of essential climate variables monitored each year in this report continued to follow their long-term trends in 2014, with several setting new records,” the report said.
A lot of the 292-page study is highly technical as it incorporates the work of more than 400 scientists analyzing everything from temperatures to precipitation to extreme weather events to ice melt all over the world. But one of the main conclusions of the report is how much things are changing and how quickly.
Perhaps Jeff Severinghaus of the Scripps Institution of Oceanography provides the best takeaway from the report, saying, if this is Earth’s annual checkup, “the doctor is saying ‘you are gravely ill.'”
Uh-oh! It seems that we are too late to stem the tide of this Climate Change wave. The boulder has gotten too big and is now moving too fast to stop it. Understandably, this has happened before in Earth's history and will happen again but it appears that Man is accelerating his own doom. Can we slow it down at this point? I don't know but one thing I do know is: it's mighty peculiar that in recent years NASA is ramping up its efforts after what seemed like a real lull in traveling to the Stars and exploration. Think there's something they're not telling us? I do. What says ATS?
ecowatch.com...
“Most of the dozens of essential climate variables monitored each year in this report continued to follow their long-term trends in 2014, with several setting new records,” the report said.
A lot of the 292-page study is highly technical as it incorporates the work of more than 400 scientists analyzing everything from temperatures to precipitation to extreme weather events to ice melt all over the world. But one of the main conclusions of the report is how much things are changing and how quickly.
Perhaps Jeff Severinghaus of the Scripps Institution of Oceanography provides the best takeaway from the report, saying, if this is Earth’s annual checkup, “the doctor is saying ‘you are gravely ill.'”
1. Hottest Year: Records for the hottest temperature were set around the world with the highest average global surface temperature since record-keeping began, according to four separate analyses. Records were shattered everywhere. Europe and Mexico had their warmest years ever, while Argentina and Uruguay had their second hottest years and Australia its third warmest after enduring all-time record heat in 2013. Africa and Asia also had above-average temperatures.
warm year
The following table lists the global combined land and ocean annually-averaged temperature rank and anomaly for each of the 10 warmest years on record. Chart credit: NOAA
“Warmer-than-average conditions were present across much of the world’s land and ocean surfaces during 2014,” the report said. “These contributed to a global average temperature that was the highest or joint highest since records began in the mid-to-late 1800s. Over land surfaces, Eurasia and western North America were particularly warm, while noticeable cold was felt in eastern North America, which suffered several Arctic cold-air outbreaks in early 2014. The frequency of warm extreme temperatures was above average for all regions apart from North America.”
2. Greenhouse Gas Emissions: Driving those temperature increases were all the major heat-trapping greenhouse gases, including carbon dioxide, methane and nitrous oxide, which reported record high atmospheric concentrations. Carbon levels at Mauna Loa stayed above 400 ppm from April through June, and globally the average was 397.2ppm. Methane concentrations rose as well, with an increase that’s bigger than the average annual increase of the past decade.
3. Sea Surface Temperature: The average sea surface temperature globally was the highest on record, with especially warm temperatures in the western Atlantic and central and northeast Pacific. While this didn’t drive an El Niño event in 2014, scientists expect one to arrive in 2015.
4. Ocean Temperature: The heat content of the ocean’s waters also set a record, reflecting the fact that the oceans absorb more than 90 percent of the heat trapped in the Earth’s atmosphere by greenhouse gases. As greenhouse gases rise, therefore, so do ocean temperatures.
Ocean heat content each year since 1993 compared to the 1993-2013 average (dashed line) from a variety of data sources. Exact estimates differ among data sets, but they all show the same upward trend. Graph adapted from Figure 3.7 in State of the Climate in 2014.
Ocean heat content each year since 1993 compared to the 1993-2013 average (dashed line) from a variety of data sources. Exact estimates differ among data sets, but they all show the same upward trend. Graph adapted from Figure 3.7 in State of the Climate in 2014.
5. Sea Level Rise: Sea levels are setting records too. Sea levels are now about 67 millimeters, or about 2.6 inches, higher than they were in 1993. Factors contribution to this rise include the melting of glaciers and other sea ice, the fact that water expands as it warms and melting land ice flowing out to sea.
Global sea level each year since 1993 compared to the 1993* average (dashed line). Graph adapted from Plate 1.1x in State of the Climate in 2014. Image credit: NOAA's State of the Climate report
(Click to enlarge) Global sea level each year since 1993 compared to the 1993 average (dashed line). Graph adapted from Plate 1.1x in State of the Climate in 2014.
6. Greenland Ice Melt: The Greenland ice sheet was above average in its rate for melt for 90 percent of the regular melt season. It hit a record low for August in how much of the sun’s energy is reflected off its surface. Melting darkens the ice sheet’s surface, making it less able to reflect the sun’s energy.
a) Map of Greenland Ice Sheet surface albedo for summer (June to August) 2014, relative to the summer average 2000-2011, b) Average surface albedo of the whole ice sheet each summer since 2000, and c) Average surface albedo of the ice sheet each August since 2000. Image courtesy: American Meteorological Society
a) Map of Greenland Ice Sheet surface albedo for summer (June to August) 2014, relative to the summer average 2000-2011, b) Average surface albedo of the whole ice sheet each summer since 2000, and c) Average surface albedo of the ice sheet each August since 2000. Image courtesy: American Meteorological Society
7. Antarctic Ice Melt: Antarctic sea ice set a different record—for highest sea ice extent, which has broken records three years running. One possible reason for that is changing wind patterns, scientists say. Without land to block it as in the Arctic, ice near land blows out to sea, exposing open water, which then freezes. While it might sound counterintuitive to the idea of a warming planet, it’s indicative of potentially climate change-driven atmospheric shifts.
Uh-oh! It seems that we are too late to stem the tide of this Climate Change wave. The boulder has gotten too big and is now moving too fast to stop it. Understandably, this has happened before in Earth's history and will happen again but it appears that Man is accelerating his own doom. Can we slow it down at this point? I don't know but one thing I do know is: it's mighty peculiar that in recent years NASA is ramping up its efforts after what seemed like a real lull in traveling to the Stars and exploration. Think there's something they're not telling us? I do. What says ATS?
ecowatch.com...
The earth is just fine.....she is just preparing herself for a cleansing of a virus that has overtaken her....we are the ones who should be worrying
originally posted by: alienjuggalo
a reply to: lostbook
Yeah but how long have records been kept? So what do they really know?
I'm pretty sure that Geologists have ways of measuring the Earth's temperature at differing times in its history.
originally posted by: lostbook
originally posted by: alienjuggalo
a reply to: lostbook
Yeah but how long have records been kept? So what do they really know?
I'm pretty sure that Geologists have ways of measuring the Earth's temperature at differing times in its history.
They certainly think they do, and some of them do it better than others. With reference to climate theory one of the ways to measure past temperatures is to use a "proxy." The idea is to find something in modern times that you can correlate with the past--like tree ring data, for example. If tree rings grow in a certain manner at a certain temperature in the present, then you can theoretically determine the temperatures in the past by examining tree rings of old trees. It's a complex business, but tree rings are like fingerprints, and you can go back thousands of years this way.
Seems completely scientific and rock-solid, right? After all, these PhDs are really smart, and if they say something and you don't believe it, that just shows your ignorance. But remember Climategate? This involves several thousand emails that got loose and showed these PhDs talking about their data. There's tons of data here and most of it is mundane, but there are also some troubling ones, including a long missive by the programmer who put together the data sets telling everyone how poor they were. But they don't just show screw-ups; they show intentional fraud. These really smart PhDs were not getting the "right" data to prove their theories of climate change, so rather than come out and admit they had a problem, they cooked the data. Like this:
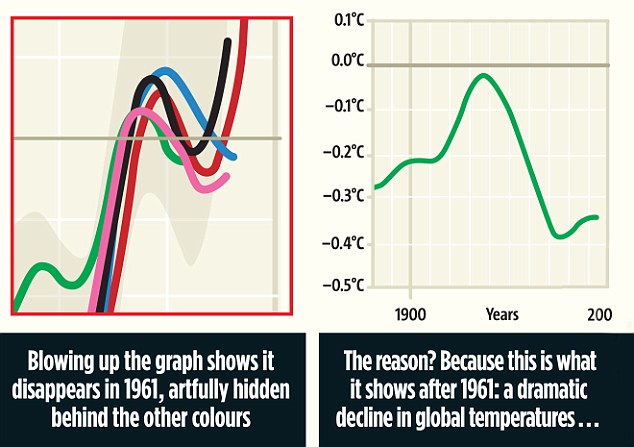
See that green line? As temperature is headed down, the green line follows suit, but when the temperature is headed up, the green line fails to make it out of the trough. That's because the green line CONTINUED TO GO DOWN while everything else went up. Now those lines that went up were from really accurate contemporary measuring devices like thermometers. There's no doubt that temperatures really were rising during the period of this graph. So what's the problem?
The green line is TREE RING DATA. And THIS is the data that was used as a "proxy" to measure temperatures in the distant past. But if tree ring data obviously doesn't know the real temperature in the present, how can you say it knew what the temperatures were in the past? ESPECIALLY since THIS is the data they used to "prove" temperature has been rising?
Well, these guys are not stupid. They knew full well what all this meant, so what did they do?
They "hid the decline" and then bragged about it in their emails. It's a vivid smoking gun that has NEVER been adequately explained.
Now it may very well be that temperature is rising. But there is no doubt we are being defrauded with some of the evidence, of which this is a glaring example and not the only one. How can anyone look at this evidence and proclaim the scientists are telling us the truth? They have an agenda, and when the data doesn't fit, they MAKE it fit.
Now, as far as rising temperatures "making the earth ill," that's preposterous. Dinosaurs rather liked the warm temperatures. That oil in northern Alaska didn't get there through snowfall and permafrost. The Earth has been hotter in the past than it is today. And when it was hotter and when the CO2 level was higher, plants grew larger. We had 60 foot bracken fern forests. CO2 is plant food. It helps plants grow.
And that's not a bad thing. It's just different. And the fact is we may have to change. But let us not use this change as an excuse for more totalitarian government control, because that's the hidden agenda here.
edit on 7/17/2015 by schuyler because: (no reason given)
The truth is we have no idea what we are talking about in this arena. Our data has not been recorded long enough for us to make these statements.
Based on my resources it is normal for the earth to cycle like this. as far as the co2 damaging our ozone we have had higher co2 in the past after a
meteor strike. Do your homework
a reply to: schuyler
You need to have sources of data to back up those graphs. Until you do so, you have provided dis-information as far as myself or any other 'free' thinker. However that said, there are many who will blindly look at your post and insist that AGW is nothing but a hoax to raise taxes.
You cry AGW is "an excuse for more totalitarian government control." Are you serious?
Do you understand that big oil interests buy our elected officials?
a reply to: schuyler
It has been explained and debunked hundreds of times on these boards and I know ou have taken part in some of those threads.
I will not go into it in depth again, but you can learn about it here. Clearing up misconceptions regarding 'hide the decline'
The thing that caught my attention is that you seem to think past climate is solely measured from tree ring samples from one local and you couldn't be any more missinformed.
They use many methods to determine past climate. Ice cores, Fossil pollen, Lake sediments, Ocean sediment cores, and tree ring width are a few methods.
There is an entire scientific field that is dedicated to the study of past climates and it is called Paleoclimatology. If you plan to argue against the findings from those in that field you should at the very least learn what it entails.
The green line is TREE RING DATA. And THIS is the data that was used as a "proxy" to measure temperatures in the distant past. But if tree ring data obviously doesn't know the real temperature in the present, how can you say it knew what the temperatures were in the past? ESPECIALLY since THIS is the data they used to "prove" temperature has been rising?
Well, these guys are not stupid. They knew full well what all this meant, so what did they do?
They "hid the decline" and then bragged about it in their emails. It's a vivid smoking gun that has NEVER been adequately explained.
It has been explained and debunked hundreds of times on these boards and I know ou have taken part in some of those threads.
I will not go into it in depth again, but you can learn about it here. Clearing up misconceptions regarding 'hide the decline'
The thing that caught my attention is that you seem to think past climate is solely measured from tree ring samples from one local and you couldn't be any more missinformed.
They use many methods to determine past climate. Ice cores, Fossil pollen, Lake sediments, Ocean sediment cores, and tree ring width are a few methods.
There is an entire scientific field that is dedicated to the study of past climates and it is called Paleoclimatology. If you plan to argue against the findings from those in that field you should at the very least learn what it entails.
originally posted by: Grimpachi
a reply to: schuyler
The green line is TREE RING DATA. And THIS is the data that was used as a "proxy" to measure temperatures in the distant past. But if tree ring data obviously doesn't know the real temperature in the present, how can you say it knew what the temperatures were in the past? ESPECIALLY since THIS is the data they used to "prove" temperature has been rising?
Well, these guys are not stupid. They knew full well what all this meant, so what did they do?
They "hid the decline" and then bragged about it in their emails. It's a vivid smoking gun that has NEVER been adequately explained.
It has been explained and debunked hundreds of times on these boards and I know ou have taken part in some of those threads.
I will not go into it in depth again, but you can learn about it here. Clearing up misconceptions regarding 'hide the decline'
The thing that caught my attention is that you seem to think past climate is solely measured from tree ring samples from one local and you couldn't be any more missinformed.
They use many methods to determine past climate. Ice cores, Fossil pollen, Lake sediments, Ocean sediment cores, and tree ring width are a few methods.
There is an entire scientific field that is dedicated to the study of past climates and it is called Paleoclimatology. If you plan to argue against the findings from those in that field you should at the very least learn what it entails.
Thanks for that, Grimpachi.
NOAA? You mean the NOAA that tampers with data?
See Here, And here.
Looks like NASA is in on it too.
Speaking of NASA, what did they find on Carbon Dioxide? Hmm lets see here
Now, I'm sure that many dis-info agents will poke at these sources, but a nice little Google search provides many more, and these were picked at random. And remember, everybody's favorite science guy is a part of the Committee for Skeptical Inquiry, yet wants to call out deniers. That alone should make you question the motives.
edit on 18-7-2015 by Wardaddy454 because: (no reason given)
originally posted by: schuyler
originally posted by: lostbook
originally posted by: alienjuggalo
a reply to: lostbook
Yeah but how long have records been kept? So what do they really know?
I'm pretty sure that Geologists have ways of measuring the Earth's temperature at differing times in its history.
And that's not a bad thing. It's just different. And the fact is we may have to change. But let us not use this change as an excuse for more totalitarian government control, because that's the hidden agenda here.
There's no hidden agenda...the only agenda is the survival of the human race.
originally posted by: JohnCruz
The truth is we have no idea what we are talking about in this arena. Our data has not been recorded long enough for us to make these statements. Based on my resources it is normal for the earth to cycle like this. as far as the co2 damaging our ozone we have had higher co2 in the past after a meteor strike. Do your homework
I think it is you that needs to do some homework. And what "resources" are you basing your assumptions on? One thing you fail to consider is that humans weren't here for past cycles or "meteor strikes" and we are now, so what will the effects be on us? Do some homework and then come back and share with us, please.
As far as NASA asleep at the wheel & now reacting with a renewed passion...
many of the NASA projects were launched during the "lull'" you pointed out...
it has taken years of travel for the missions to engage the targeted explorations
I think your NASA conspiracy idea is like the climate change itself... oodles of "hot air"...nothing to see...move along
many of the NASA projects were launched during the "lull'" you pointed out...
it has taken years of travel for the missions to engage the targeted explorations
I think your NASA conspiracy idea is like the climate change itself... oodles of "hot air"...nothing to see...move along
new topics
-
Any one suspicious of fever promotions events, major investor Goldman Sachs card only.
The Gray Area: 1 hours ago -
God's Righteousness is Greater than Our Wrath
Religion, Faith, And Theology: 6 hours ago -
Electrical tricks for saving money
Education and Media: 9 hours ago -
VP's Secret Service agent brawls with other agents at Andrews
Mainstream News: 10 hours ago -
Sunak spinning the sickness figures
Other Current Events: 11 hours ago -
Nearly 70% Of Americans Want Talks To End War In Ukraine
Political Issues: 11 hours ago
top topics
-
VP's Secret Service agent brawls with other agents at Andrews
Mainstream News: 10 hours ago, 9 flags -
Cats Used as Live Bait to Train Ferocious Pitbulls in Illegal NYC Dogfighting
Social Issues and Civil Unrest: 14 hours ago, 8 flags -
Electrical tricks for saving money
Education and Media: 9 hours ago, 4 flags -
Nearly 70% Of Americans Want Talks To End War In Ukraine
Political Issues: 11 hours ago, 3 flags -
Sunak spinning the sickness figures
Other Current Events: 11 hours ago, 3 flags -
Late Night with the Devil - a really good unusual modern horror film.
Movies: 13 hours ago, 2 flags -
Any one suspicious of fever promotions events, major investor Goldman Sachs card only.
The Gray Area: 1 hours ago, 2 flags -
The Good News According to Jesus - Episode 1
Religion, Faith, And Theology: 16 hours ago, 1 flags -
God's Righteousness is Greater than Our Wrath
Religion, Faith, And Theology: 6 hours ago, 0 flags
active topics
-
Definitive 9.11 Pentagon EVIDENCE.
9/11 Conspiracies • 423 • : Lazy88 -
God's Righteousness is Greater than Our Wrath
Religion, Faith, And Theology • 11 • : andy06shake -
SETI chief says US has no evidence for alien technology. 'And we never have'
Aliens and UFOs • 60 • : Scratchpost -
Election Year 2024 - Interesting Election-Related Tidbits as They Happen.
2024 Elections • 73 • : Threadbarer -
Sunak spinning the sickness figures
Other Current Events • 8 • : McUrnsalso -
-@TH3WH17ERABB17- -Q- ---TIME TO SHOW THE WORLD--- -Part- --44--
Dissecting Disinformation • 661 • : Justoneman -
HORRIBLE !! Russian Soldier Drinking Own Urine To Survive In Battle
World War Three • 36 • : TheMisguidedAngel -
British TV Presenter Refuses To Use Guest's Preferred Pronouns
Education and Media • 146 • : Consvoli -
Nearly 70% Of Americans Want Talks To End War In Ukraine
Political Issues • 19 • : Consvoli -
Terrifying Encounters With The Black Eyed Kids
Paranormal Studies • 76 • : Consvoli