It looks like you're using an Ad Blocker.
Please white-list or disable AboveTopSecret.com in your ad-blocking tool.
Thank you.
Some features of ATS will be disabled while you continue to use an ad-blocker.

"Weird Winter Weather Plot Thickens as Arctic Swiftly Warms"
page: 6share:
a reply to: ElectricUniverse
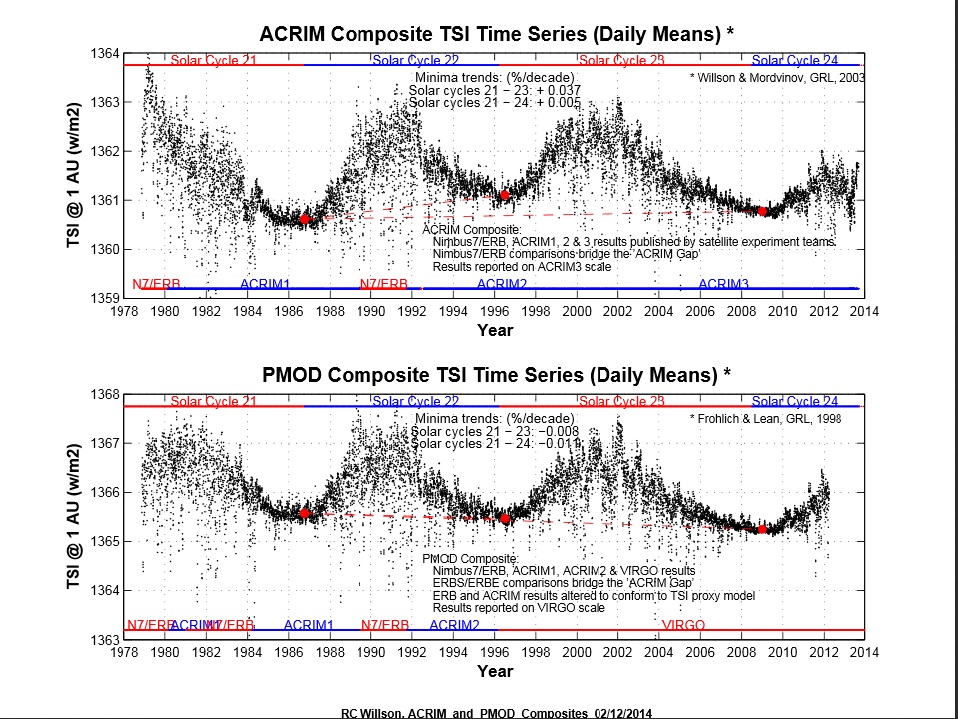
I believe this graph is meant to accompany the latest paper on TSI reconstruction which finds that ACRIM showed a slight warming trend whereas PMOD shows a slight cooling trend. The 2003 paper is outdated.
I believe this graph is meant to accompany the latest paper on TSI reconstruction which finds that ACRIM showed a slight warming trend whereas PMOD shows a slight cooling trend. The 2003 paper is outdated.
a reply to: kosmicjack
It really has been another crazy winter. Right now should we should be in one of our major cold snaps of the year, I'm talking -20 to -30f below zero. Instead it was about 42 above. We have seen more rain than snow this year. These weather patterns are screwing with my gardens. I was outside yesterday and I have new growth on my raspberry canes and a Maltese cross who's an inch tall already. I'm in south central Alaska, and this shouldn't be happening before the end of April. My sister lives in Fairbanks and it's been the similar up there in the weather patterns. She saw someone cruising around with the top down on their car at the end of January, beginning of February. The lower 48 quite literally got our winter this year.
Seeing the consistency of the pattern, something has drastically changed. These past two years have been so much more drastic than a typical winter warm up. I have to say to it really is a strange thing to get up to an above freezing day in February to read about blizzards in the Middle East, not to mention the severity of what the south has seen again. On one hand, it's been very nice to not deal with the typical -30f snap we have every year. On the other, it really is getting to the point that our flora has been thoroughly confused after two crazy seasons.
originally posted by: Kali74
a reply to: ElectricUniverse
I believe this graph is meant to accompany the latest paper on TSI reconstruction which finds that ACRIM showed a slight warming trend whereas PMOD shows a slight cooling trend. The 2003 paper is outdated.
Really? So, you didn't notice the graphs I gave showing both differences between the ACRIM composite and the PMOD Composite which was published in 2014?... But of course, you have to claim it is outdated. Care to show a link to where you got your graph from? Not to mention that like always you also ignored completely the evidence I presented which corroborates my argument and refutes yours.
All you did was post a graph without any reference link that would show us from where you got that graph.
BTW... The "slight warming trend" as you are calling it is higher than the trend that NASA says would be needed to cause extreme changes in climate if such changes occur per CENTURY...
Again, here is the trend in changes of irradiance per century that NASA says can cause the complete range of climate variations, ranging from ice ages, to global tropical conditions...
...
Systematic changes in irradiance as little as 0.25% per century can cause the complete range of climate variations that have occurred in the past, ranging from ice ages to global tropical conditions. For example, scientists believe the "Little Ice Age" that occured in Europe in the late 17th century could have been related to the minimum in sunspot activity (and a correlated minimum in total solar irradiance) that occured during the same period.
earthobservatory.nasa.gov...
According to the overall research and the evidence from the ACRIM composite from solar cycle 21 to solar cycle 23 (from around 1987 until about 2009) the TSI trend has been increasing 0.037% PER DECADE (not century, but DECADE). Although in solar cycle 24 the trend in TSI has slowed, from solar cycle 21 to solar cycle 24 the TSI trend has also been positive by 0.005% per DECADE as per the research posted in 2014.
acrim.com...
edit on 23-2-2015 by ElectricUniverse because: add comment and evidence.
originally posted by: ElectricUniverse
Below i will show what the evidence says on how TSI trend had been increasing, then we can form an opinion on whether or not these changes could have caused the "climate change" we have been seeing.
Additionally, confirmation of increased solar output as driving climate change today also requires observations such as
a) equatorial regions warming more than poles
b) daytime warming more than nighttime
as these are correlated with direct optical solar input. The observed pattern is the reverse, consistent with increased greenhouse effect.
a reply to: ElectricUniverse
I didn't post a graph, I'm talking about the one you posted in the post I replied to and then again just now. ACRIM shows slight warming PMOD shows slight cooling. It seems that it's you ignoring evidence. Yes, NASA is talking about per century and we're monitoring warming and climate change on a decadal scale. According to PMOD which is considered to be the most accurate TSI reconstruction, Earth is down from the 1978 peak. TSI did climb up again in 1989 but is still much lower than 1978 and still as of yet has hit it's former peaks. Now, even if we are dealing with a steady .005% increase in TSI... over 100 years that amounts to a .05% increase overall. Much, much... much smaller than the .25% NASA estimation of disaster.
I didn't post a graph, I'm talking about the one you posted in the post I replied to and then again just now. ACRIM shows slight warming PMOD shows slight cooling. It seems that it's you ignoring evidence. Yes, NASA is talking about per century and we're monitoring warming and climate change on a decadal scale. According to PMOD which is considered to be the most accurate TSI reconstruction, Earth is down from the 1978 peak. TSI did climb up again in 1989 but is still much lower than 1978 and still as of yet has hit it's former peaks. Now, even if we are dealing with a steady .005% increase in TSI... over 100 years that amounts to a .05% increase overall. Much, much... much smaller than the .25% NASA estimation of disaster.
originally posted by: ElectricUniverse
originally posted by: Kali74
a reply to: ElectricUniverse
I believe this graph is meant to accompany the latest paper on TSI reconstruction which finds that ACRIM showed a slight warming trend whereas PMOD shows a slight cooling trend. The 2003 paper is outdated.
Really? So, you didn't notice the graphs I gave showing both differences between the ACRIM composite and the PMOD Composite which was published in 2014?... But of course, you have to claim it is outdated. Care to show a link to where you got your graph from? Not to mention that like always you also ignored completely the evidence I presented which corroborates my argument and refutes yours.
All you did was post a graph without any reference link that would show us from where you got that graph.
BTW... The "slight warming trend" as you are calling it is higher than the trend that NASA says would be needed to cause extreme changes in climate if such changes occur per CENTURY...
NASA : 0.25% per century is significant climatically.
TSI: 0.005% per decade, or if extrapolated completely for a century (which is far from certain), 0.05% in a century.
0.05% is 1/20th of 0.25%.
0.25% change in total forcing, 0.25% * 1366 = 3.415 W/m^2, is very likely to be achieved through human greenhouse forcing.
Total current anthrpogenic forcing (which includes positive and negative) is estimated to be about 2.3 W/m^2, and with increased use of fossil fuels and decrease in soot (which is negative forcing), this number will surely increase to past 3.45 W/m^2.
If one believes that the Sun is in an upward trajectory in TSI which will be sustained (this is not certain scientifically), then the requirement to lower human greenhouse emissions would be even more urgent.
edit on 23-2-2015 by mbkennel because: (no reason given)
edit on 23-2-2015 by mbkennel because: (no reason
given)
edit on 23-2-2015 by mbkennel because: (no reason given)
They can have their winter weather back.
It sucks here.
It is not wierd, it is winter, some will be different than others.
Why dies everyine think that the weather should stay the same all of the time?
It sucks here.
It is not wierd, it is winter, some will be different than others.
Why dies everyine think that the weather should stay the same all of the time?
Statistically, the domain of all the years that truly contain accurate records of weather extremes is very small, and certainly less than 100 years.
We glean additional info from history outside this data set, but they are sporadic and many poorly documented.
Based upon that, think of the probabilities that there have been huge weather anomalies in the last 3 or 4 thousand years, where we really have no data at all. I do not believe that we really understand what extremes really are, since basically, we have insufficient data to correctly extrapolate cycles that probably exists, but know nothing about.
Based upon that, think of the probabilities that there have been huge weather anomalies in the last 3 or 4 thousand years, where we really have no data at all. I do not believe that we really understand what extremes really are, since basically, we have insufficient data to correctly extrapolate cycles that probably exists, but know nothing about.
edit on 23-2-2015 by charlyv because: spelling , where caught
originally posted by: liejunkie01
They can have their winter weather back.
It sucks here.
It is not wierd, it is winter, some will be different than others.
Why dies everyine think that the weather should stay the same all of the time?
May have something to do with us humans being creatures of habit and we also like to believe things like we understand nature and can control it
originally posted by: onequestion
a reply to: charlyv
The ice core samples from Greenland and Antarctica provide plenty of climate data.
What are you talking about?
I am talking short term, localized weather in the US < 4000 years, not long term gas collections in ice cores from many thousands of years.
a reply to: Kali74
You actually have it backwards. The ACRIM Composite is more accurate than the PMOD Composite. More so when we know that magnetic storm strength in the Sun had been INCREASING which points to an increase in solar activity... Not a decrease in activity like you try to claim...
Yes, you did ignore the evidence I posted.
a reply to: mbkennel
Again, 0.25% per century would be a complete range in climate variation from global tropical to ice age, or from ice age to global tropical conditions. Have we gone into an ice age, or has the warming been to global tropical conditions? No. The warming hasn't even exceeded past warming periods such as the Medieval, Roman an Minoan warming periods. Not to mention that the increase in TSI hasn't been constant. From around 1987 until about 2006 the TSI increase had been 0.037% per decade. This is not even taking in consideration the increase in TSI that must have occurred from the early 1900s, which would have been lower than 0.037%, but much higher than 0.005% per decade.
The 0.005% occurred after, in 2006 when all of a sudden the Sun's activity went to very low levels. The sun's activity has been haywire since then, sometimes being low, and sometimes higher than in past years.
And then we also have to take in consideration the weakening of Earth's magnetic field, which also affects the climate.
edit on 24-2-2015 by ElectricUniverse because: add comment.
originally posted by: charlyv
a reply to: mbkennel
Impressive analysis. We know the Earth always likes to throw a monkey wrench into statistics..
I wonder how a few major volcanic events would skew these numbers and thus the difficulty.
They have been seen before. There would be substantial cool spike for 1-3 years and then the previous pattern and upward course would be resumed.
a reply to: ElectricUniverse
Is your point that the Sun's changes have been substantially smaller than human forcing? I agree with that.
Prior to the industrial period the Earth has been cooling slightly since about 8000BC as a result of being on the slow downslope of the Milankovitch cycles. Recent anthrpogenic warming has quickly reversed that. If we were to stop here, then it would probably be OK overall. The problem is not now but the coming future which will be much larger change. Remember that there is a substantial physical time delay.
new topics
-
TLDR post about ATS and why I love it and hope we all stay together somewhere
General Chit Chat: 37 minutes ago -
Hate makes for strange bedfellows
US Political Madness: 2 hours ago -
Who guards the guards
US Political Madness: 5 hours ago -
Has Tesla manipulated data logs to cover up auto pilot crash?
Automotive Discussion: 7 hours ago
top topics
-
Hate makes for strange bedfellows
US Political Madness: 2 hours ago, 12 flags -
CIA botched its handling of sexual assault allegations, House intel report says
Breaking Alternative News: 17 hours ago, 11 flags -
whistleblower Captain Bill Uhouse on the Kingman UFO recovery
Aliens and UFOs: 12 hours ago, 10 flags -
Who guards the guards
US Political Madness: 5 hours ago, 9 flags -
1980s Arcade
General Chit Chat: 14 hours ago, 6 flags -
Teenager makes chess history becoming the youngest challenger for the world championship crown
Other Current Events: 16 hours ago, 4 flags -
Deadpool and Wolverine
Movies: 15 hours ago, 4 flags -
Has Tesla manipulated data logs to cover up auto pilot crash?
Automotive Discussion: 7 hours ago, 2 flags -
TLDR post about ATS and why I love it and hope we all stay together somewhere
General Chit Chat: 37 minutes ago, 2 flags
active topics
-
1980s Arcade
General Chit Chat • 18 • : visitedbythem -
Candidate TRUMP Now Has Crazy Judge JUAN MERCHAN After Him - The Stormy Daniels Hush-Money Case.
Political Conspiracies • 691 • : Threadbarer -
The Fight for Election Integrity Continues -- Audits, Criminal Investigations, Legislative Reform
2024 Elections • 4142 • : IndieA -
Hate makes for strange bedfellows
US Political Madness • 20 • : Cvastar -
SC Jack Smith is Using Subterfuge Tricks with Donald Trumps Upcoming Documents Trial.
Dissecting Disinformation • 107 • : WeMustCare -
What do you guys think of this UFO footage?
Aliens and UFOs • 12 • : Cvastar -
Fast Moving Disc Shaped UFO Captured on Camera During Flight from Florida to New York City
Aliens and UFOs • 21 • : Cvastar -
New York Governor Hochul Assures Business Owners that ONLY Donald Trump is being Targeted.
General Conspiracies • 94 • : WeMustCare -
TLDR post about ATS and why I love it and hope we all stay together somewhere
General Chit Chat • 1 • : network dude -
Russia Ukraine Update Thread - part 3
World War Three • 5714 • : stu119